There is no right time for the Fed to raise rates!

There is no right time for the Fed to raise rates!

Introduction
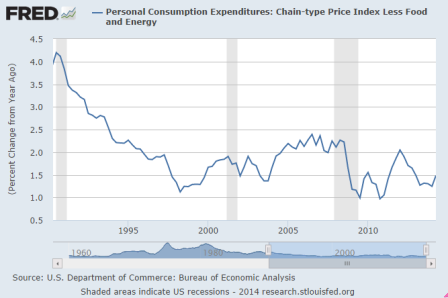
I reject the belief that economy is strong and operating anywhere near full employment. I also reject the belief that a zero-rate policy is inflationary, supports aggregate demand, or weakens the currency, or that higher rates slow the economy and reduce inflation. Additionally, I reject the mainstream view that employment is materially improving, the output gap is closing, and inflation is rising and returning to the Fed’s targets.

What I am asserting is that the Fed and the mainstream have it backwards with regard to how interest rates interact with the economy. They have it backwards with regard to both the current health of the economy and inflation, and, therefore, their discussion of appropriate monetary policy is entirely confused and inapplicable.

Furthermore, while I recognize that raising rates supports both aggregate demand and inflation, I am categorically against raising rates for that purpose. Instead, I propose making the zero-rate policy permanent and supporting demand with a full FICA tax suspension. And for a stronger price anchor than today’s unemployment policy, I propose a federally funded transition job for anyone willing and able to work to facilitate the transition from unemployment to private sector employment. Together these proposals support far higher levels of employment and price stability.

So when is the appropriate time to raise rates? I say never. Instead, leave the fed funds rate at zero, permanently, by law, and use fiscal adjustments to sustain full employment.

Analysis
My first point of contention with the mainstream is their presumption that low rates are supportive of aggregate demand and inflation through a variety of channels, including credit, expectations, and foreign exchange channels.

The problem with the mainstream credit channel is that it relies on the assumption that lower rates encourage borrowing to spend. At a micro level this seems plausible- people will borrow more to buy houses and cars, and business will borrow more to invest. But it breaks down at the macro level. For every dollar borrowed there is a dollar saved, so any reduction in interest costs for borrowers corresponds to an identical reduction for savers. The only way a rate cut would result in increased borrowing to spend would be if the propensity to spend of borrowers exceeded that of savers. The economy, however, is a large net saver, as government is an equally large net payer of interest on its outstanding debt. Therefore, rate cuts directly reduce government spending and the economy’s private sector’s net interest income. And looking at over two decades of zero-rates and QE in Japan, 6 years in the US, and 5 years of zero and now negative rates in the EU, the data is also telling me that lowering rates does not support demand, output, employment, or inflation. In fact, the only arguments that they do are counter factual- the economy would have been worse without it- or that it just needs more time. By logical extension, zero-rates and QE have also kept us from being overrun by elephants (not withstanding that they lurk in every room).

The second channel is the inflation expectations channel. This presumes that inflation is caused by inflation expectations, with those expecting higher prices to both accelerate purchases and demanding higher wages, and that lower rates will increase inflation expectations.

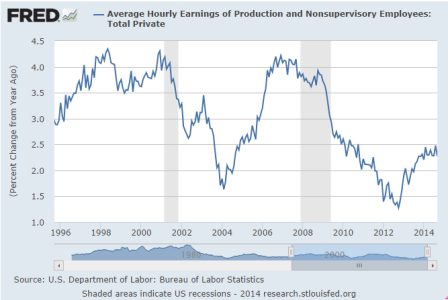
I don’t agree. First, with the currency itself a simple public monopoly, as a point of logic the price level is necessarily a function of prices paid by government when it spends (and/or collateral demanded when it lends), and not inflation expectations. And the income lost to the economy from reduced government interest payments works to reduce spending, regardless of expectations. Nor is there evidence of the collective effort required for higher expected prices to translate into higher wages. At best, organized demands for higher wages develop only well after the wage share of GDP falls.

Lower rates are further presumed to be supportive through the foreign exchange channel, causing currency depreciation that enhances ‘competitiveness’ via lower real wage costs for exporters along with an increase in inflation expectations from consumers facing higher prices for imports.

In addition to rejecting the inflation expectations channel, I also reject the presumption that lower rates cause currency depreciation and inflation, as does most empirical research. For example, after two decades of 0 rate policies the yen remained problematically strong and inflation problematically low. And the same holds for the euro and $US after many years of near zero-rate policies. In fact, theory and evidence points to the reverse- higher rates tend to weaken a currency and support higher levels of inflation.

There is another aspect to the foreign exchange channel, interest rates, and inflation. The spot and forward price for a non perishable commodity imply all storage costs, including interest expense. Therefore, with a permanent zero-rate policy, and assuming no other storage costs, the spot price of a commodity and its price for delivery any time in the future is the same. However, if rates were, say, 10%, the price of those commodities for delivery in the future would be 10% (annualized) higher. That is, a 10% rate implies a 10% continuous increase in prices, which is the textbook definition of inflation! It is the term structure of risk free rates itself that mirrors a term structure of prices which feeds into both the costs of production as well as the ability to pre-sell at higher prices, thereby establishing, by definition, inflation.

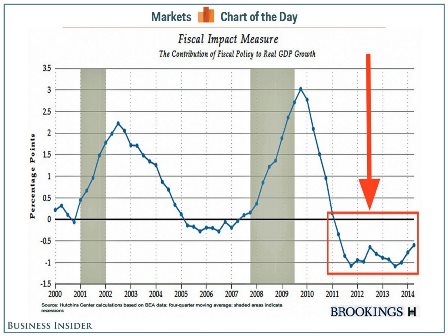
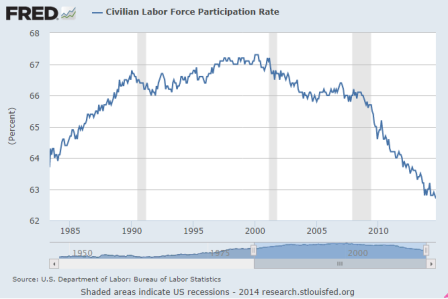
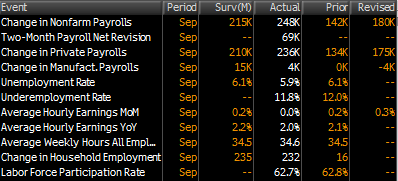
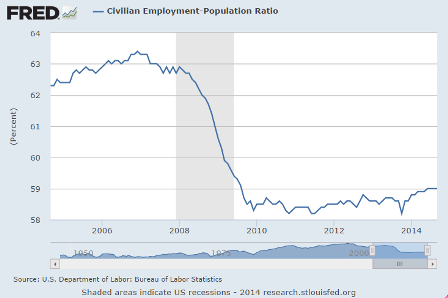
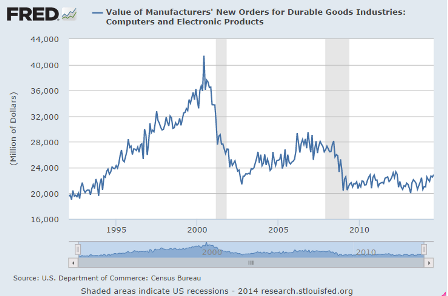
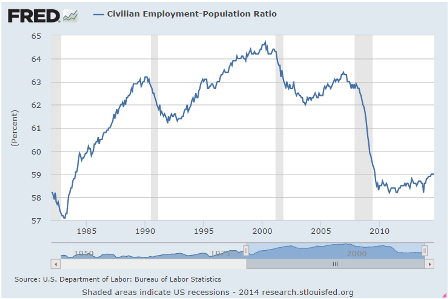
Finally, I see the output gap as being a lot higher than the mainstream does. While the total number of people reported to be working has increased, so has the population. To adjust for that look at the percentage of the population that’s employed, and it’s pretty much gone sideways since 2009, while in every prior recovery it went up at a pretty good clip once things got going:

The mainstream says this drop is all largely structural, meaning people got older or otherwise decided they didn’t want to work and dropped out of the labor force. The data clearly shows that in a good economy this doesn’t happen, and certainly not to this extreme degree. Instead what we are facing is a massive shortage of aggregate demand.

Conclusion
There is no right time for the Fed to raise rates. The economy continues to fail us, and monetary policy is not capable of fixing it. Instead the fed funds rate should be permanently set at zero (further implying the Treasury sell only 3 month t bills), leaving it to Congress to employ fiscal adjustments to meet their employment and price stability mandates.

Export and import prices

Deflationary chill coming in through the trade channel.

Import and Export Prices


Highlights
Cross-border inflationary pressures remain dormant including import prices which fell 0.5 percent in September for the third straight decline. Year-on-year, import prices are deep into the deflationary zone at minus 0.9 percent. The drop in imported petroleum prices, down 2.0 percent in the month and down 6.6 percent year-on-year, is a key factor in the import-price decline, but even when excluding petroleum, import prices fell 0.2 percent in the month. Year-on-year, the ex-petroleum reading is in the plus column but not by much, at plus 0.7 percent.

Export prices fell 0.2 percent for a second straight monthly decline and are also down 0.2 percent year-on-year. Here, agricultural prices are a key factor, down 0.9 percent in the month and down 2.9 percent year-on-year. When excluding agriculture, export prices also fell 0.2 percent on the month and are unchanged year-on-year.

Macro update

First this, supporting what I’ve been writing about all along:

Here’s Proof That Congress Has Been Dragging Down The Economy For Years

By Shane Ferro

Oct 8 (Business Insider) — In honor of the new fiscal year, the Brookings Institution released the Fiscal Impact Measure, an interactive chart by senior fellow Louise Sheiner that shows how the balance of government spending and tax revenues have affected US GDP growth.

The takeaway? Fiscal policies have been a drag on economic growth since 2011.


Full size image

And earlier today it was announced that August wholesale sales were down .7%, while inventories were up .7%. This means they produced the same but sold less and the unsold inventory is still there. Not good!

Unfortunately the Fed has the interest rate thing backwards, as in fact rate cuts slow the economy and depress inflation. So with the Fed thinking the economy is too weak to hike rates, they leave rates at 0 which ironically keeps the economy where it is. Not that I would raise rates to help the economy. Instead I’ve proposed fiscal measures, as previously discussed.

Fed Minutes Show Concern About Weak Overseas Growth, Strong Dollar (WSJ) “Some participants expressed concern that the persistent shortfall of economic growth and inflation in the euro area could lead to a further appreciation of the dollar and have adverse effects on the U.S. external sector,” according to the minutes. “Several participants added that slower economic growth in China or Japan or unanticipated events in the Middle East or Ukraine might pose a similar risk.” “Several participants thought that the current forward guidance regarding the federal funds rate suggested a longer period before liftoff, and perhaps also a more gradual increase in the federal funds rate thereafter, than they believed was likely to be appropriate given economic and financial conditions,” the minutes said.

The case for patience strengthens yet further by a consideration of the risks around the outlook. Across GS economics and markets research, we have recently cut our 2015 growth forecasts for China, Germany, and Italy, noted the continued weakness in Japan, and made a further upgrade to our already-bullish dollar views. So far, our analysis suggests that the spillovers from foreign demand weakness and currency appreciation only pose modest risks to US growth and inflation. But at the margin they amplify the asymmetric risks facing monetary policy at the zero bound emphasized by Chicago Fed President Charles Evans. If the FOMC raises the funds rate too late and inflation moves modestly above the 2% target, little is lost. But if the committee hikes too early and has to reverse course, the consequences are potentially more serious given the limited tools available at the zero bound for short-term rates.

Germany not looking good:

German exports plunge by largest amount in five-and-a-half years (Reuters) German exports slumped by 5.8 percent in August, their biggest fall since the height of the global financial crisis in January 2009. The Federal Statistics Office said late-falling summer vacations in some German states had contributed to the fall in both exports and imports. Seasonally adjusted imports falling 1.3 percent on the month, after rising 4.8 percent in July. The trade surplus stood at 17.5 billion euros, down from 22.2 billion euros in July and less than a forecast 18.5 billion euros. Later on Thursday a group of leading economic institutes is poised to sharply cut its forecasts for German growth. The top economic priority of Merkel’s government is to deliver on its promise of a federal budget that is in the black in 2015.

UK peaking?

London house prices fall in Sept. for first time since 2011: RICS (Reuters) The Royal Institution of Chartered Surveyors said prices in London fell for the first time since January 2011. The RICS national balance slid to +30 for September from a downwardly revised +39 in August. The RICS data is based on its members’ views on whether house prices in particular regions have risen or fallen in the past three months. British house prices are around 10 percent higher than a year ago, and house prices in London have risen by more than twice that. Over the next 12 months, they predict prices will rise 1 percent in London and 2 percent in Britain as a whole. Over the next five years, it expects average annual price growth of just under 5 percent.

British Chambers of Commerce warns of ‘alarm bell’ for UK recovery (Reuters) “The strong upsurge in manufacturing at the start of the year appears to have run its course. We may be hearing the first alarm bell for the UK,” said British Chambers of Commerce director-general John Longworth. The BCC said growth in goods exports as well as export orders for goods and services was its lowest since the fourth quarter of 2012. Services exports grew at the slowest rate since the third quarter of 2012. Manufacturers’ growth in domestic sales and orders slowed sharply from a record high in the second quarter to its lowest since the second quarter of 2013. However, sales remained strong in the services sector and confidence stayed high across the board.

Not to forget the stock market is a pretty fair leading indicator.

Some even say it causes what comes next:

Fed minutes

Bill McBride and I agree this is the key takeaway.

That is, the Fed still sees the risks as asymmetrical and therefore prefers to err on the side of ease. So stocks soar on the belief that low rates from the Fed will support earnings and valuations, as interest rates stay low believing the Fed will keep rates lower for longer.

Theory and evidence, however, continues to support my narrative that 0 rates and QE are deflationary and contractionary biases, and therefore the economy won’t accelerate as hoped for and as forecast by those believing otherwise.

FOMC Minutes: “Costs of downside shocks to the economy would be larger than those of upside shocks”

Note: Not every member of the FOMC agrees, but I think this is the key sentence: “the costs of downside shocks to the economy would be larger than those of upside shocks because, in current circumstances, it would be less problematic to remove accommodation quickly, if doing so becomes necessary, than to add accommodation”.

Talking points for 11am WRKO radio interview

Jobs: Just keeping up with population growth- 59% three months in a row, not at all ‘recovering’ as in prior cycles. So seems the extra jobs are from underestimating population growth?

Spending- working its way lower after the tax hikes and sequesters. Q3 201313 was supported by unsold inventories, Q4 13 by expiring tax credits, then down for Q1 2014 as inventories were reduced and cold weather hurt some, and a Q2 bounce that resulted in only 1.2% growth for the first half of this year:

You can see how in the previous cycle the large drop in the growth rate was followed by a rebound to much higher rates of growth. The current cycle saw a much larger decline in GDP that was followed by lower rates of growth that now seem to be further declining:

You can see the persistent shift down after the last recession that didn’t happen in prior cycles:

Inflation? 6 years of 0 rates, over 4 trillion of QE, and the Fed still can’t hit it’s 2% target? Maybe it’s not so easy to inflate as most think? And just maybe the Fed has it all backward, and 0 rates and QE are deflationary?

Like the hairdresser said, “no matter how much I cut off its still too short”:

Employment report

A lot better than expected, and markets reacting accordingly, and the narrative about the 1.2 million people losing benefits at year end ‘inflating’ the jobs number seems not material based on the numbers so far released:

Employment Situation


Highlights
The labor market improved in September for the most part. Job growth topped expectations, The unemployment rate declined. However, wage inflation is oscillating but remaining on a low trajectory.

Nonfarm payroll jobs gained 248,000, after a 180,000 rise in August and 243,000 increase in July. Net revisions for July and August were up a sharp 69,000. The median market forecast for September was for a 215,000 gain.

The unemployment rate declined to 5.9 percent from 6.1 percent in August. Expectations were for 6.1 percent.

Going back to the payroll report, private payrolls advanced 236,000 in September after a 175,000 boost in August. Expectations were for 236,000.

Average hourly earnings were unchanged in September after a 0.3 percent rise the month before. Average weekly hours ticked up to 34.6 hours versus 34.5 hours in August and expectations for 34.5 hours.

Overall, job growth improved while wage inflation remained soft. The Fed still has many options for policy.

While there were more net new hires, seems the working age population went up quite a bit as well, as the % of the population working remained at relatively low 59% for the third month:

Pending home sales, personal income

Fewer cash buyers and fewer mtg purchase apps also translated into fewer pending home sales:

Pending Home Sales Index


Highlights
The outlook for the used home market remains stubbornly flat, with pending home sales down a disappointing 1.0 percent in August. The Econoday consensus was calling for a 0.8 percent gain. Year-on-year, pending home sales in August were down 2.2 percent which is roughly in line with a 5.3 percent decline for final sales of existing homes in data that were released last week.

A lack of first-time buyers and strong demand for rentals remain key obstacles for home sales. A lack of distressed homes on the market is another negative factor. Mortgage rates for now are still low but are likely to begin to rise as the Fed withdraws stimulus and begins to raise rates, a prospect that points to continued sales weakness ahead.

Regionally, weakness in sales trends for existing homes has been spread evenly with the West lagging slightly. Weakness in today’s report is centered in the Midwest where pending sales fell 2.1 percent for a year-on-year decline of 7.6 percent. The Northeast shows an even steeper 3.0 percent decline in the month though it is the only region with a positive year-on-year rate at plus 1.6 percent. Pending sales rose 2.6 percent in the West though the year-on-year is minus 2.6 percent while the South, which is by far the largest housing region, shows a 1.4 percent decline in the month and no change on the year.

The number of signed contracts to buy existing homes fell 1 percent in August compared to July and is down 2.2 percent from August of 2013, according to the National Association of Realtors

Note that payroll taxes went up Jan 2013, and the sequesters first hit in April, followed by Fed statements that caused mtg rates to gap up about 1% in July or so. We seem to be faltering below the prior 2013 peak and well below prior cycles:

Personal income numbers are not inflation adjusted here:


Highlights
The consumer sector showed improvement in August for both income and spending. Personal income growth posted a 0.3 percent gain in August, following a 0.2 percent rise in July. The latest number matched expectations for a 0.3 percent advance. The wages & salaries component was even stronger with a 0.4 percent boost, following a 0.2 percent increase the month before.

Personal spending jumped 0.5 percent after no change in July. Analysts forecast a 0.5 percent boost. Strength was in the durables component which jumped 1.8 percent after no change in July. August reflected a jump in auto sales. Lower gasoline prices tugged down on nondurables. Nondurable spending declined 0.3 percent after no change in July. Services jumped 0.5 percent in August after being unchanged the month before.

PCE inflation slowed to a monthly no change in August from 0.1 percent in July. The latest figure came in slightly lower than expectations for a 0.1 percent rise. Core PCE inflation posted at 0.1 percent, equaling the pace for July. The median market forecast was for no change.

On a year-ago basis, headline PCE inflation eased to 1.5 percent from 1.6 percent in July. Year-ago core inflation was 1.5 percent in both August and July. Again, PCE inflation remains well the Fed goal of 2 percent but is edging upward.

This is the pre tax personal income:


This is after ‘inflation’/cpi and taxes:

And this is the per capita rate of growth which remains very low:

Here you can see the effect of the Fed’s 0 rate policy and QE on personal interest income, which has stagnated under this policy. Note that I like the 0 rate policy, but I also recognize that it means we need a larger deficit- lower taxes and/or higher spending:

Euro lending to households contracts for 28th month

Weak euro zone lending data underscores need for ECB stimulus

By Eva Taylor

Sept 25 (Reuters) — Lending to euro zone households and companies contracted for the 28th month in a row in August, though at a slower pace, putting a keener spotlight on European Central Bank efforts to get credit flowing again.

Euro zone banks, particularly in the crisis-stricken countries, have tightened up on lending as they adapt to tougher capital requirements and undergo health checks, while companies are holding back on investments, unsure of the future.

The euro zone economy ground to a halt in the second quarter and with inflation in what ECB President Mario Draghi has called the “danger zone” below 1 percent for almost a year now, the ECB saw the need to add new stimulus steps in June and September.

The ECB has now started to offer banks four-year loans at ultra-cheap rates and plans to buy asset-backed securities and covered bonds from October to lighten the weight on banks’ balance sheets and entice them to lend.

But economists in a Reuters poll are skeptical about whether the plan will work, saying bank lending to private euro zone businesses needed to grow at a 3-percent annual rate on a sustained basis to stir inflation.

August lending rates are nowhere near such levels.

In August, loans to the private sector continued to fall, down 1.5 percent from the same month a year earlier after a contraction of 1.6 percent in July, ECB data showed on Thursday. Private sector loans have not grown since April 2012.

“It remains questionable as to how much all the liquidity measures announced by the ECB will encourage banks to lift their lending,” IHS Global Insight economist Howard Archer said.

“…it is also questionable how much businesses’ demand for credit will pick up while the economic and political outlook looks so uncertain,” he said.

WEAK LENDING IN IRELAND

Draghi told Lithuanian business daily Verslo Zinios in an interview published on Thursday a continued weakness in credit growth was likely to curb the euro zone recovery.

Euro zone companies rely mainly on bank funding rather than capital markets, which is why it is so crucial to fix lingering problems in the sector.

For that purpose, the ECB is putting the bloc’s top banks through a thorough review of their balance sheets to weed out bad loans, update collateral valuations and adjust capital.

The picture varies across the euro zone. While lending to companies in Ireland fell at an annual rate of 11.8 percent in August – the fastest decline in three years – and 8.8 percent in Spain, it rose in Finland, Germany and France.

Euro zone M3 money supply – a more general measure of cash in the economy – grew at an annual pace of 2.0 percent in August, up from 1.8 percent in July.

Durable Goods orders

Durable Goods Orders


Highlights
Durables orders fell back in August, coming off July’s surge in aircraft orders. But the core was healthy in August. New factory orders for durables dropped a monthly 18.2 percent, following a spike of 22.5 percent in July. Market expectations were for a 17.1 percent fall. Transportation fell a monthly 42.0 percent in August, following a 73.3 percent jump the month before.

Excluding transportation, durables orders rebounded 0.7 percent, following a decline of 0.5 percent in July. Analysts projected a 0.8 percent gain for August.

Within transportation, nondefense aircraft fell a monthly 74.3 percent, following a 315.6 percent spike in July with both swings essentially reflecting Boeing aircraft orders. Defense aircraft orders slipped 0.6 percent, following a 31.7 percent drop in July. Motor vehicle orders have been moderately volatile but healthy on average, decreasing 6.4 percent after a 10.0 percent boost the prior month.

Outside of transportation, major industries seeing a gain in the latest month were fabricated metals, machinery, computers & electronics, electrical equipment, and “other.” Declines were posted for primary metals.

Orders for equipment investment made a healthy comeback in August. Nondefense capital goods orders excluding aircraft rebounded 0.6 percent in August, following a dip of 0.2 percent the month before. Shipments of this series edged up 0.1 percent but followed a strong 1.9 percent gain in July.

Recent durables orders have shown record volatility. On average, durables orders point to moderate upward momentum in manufacturing.

The yellow line is to show that actual orders have just gotten back to pre recession levels, and that’s not inflation adjusted, so in real terms they haven’t yet caught up.

The red lines are roughly the ‘slope’ which is a proxy for the rate of growth, but it should get ever steeper on this arithmetic chart to indicate the same rate of growth. So the growth rate in this cycle is slowing. And also seems last time around we went into recession before this indicator turned south, while the cycle before that it turned down before we went into recession.


Adjusted for inflation this is still below 2008 levels as well:


Govt cutbacks in evidence here:

Shipments are what counts for GDP. Last month’s gain increased GDP estimates, this month’s reduction reduces them:

And how about that Y2K/.com mania of the late 90’s!