Mtg purchase apps, Vehicle sales, Oil capex, Business equipment borrowing, Equipment sales, New home sales

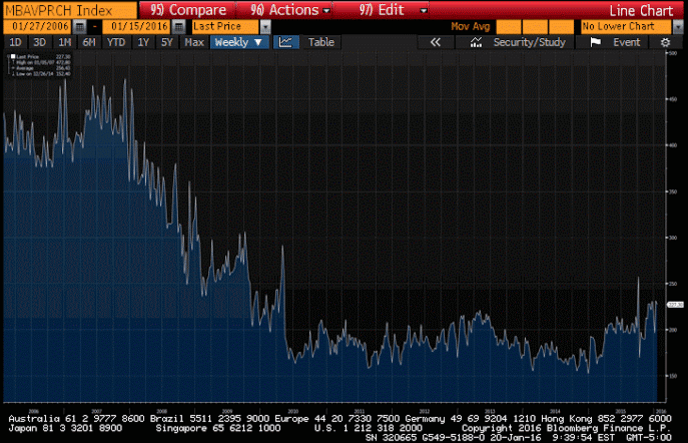
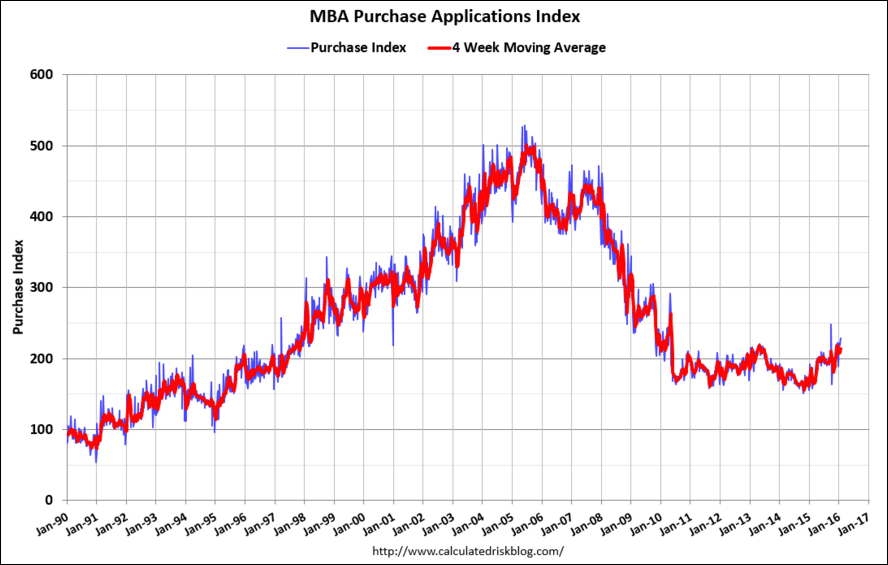
Inching up a bit but still seriously depressed:

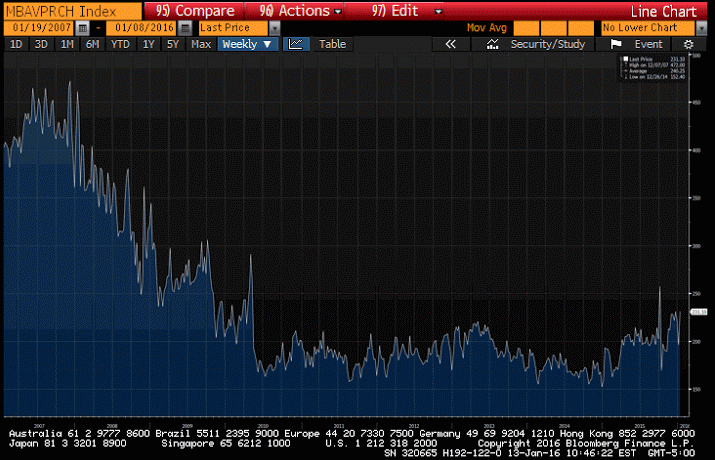
MBA Mortgage Applications
er-1-27-1
Highlights
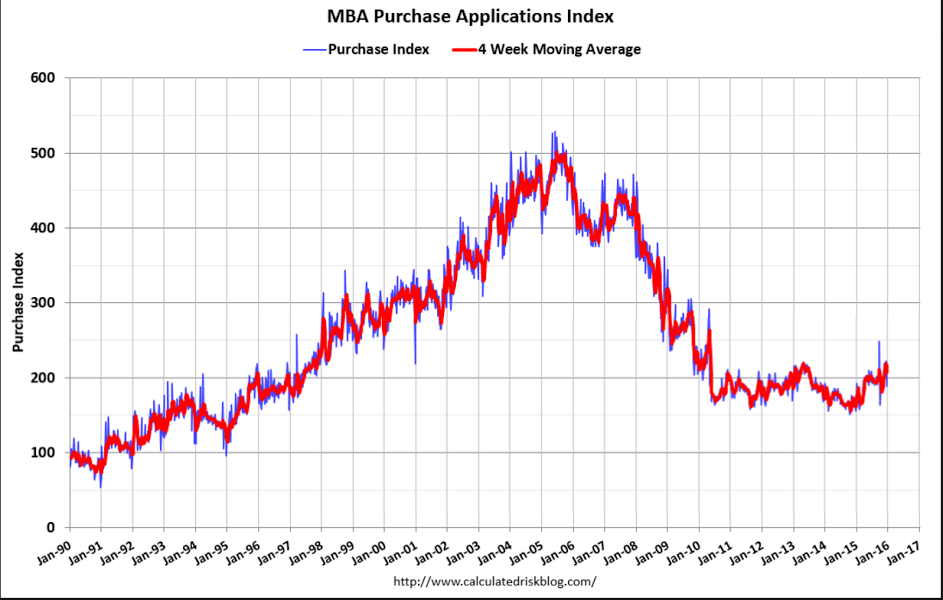
Weekly mortgage applications have been very volatile so far this year but mostly to the upside. Purchase applications jumped 5.0 percent in the January 22 week with refinancing applications up 11.0 percent. Low mortgage rates are driving the activity, down 4 basis points in the week to an average 4.02 percent for 30-year conforming loans ($417,000 or less).
er-1-27-2

Looks like Wards is forecasting no improvement in the annual selling rate that has been decelerating from over 18 million per year for the last several months:

Forecast: January SAAR Set to Reach 10-Year High

A WardsAuto forecast calls for U.S. automakers to deliver 1.13 million light vehicles in January.

The resulting daily sales rate (DSR) of 47,126 units, a 10-year high for the month, over 24 days represents a 6.8% improvement from like-2015 (26 days) and a 19.2% month-to-month decline from December (28 days).

The 5-year average December-to-January decline is 26%, but the traditional pull-ahead of sales in December was not as strong as expected this time. Lighter deliveries allowed dealers to remain well-stocked with vehicles highest in demand going into January.

The report puts the seasonally adjusted annual rate of sales for the month at 17.3 million units, compared with a year-ago’s 16.6 million and December’s 17.2 million.

US shale firms, struggling to profit with US$30 oil, slash spending more

Three major U.S. shale oil companies have slashed their 2016 capital spending plans more than expected in a bid to survive $30 a barrel oil prices, with one of them saying prices would need to rise more than 20 percent just to turn a profit.

The cuts on Monday from Hess Corp, Continental Resources and Noble Energy ranged from 40 percent to 66 percent. This marks the second straight year of pullbacks by a trio of companies normally seen as among the most resilient shale oil producers.

The cuts were steeper than expected. Analysts at Bernstein Energy had forecast an average 2016 spending cut for the sector of 38 percent.

The reductions show budgets may shrink more this year than they did last year, when spending fell between 20 percent and 50 percent. Output at some companies may fall for the first time ever.

“It’s very rare to have spending decline two years in a row,” said Mike Breard, oil company analyst with Hodges Capital Management in Dallas. “Any budget you see published now is going to be much lower than last year.”

But last year many operators managed to lift output as they devised new ways to coax more oil from rock, a feat that seems unlikely to be repeated.

In a sign that a reckoning has come, Continental admitted it will pump about 10 percent less oil this year as it can no longer afford or innovate and sell more oil at depressed prices.

The U.S. government projects domestic crude output to fall by about 700,000 barrels per day (bpd) by the end of this year to around 8.5 million bpd.

Depressed spending typically means fewer drilling rigs. All three companies said they would cut the number of rigs boring new wells in U.S. shale oil fields across Texas, North Dakota and elsewhere.

“If you cut your budget 60 percent, you may drill 40 percent fewer wells and your production is going to drop a considerable amount,” said Breard.

Continental, North Dakota’s second-largest oil producer, said it would slash its 2016 capital budget by 66 percent. The company made the risky move of getting rid of hedges in the fall of 2014. [L2N15A2MB] Led by billionaire wildcatter Harold Hamm, Continental plans to spend $920 million this year, down from $2.7 billion in 2015.

Oklahoma City-based Continental said it will not become profitable until oil prices return to $37 per barrel. U.S. oil prices closed Tuesday at $31.45 per barrel.

Meanwhile, New York-based Hess plans to spend $2.4 billion in 2016, down 40 percent from $4 billion last year.

Noble cut its quarterly dividend 44 percent and said it will cut spending about 50 percent this year.

On the other end of the spectrum, Pioneer Natural Resources, known for its aggressive hedging program, said this month it would spend between $2.4 billion and $2.6 billion this year.

Though Pioneer will fund its 2016 budget in part from a $500 million asset sale, the modest increase from $2.2 billion in 2015 makes the company a relative outlier at a time when most companies are trimming capex by amounts similar to last year’s drastic cutbacks.

U.S. business borrowing for equipment falls in December: ELFA

Borrowing by U.S. companies to spend on capital investment declined 5 percent in December, trade association Equipment Leasing and Finance Association (ELFA) said.

Companies signed up for $12.5 billion in new loans, leases and lines of credit last month, less than a year earlier, but more than double from November, ELFA said.

Cumulative new business volume inched up 0.4 percent for 2015, relatively flat with 2014, ELFA said

Caterpillar warns equipment sales still falling

Caterpillar saw retail sales of machinery fall 16 percent worldwide for the three-month period ended in December, the construction and mining equipment company said on Wednesday.

Caterpillar, which is due to report earnings on Thursday, has been pressured by the global slowdown in the energy and mining industries.

The company said retail sales to resource industries worldwide fell 38 percent over the three-month period, while retail sales to the energy industries fell 32 percent.

The pace of declines is also increasing, the company noted in an SEC filing. The worldwide decline in retail sales of machines had been 11 percent for the three months ended in November.

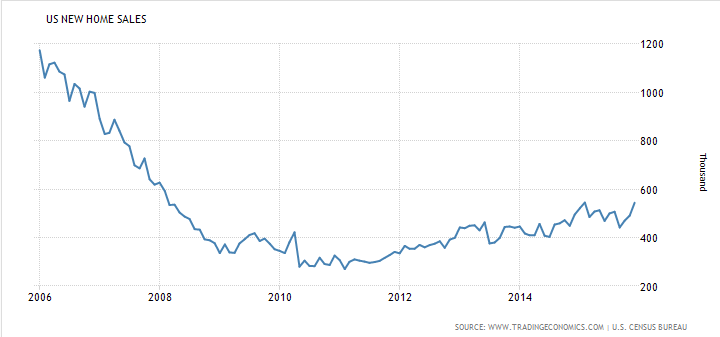
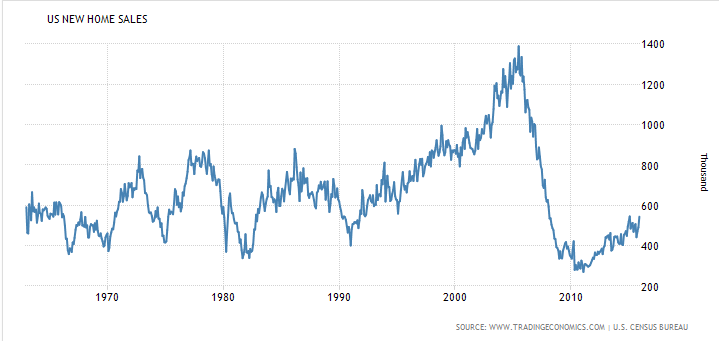
New home sales better than expected, but still near the lows of prior recessions all the way back to the 1960’s when the population was about 60% of what it is now:

New Home Sales
er-1-27-3
er-1-27-4

This is just the last 10 years:
er-1-27-5

Chicago Fed, existing home sales

Still negative:

Chicago Fed National Activity Index
er-1-22-1
Highlights
December was a weak month for the U.S. economy but a little less weak than November, based on the national activity index which improved to minus 0.22 from minus 0.36 (revised lower from minus 0.30). The improvement is centered in the production component as contraction in industrial production eased to minus 0.4 percent from November’s very deep minus 0.9 percent. Other components were steady with sales/orders/inventories and consumption & housing both slightly negative. The only component in positive ground is employment, unchanged in the month at a solid plus 0.12. Despite the improvement in December, the 3-month average fell to minus 0.24 from minus 0.19 in November. This report is a reminder that economic activity is subdued which is a major factor, aside from low oil and commodity prices, holding down inflation.

Up more than expected, but from the chart you can see the average of the last two volatile months is still down a bit vs prior months:
er-1-22-2

Apartment market tightness, Euro area trade surplus, Spain

er-1-15-1

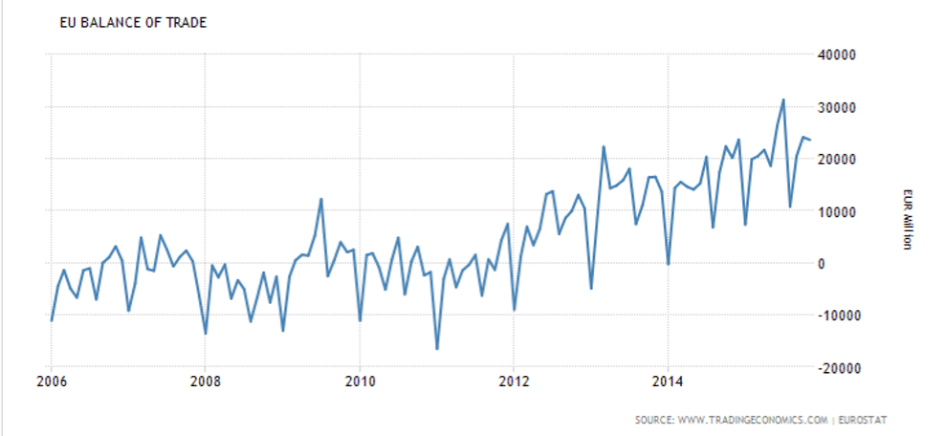
This just keeps going up, which fundamentally tends to drive up the euro which tends to continue to be subject to said upward pressure until the trade picture reverses:

Euro Area Balance of Trade

The Eurozone trade surplus increased to €23.6 billion in November of 2015 compared to a €20.2 billion surplus a year earlier. Exports recorded the highest annual gain in four months and imports rebounded.
er-1-15-12

Potential showdown that could drive up Spanish rates:

Guindos Ditches Pledge on Spain Deficit to Push Growth

By Maria Tadeo

Jan 14 (Bloomberg) — Spanish finance chief Luis de Guindos ditched his promise to meet European Union budget goals saying shoring up economic growth is more important for his country’s future.

De Guindos said worrying about whether the budget deficit comes in a few tenths of a percentage point above the country’s 4.2 percent target for 2015 would be a distraction from the fundamental challenge of protecting the economic recovery.

“What is important is to maintain the pace of growth of the Spanish economy,” he told reporters on Thursday before meeting euro-area finance ministers for the first time since December’s general election left the parliament divided between four major parties.

“The biggest risk for budget policy is that the Spanish economy slows down,” de Guindos added.

Spain risks being drawn into a clash with the European Commission which has been warning since October that the spending plans acting Prime Minister Mariano Rajoy pushed through ahead of the election don’t do enough to curb the currency union’s biggest budget shortfall. Eurogroup chief Jeroen Dijsselbloem, who saw off a challenge from de Guindos to hang on to his job last year, said this month that Spain won’t be allowed any more flexibility over its target, according to El Pais newspaper.

Speaking to reporters on Thursday, Dijsselbloem said Brussels would “wait for the outcome of the domestic political process,” before taking further action.

Mtg purchase apps, China trade

Lots of up and down right now.

The chart indicates purchase apps may be up a bit but still depressed historically.

MBA Mortgage Applications
er-1-13-1
Highlights
The new year is seeing a surge in mortgage activity reflecting a strong jobs market and low rates, according to the Mortgage Bankers Association’s weekly report. Purchase applications surged 18 percent in the January 8 week with refinancing applications up 24 percent. These gains, however, also reflect volatility in weekly measures and largely reverse giant swings in the prior week’s data. The average rate for conforming loans ($417,000 or less) fell 8 basis points in the week to 4.12 percent.

er-1-13-2
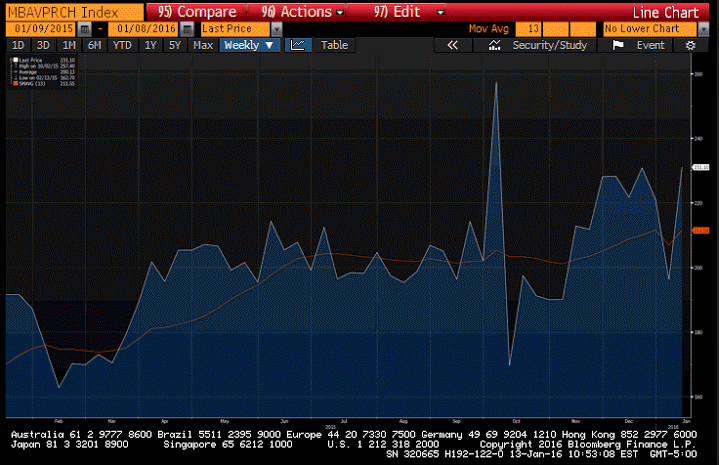
This shows the 3 month moving average in orange for just the last year:
er-1-13-3
This kind of trade surplus ultimately supports the currency, though FDI flows can can and have been much larger recently as previously discussed:

China Trade Surplus Widens in December

China trade surplus increased to USD60.09 billion in December of 2015 from USD49.61 billion reported a year earlier and beating market consensus, as exports and imports fell much less than expected. Year-on-year, outbond shipments declined by1.4 percent to USD224.19 billion, the sixth straight month of fall and the smallest drop since June. Imports dropped by 7.6 percent to USD164.10 billion, the 13th consecutive month of contraction, as a result of declining commodity prices and weak demand.

Saudi pricing, Mtg purchase apps, ADP, Trade, Factory orders, ISM non manufacturing

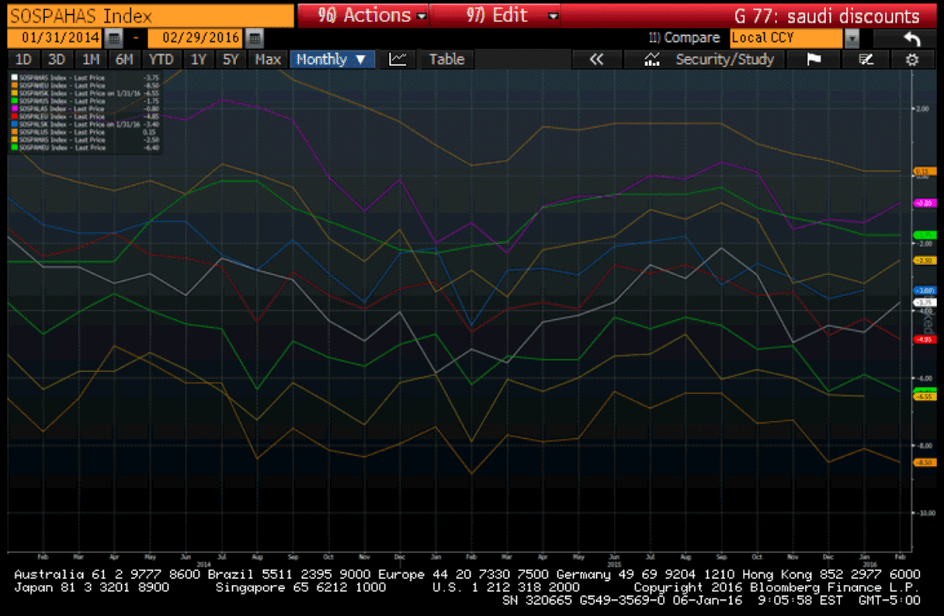
Saudi discounts for February. Some reduced, some increased, so probably more same- prices fall until Saudi output hits its capacity:
er-1-6-1
Zig zagging a lot recently, now back down to where they’ve been for a while:

MBA Mortgage Applications
er-1-6-2
Highlights
Mortgage application activity fell sharply in the two weeks ended January 1, down 15 percent for home purchases and down 37 percent for refinancing. Rates were steady in the period with the average 30-year mortgage for conforming balances ($417,000 or less) up 1 basis point to 4.20 percent. Weekly data can be volatile during the shortened holiday weeks, making the latest results difficult to read. This series will resume its weekly periods beginning next week.
er-1-6-3

This is a forecast for Friday’s jobs report:

ADP Employment Report
er-1-6-4
Highlights
ADP is calling for unusual strength in Friday’s employment report, at 257,000 for private payrolls which is far outside Econoday’s consensus at 190,000 and well outside the high estimate for 227,000. Strength of this degree would underscore the health of the labor market and would begin to seal expectations for a rate hike at the March FOMC. ADP isn’t always an accurate barometer for the employment report but today’s results could definitely affect the markets.

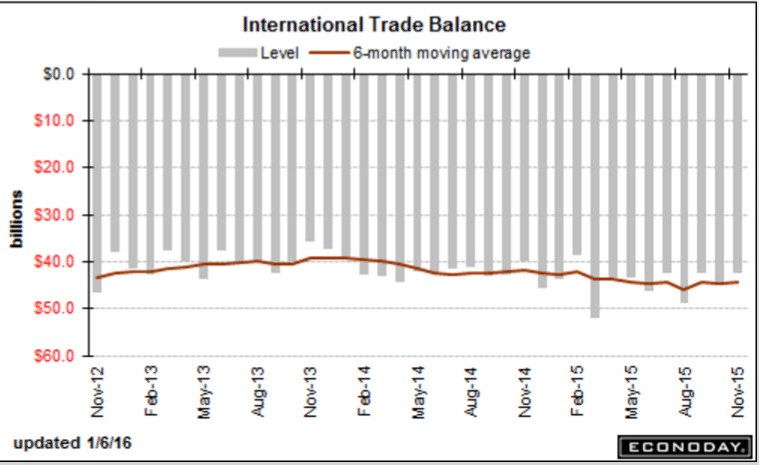
A bit smaller than expected, but again, both imports and exports are falling:

International Trade
er-1-6-5
Highlights
The nation’s trade balance, reflecting weak cross-border activity, narrowed in November to $42.4 billion from a revised $44.6 billion in October. Exports fell 0.9 percent in the month to $182.2 billion with industrial supplies and consumer goods showing the most weakness. Imports fell 1.7 percent to $224.6 billion with both consumer goods and capital goods showing declines.

Despite low oil prices, the petroleum gap widened by $0.9 billion to $5.4 billion due to rising demand. The price of imported oil fell 88 cents to $39.24 for the lowest level since February 2009.

The trade gap with China narrowed by $1.7 billion in the month to $31.3 billion while the gap with Europe widened by $0.4 billion to $13.8 billion. The gap with Mexico narrowed by $1.2 billion to $5.2 billion.

The nation’s fourth-quarter trade balance adjusted for inflation is still trending slightly above the third-quarter which will pull down GDP. But the takeaway from today’s report is slowing global trade.
er-1-6-6

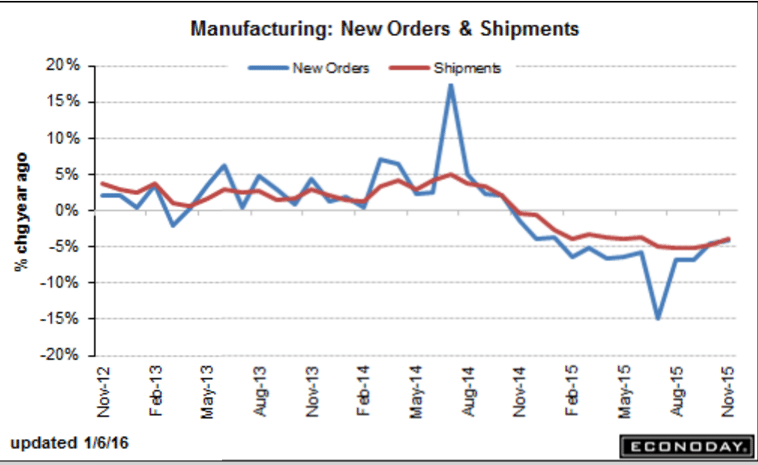
Negative growth continues here:

Factory Orders
er-1-6-7
Highlights
Flat is a good description of the nation’s factory sector as factory orders slipped 0.2 percent in November, making October’s revised 1.3 percent gain look like a rare outlier. Durable goods orders were unchanged in the month while orders for non-durable goods fell 0.4 percent on price weakness for petroleum and coal.

Capital goods data, unfortunately, are mostly weak including a 0.3 percent decline for core orders. Shipments of core capital goods fell 0.6 percent in November and follow October’s 1.0 percent decline in readings that will pull down the business investment component of the fourth-quarter GDP report.

Outside of orders, total shipments edged 0.2 percent higher to end a string of declines that go all the way back to July. Inventories also offer good news, falling 0.3 percent and bringing down the inventory-to-shipment ratio to a less heavy 1.35 vs October’s 1.36. Unfilled orders are another positive, rising 0.2 percent following a 0.3 percent gain in October.

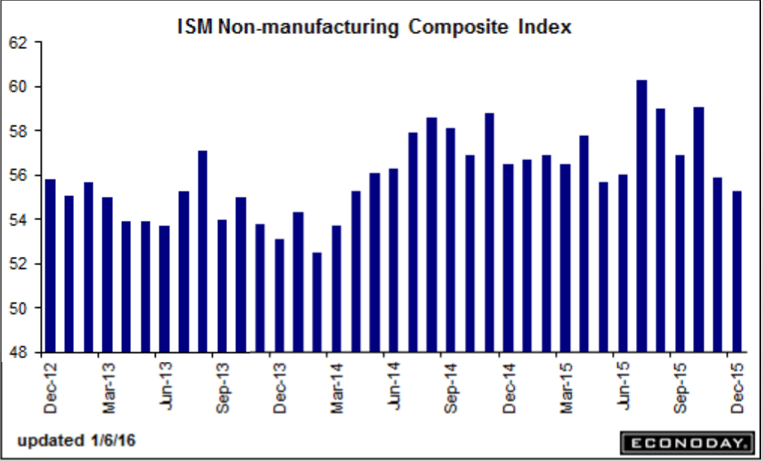
The factory sector is not exactly robust, the result of weak demand for U.S. exports and also weakness in the domestic energy sector reflected in this report by a 13.6 percent monthly plunge in orders for mining & oil field machinery. But the nation’s economy is not narrowly focused on the factory sector, evidenced by healthy readings in today’s ISM non-manufacturing report.

er-1-6-8
Yes, it’s above 50, but the chart indicates the non manufacturing growth rate is melting away:
er-1-6-9

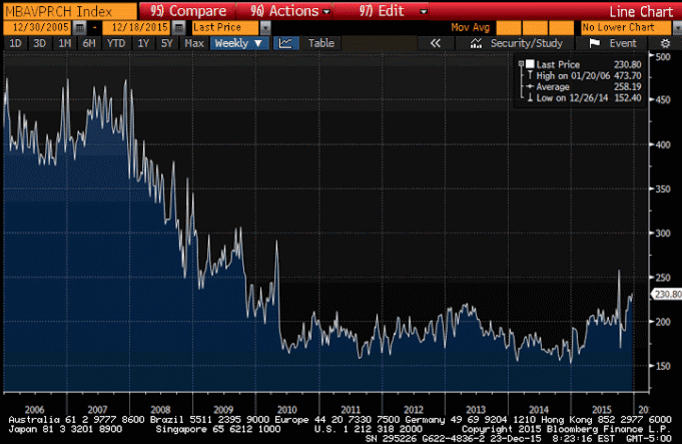
Mtg purchase apps, Durable goods orders, New home sales, Personal income and outlays, Chemicals Activity Barometer

Up some this week. Been bouncing around a lot with looming Fed hike, regulation changes, etc. but mtg apps and home sales remain depressed:
er-12-23-2-11
More bad here:

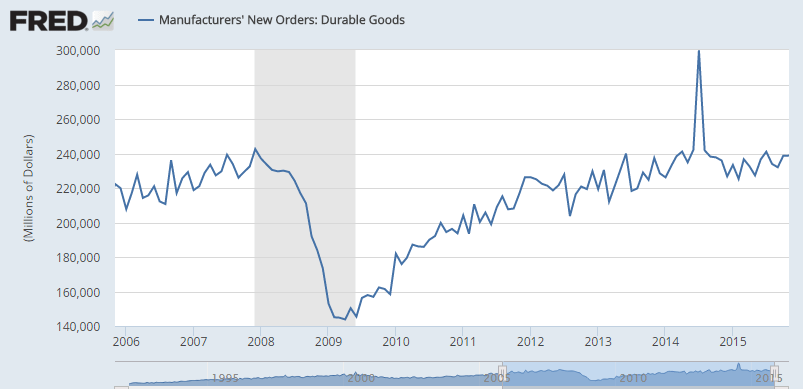
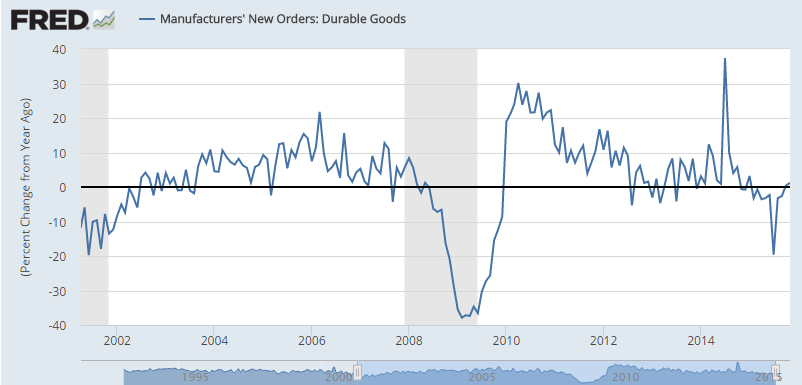
Durable Goods Orders
er-12-23-2-10
Highlights
October was a rare good month for the factory sector, not November where manufacturing production in the industrial production report was no better than unchanged and now new orders were also unchanged. Excluding transportation, orders dipped into the minus column though just barely at minus 0.1 percent.

Capital goods had turned higher in October but, once again, November is a different story with core orders down 0.4 percent and October’s gain shaved in half, and more so from plus 1.3 percent to a revised plus 0.6 percent. Year-on-year, core orders are down a very weak looking 1.8 percent. Core shipment data are also in the negative column, at monthly losses of minus 0.5 percent and minus 1.0 percent for the last two months which is a very poor opening for fourth-quarter business investment.

Outside of core capital goods, shipments in this report did show strength, up 0.9 percent vs, however, a 1.2 percent drop in October. Inventories fell 0.3 percent as manufacturers, facing soft demand, continue to work their stocks lower. The inventory-to-shipments ratio fell 2 notches to a less heavy 1.64. In another positive, unfilled orders rose for a second month, up 0.2 percent following October’s 0.3 percent gain.

Turning to industry data, vehicle orders bounced back, aircraft orders swung lower while electrical equipment, belying construction strength, fell for a second month. Machinery orders were down as were orders for primary metals.

The factory sector, held down by weak exports and weak energy-related demand, appears to be finishing up a soft 2015 on another soft note.

This is not adjusted for inflation. Note it’s only been hovering around the $240 billion level where it was back in 2007:
er-12-23-2-9

er-12-23-2-8

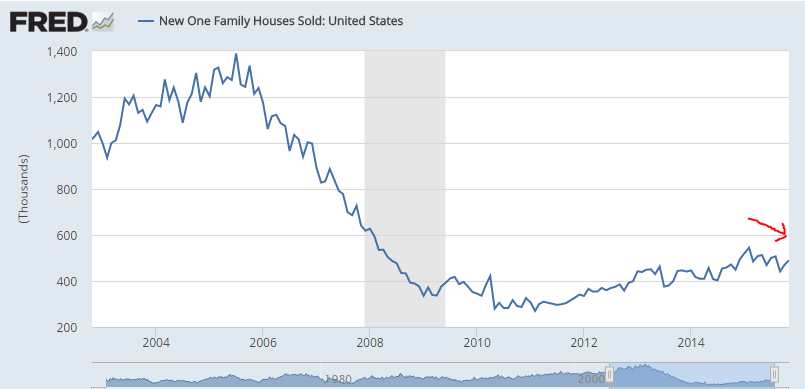
Less than expected and last month revised down as well, as the trend remains lower since peaking when oil capex collapsed, though no one seems to notice…:

New Home Sales
er-12-23-2-7
Highlights
Rising construction is bringing supply into the housing sector and helping to lift new home sales, which rose 4.3 percent in November to what is still however a lower-than-expected annualized rate of 490,000. The month-to-month gain follows a very strong 6.3 percent rise in October which, however, has been revised sharply lower to 470,000 from an initial 495,000. Houses for sale rose 5,000 in the month to 232,000 which is up from 210,000 in November last year. At the current sales rate, supply is at 5.7 months which, because of the rise in sales, is down slightly from October. Still, rising permit data point to more homes coming into the market.

Price data are also constructive, up 6.3 percent in the month to a median $305,000 with the year-on-year, which had been negative, up 0.8 percent. Still, this is a modest year-on-year rate and, relative to the very strong 9.1 percent year-on-year sales gain, points to discounting. Prices in this report appear to have room to move higher.

Regional sales data have the West up more than 20 percent in the month with the year-on-year rate at plus 4.7 percent. Sales in the South, which is by far the largest region, rose 4.5 percent in the month for an outstanding year-on-year gain of 19.4 percent. The Midwest and Northeast both show monthly and yearly declines.

er-12-23-2-6
er-12-23-2-5

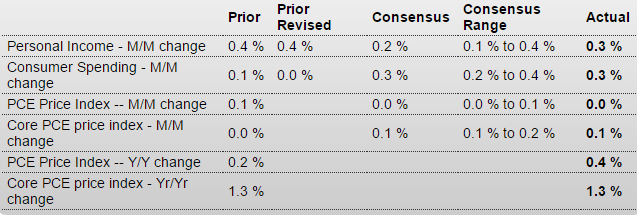
Personal Income and Outlays
er-12-23-2-4

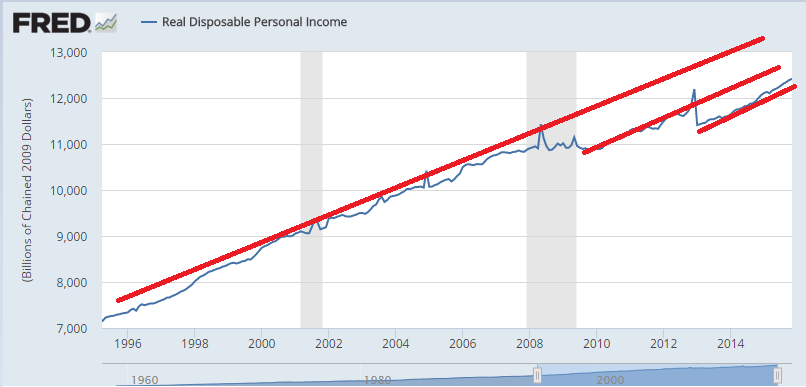
So the problem is, unlike prior recessions, personal income took a substantial hit after 2008 and then didn’t grow fast enough to make up for lost ground. Then it took another hit with the tax hikes and sequesters and again hasn’t grown fast enough to make up for the prior hit:
er-12-23-2-3
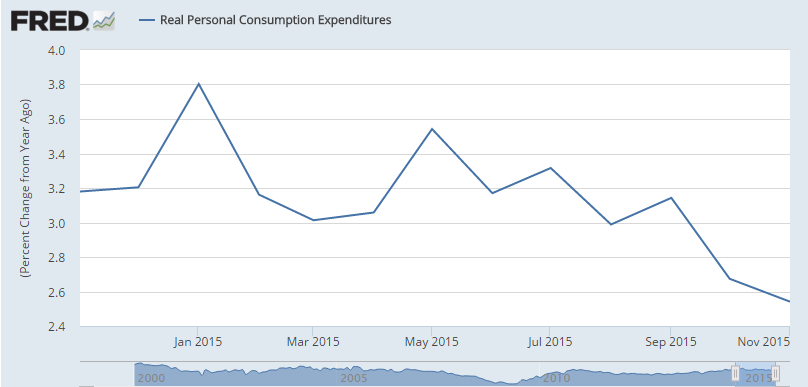
And consumption continues to decelerate since the oil capex collapse about a year ago:
er-12-23-2-2

er-12-23-2-1

Oil prices, Existing home sales chart

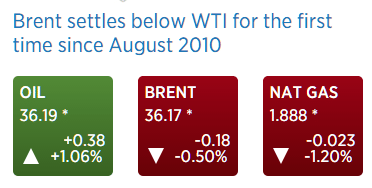
This means ‘the swamp has been drained’ and falling production has eliminated the trapped oil in Cushing that caused WTI to be at a discount to Brent. In fact, Brent should trade at a discount to WTI when the shortage is fully eliminated, reflecting transportation costs to the US.

This, however, does not mean there’s any kind of national shortage or that prices will go up as unlimited imports are continuously available at then current prices, and last I saw the Saudis are still discounting their crudein an attempt to sell their full capacity output as previously discussed:
er-12-22-2-1
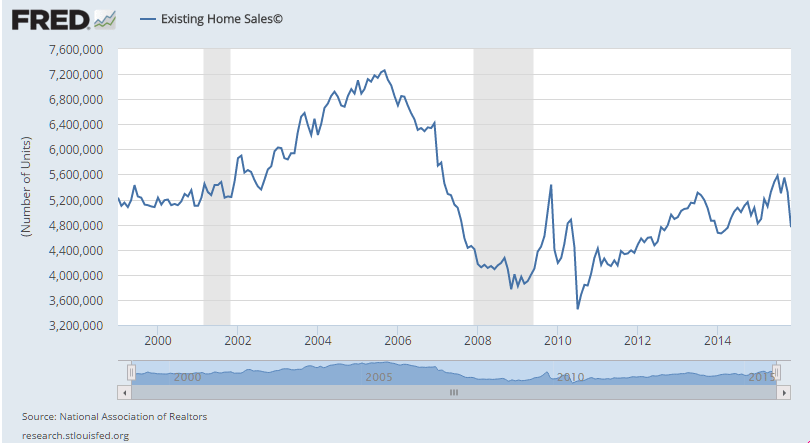
This chart puts it in historical perspective. Housing was forecast to be the ‘driver’ of growth. Unfortunately all it’s done is turn south like most all the other stats, and nothing has stepped up to replace the lost oil capex which had stepped up to offset the tax hikes and sequesters. And remember the population grows at about 3 million per year, so it’s even worse on a per capita basis:

er-12-22-2-2

GDP, existing home sales, Richmond Fed

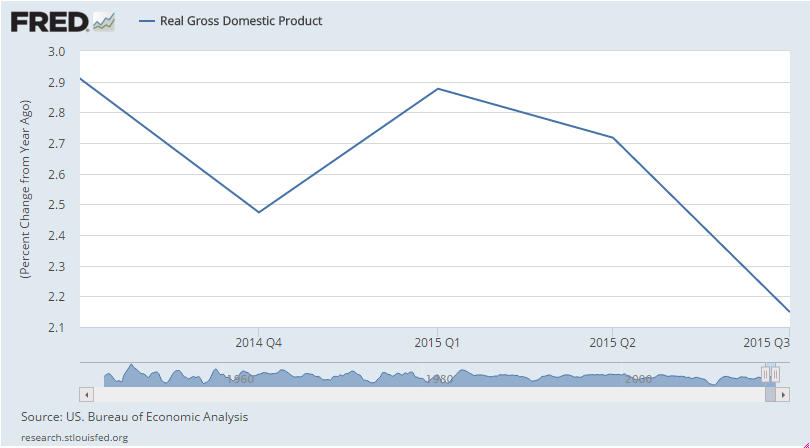
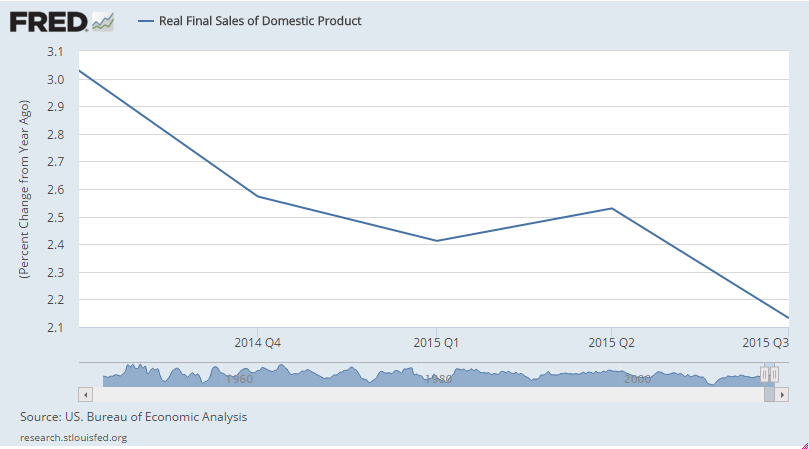
Not so good since oil capex collapsed about a year ago:

GDP
er-12-22-7
Highlights
A downward revision to inventories pulled down the third revision to third-quarter GDP, coming in at an annualized and expected rate of 2.0 percent. Revised inventory growth, at $85.5 billion vs an initial $90.2 billion, was the most negative factor in the quarter, which is actually a plus of sorts as businesses held down inventories due to slowing sales, a move that should limit future disruptions in production and employment. Personal consumption expenditures include a downward revision to service spending, now at an annualized 2.1 percent for a 1 tenth decline. The drag from net exports was raised slightly to $11.5 billion. On the plus side, residential fixed investment was upgraded to a very strong 8.2 percent for a 9 tenths upward revision. Nonresidential fixed investment was also upgraded, up 2 tenths to an annualized plus 2.6 percent in the quarter. In sum, the third-quarter came in at a respectable rate, down from an outsized 3.9 percent bounce in the second quarter that followed a weather depressed 0.6 percent rise in the first quarter. Fourth-quarter GDP is tracking at roughly 2 percent and is likely to get a bounce from the current spree of mild weather.

er-12-22-6

er-12-22-5

er-12-22-4
Serious miss here, and now down from last year. My guess is that there was some buying was accelerated prior to the rate hike:

Existing Home Sales
er-12-22-3

er-12-22-2
“U.S. home resales posted their sharpest drop in five years in November, a potential warning sign for the health of the U.S. economy although new regulations on paperwork for home purchases may have driven the decline.

The National Association of Realtors said on Tuesday existing home sales plunged 10.5 percent to an annual rate of 4.76 million units. That was the sharpest decline since July 2010. October’s sales pace was revised slightly lower to 5.32 million units.

Housing has been providing a sizable boost to U.S. economic growth this year as a strengthening labor market and low interest rates have helped young adults to leave their parents’ homes.”

This went up some, so it will probably make all the headlines:

er-12-22-1

Mtg prch apps, Housing starts, Industrial production, Euro trade

Yes, up vs last year’s dip, but remain depressed and have been
heading south since early this year:

MBA Mortgage Applications
er-12-16-12
Highlights
Application activity was little changed in the December 11 week, up 1 percent for refinancing and down 3.0 percent for home purchases. Year-on-year, purchase applications remain very high, up 34 percent in a gain that in part reflects a pulling forward of demand ahead of what is expected to be a rate hike at today’s FOMC. Rates were little changed in the week with the average 30-year fixed loan for conforming loan balances ($417,000 or less) unchanged at 4.14 percent. The rise in purchase applications points to strength for today’s housing starts and permits data.

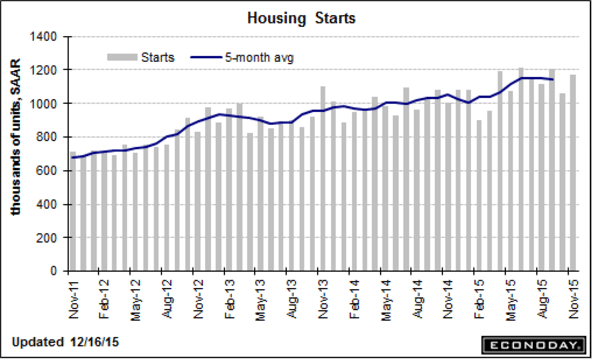
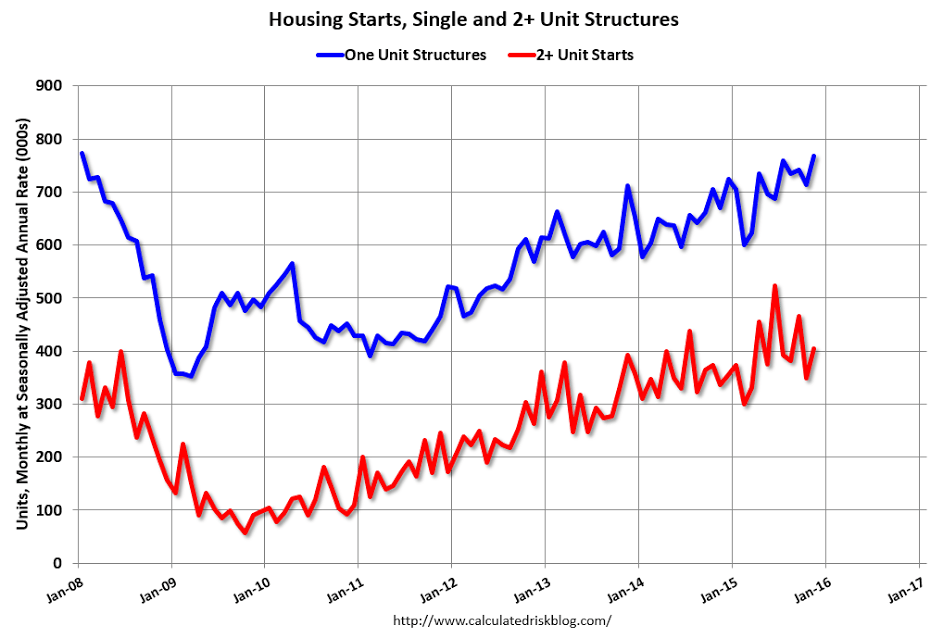
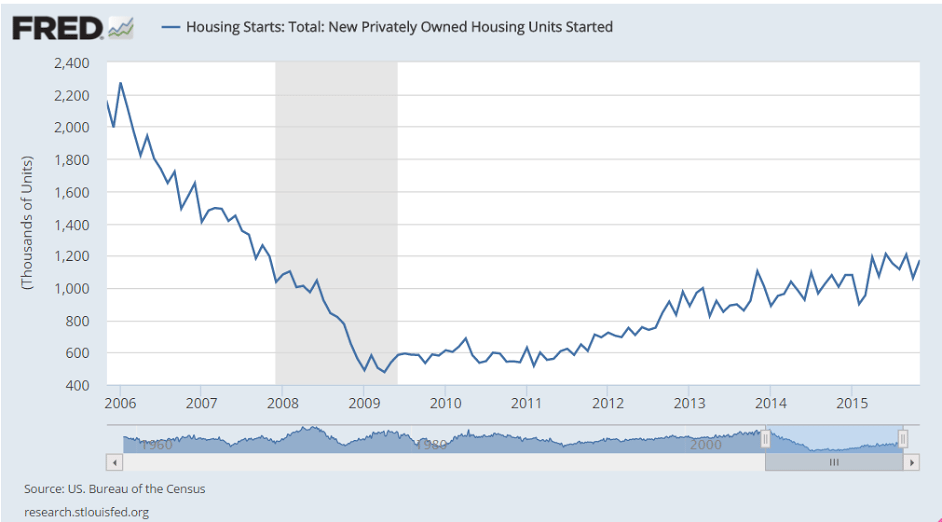
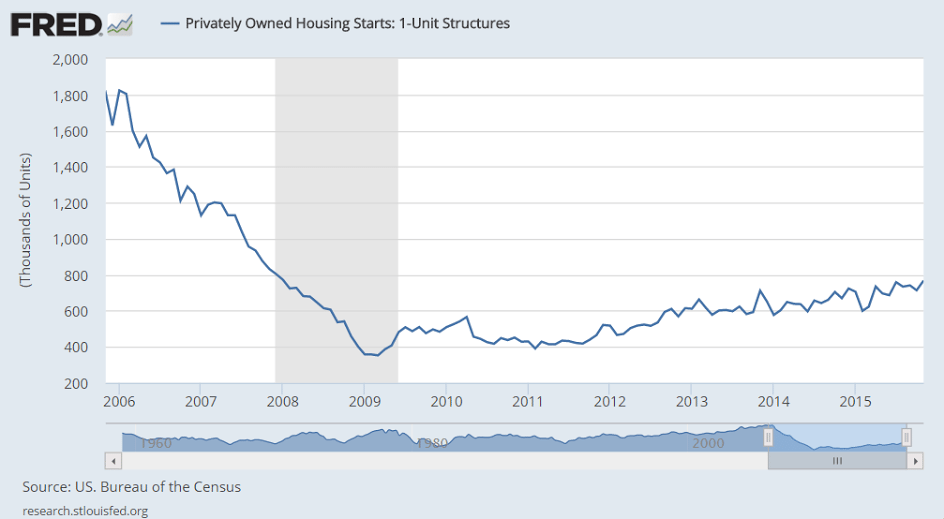
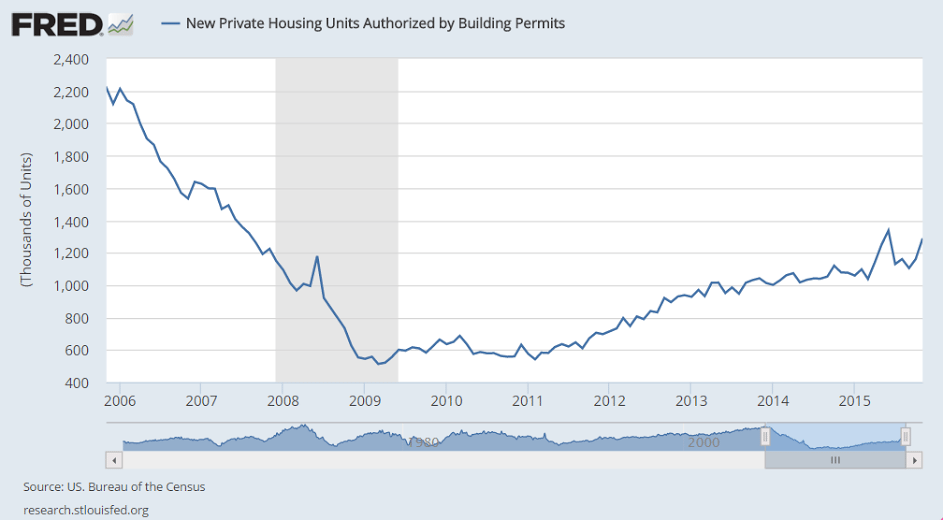
Up, which may give the Fed an excuse to hike rates, but remains severely depressed and gains again are in lower cost multifamily units, and even then the chart shows it’s all only been going sideways since February, with multifamily starts decelerating since the NY tax break expired in June:

Housing Starts
er-12-16-11

Highlights
Housing permits surged in November, up 11.0 percent to a far higher-than-expected annualized rate of 1.289 million and reflecting a 27 percent monthly jump for multi-family units though permits for single-family homes also increased, up 1.1 percent. Starts were also very strong, up 10.5 percent to a 1.173 million rate with multi-family homes again leading the way, up 16.4 percent with single-family homes up 7.6 percent.

Year-on-year rates are robust, up 19.5 percent for permits (single-family up 9.0 percent, multi-family up 36 percent) and up 16.5 percent for starts (single-family up 14.6 percent, multi-family up 20 percent).

Homes under construction offer more good news, up a monthly 2.2 percent to a recovery best rate of 965,000 and up a very strong 18.3 percent year-on-year. Housing completions fell back for a second month in November, down 3.2 percent to a 947,000 to indicate that there’s still plenty of building underway. Year-on-year, completions are up 9.2 percent.

Strength for starts is certainly getting a boost from this winter’s mild weather while the gain in permits points in part to speculative demand, especially for multi-family units. Housing readings have been inconsistent but this report is very constructive for the new home and construction outlooks.

er-12-16-10

er-12-16-9

er-12-16-8

er-12-16-7

er-12-16-6

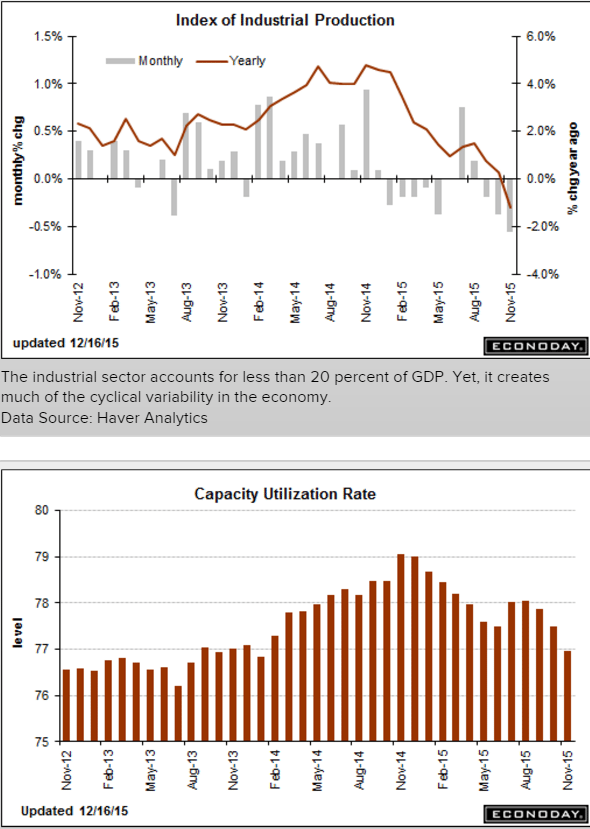
Yet another abysmal report from the industrial sector, which continues the tumble that began when oil capex collapsed about a year ago, and has yet to be ‘replaced’ by some other sector. And lost sales and output also means that much lost income in a downward spiral that can only be reversed by some sector ‘dipping into savings’ to spend that much more. And declining capacity utilization is one measure of slack for the Fed to consider:

Industrial Production
er-12-16-5
Highlights
November was another weak month for the industrial economy, in part reflecting unusually warm temperatures that are driving down utility output. Industrial production came in at the Econoday low forecast, down a very sharp 0.6 percent in November. This is the biggest drop in 3-1/2 years. Utility output fell a monthly 4.3 percent after falling 2.8 percent in October. Mining, reflecting low commodity prices and contraction in energy extraction, has also been week, down 1.1 percent for a third straight decline.

This brings us to the most important component, manufacturing where October’s 0.3 percent bounce higher (revised downward from 0.4 percent) now unfortunately looks like an outlier. Manufacturing production came in unchanged in November reflecting weakness in motor vehicles, down 1.0 percent in the month, and also a dip back for construction supplies which fell 0.2 percent after a weather-related surge of 2.3 percent in October. One positive is a slight snapback for business equipment which, after declines in the two prior months, rose 0.2 percent.

All the weakness is pulling down capacity utilization, to 77.0 percent in November for a heavy 5 tenths dip. Utilization is running more than 3 percentage points below its long-term average. Mining utilization is now under 80 percent, down 1.1 points in the month to 79.4 percent. Utility utilization fell 3.4 points in the month to 74.5 percent with manufacturing utilization down 1 tenth to 76.2 percent. Excess capacity, though not cited as a major factor behind the lack of inflation in the economy, does hold down the cost of goods.

Year-on-year rates confirm the weakness, down 1.2 percent overall with utilities down 7.6 percent and mining down 8.2 percent. Manufacturing is in the plus column but not by much at plus 0.9 percent.

Weather factors are skewing utility output but otherwise, readings are fundamentally soft and reflect the downturn in global demand made more severe for U.S. producers by strength in the dollar.

er-12-16-4
Euro area surplus high and continues to trend higher.

This is super strong currency stuff:
er-12-16-3
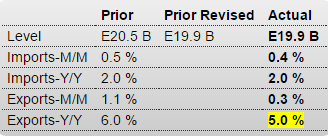
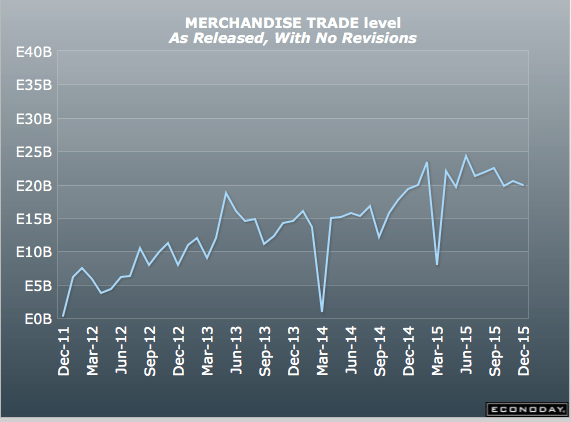
Different aggregate than the above, same message. And note exports growing with a weak global economy:

European Union : Merchandise Trade
er-12-16-2
Highlights
The seasonally adjusted trade balance returned a E19.9 billion surplus in October, matching the downwardly revised outturn in September.

The stability of the headline reflected a 0.3 percent monthly increase in exports and a 0.4 percent gain in imports. Exports stood at their highest level since July and were 5.0 percent above their year-ago level. Imports also recorded a 3-month peak and now show a yearly increase of 2.0 percent.

The October black ink was 3.1 percent below the average level in the third quarter when net exports subtracted 0.2 percentage points from quarterly GDP growth. Lower oil prices are helping to bias down nominal imports but the weakness of the euro should help to ensure a stronger performance from the real external trade sector moving through 2016.

er-12-16-1