
Category Archives: Government Spending
Big snap back in second quarter growth less likely
No mention yet of the deficit being too small…
At sub 3% we comply with the Maastricht limits.
Maybe the plan is to join the euro?
Why else would we allow this?
;)
Big snap back in second quarter growth less likely
By Patti Domm
(CNBC) — After a shocking contraction in first quarter GDP, economists on Thursday pared back growth forecasts for the second quarter due to weaker consumer spending.
Consumer spending in May rose just 0.2 percent, half of what was expected, after being flat in April. Spending by consumers accounts for more than two-thirds of U.S. economic activity, and the lowered growth forecasts now raise concerns that the economy will not be able to rebound to the more than a 3 percent growth rate widely expected for the balance of the year.
Goldman Sachs economists trimmed second quarter tracking GDP to 3.5 percent from 4.1 percent, and Barclays economists said tracking GDP for the second quarter fell to 2.9 percent from 4 percent. At a pace below 3 percent, the economy could show contraction for the first half due to the steep first quarter decline of 2.9 percent.
The median estimate for second quarter GDP fell by a half percent to 3 percent, according to the CNBC Rapid Update of economists forecasts.
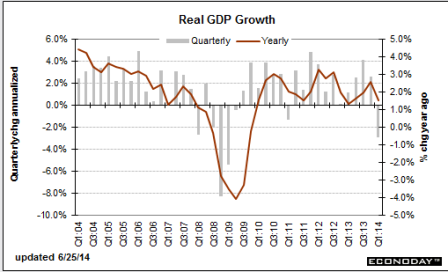
charts and comments GDP, durables, mtg apps, etc.
>
> On Wed, Jun 25, 2014 at 8:52 AM, Sheraz wrote:
>
> Very weak US numbers
>
And not one ‘nice call’ email!!!
And yesterday’s stock market action suggests a possible data leak???
:(
US 1Q GDP has been revised lower by far than expected. After having initially been reported as a 0.1% rise, then a 1% contraction, the third release shows that GDP growth is now reported as -2.9 QoQ% annualised, which leaves annual growth at just 1.5%YoY.
The consensus expectation was for a -1.8% reading. The damage was largely done through the private consumption component, which is now reported as rising just 1% versus 3.1% previously.
Also ‘smoothing’ from numbers that looked high to me in H2 and an adjustment to ACA related healthcare expenses previously booked as PCE:
Full size image
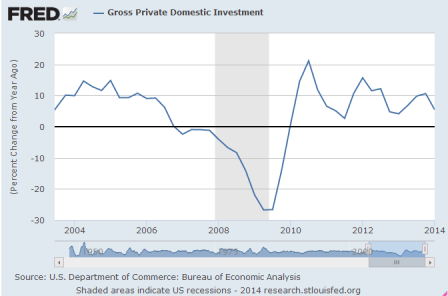
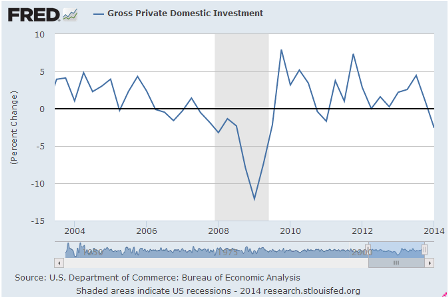
Gross private investment remained an 11.7% contraction
Maybe after a Q4 surge due to expiring tax credits?
Full size image
Full size image
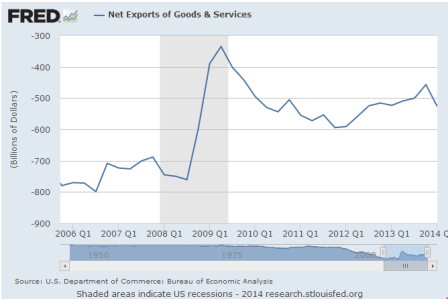
while government consumption was left at -0.8%. However, exports were revised down and imports revised up meaning that the contribution from net trade is to subtract 1.5% from GDP growth rather than 0.95% as previously announced.
Reversing a similar, prior blip up, as previously discussed:
Full size image
Nonetheless, reaction should be fairly muted given widespread expectations of a sharp bounceback in 2Q14 and the fact that the weather had such a damaging impact on 1Q activity. Indeed, we suspect that we could see GDP rise by more than 5% annualised in 2Q.
And if so, H1 would be +1% :(
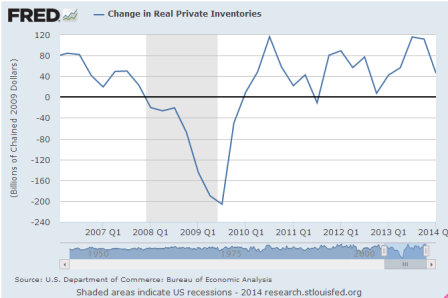
High frequency numbers for the quarter have looked good while inventories should also make a significantly positive contribution after having been run down sharply.
After having been run up in H2. We’ll see where they go from here.
And, as previously discussed after the jump up in Q3, inventory accumulation seldom leads a boom:
Full size image
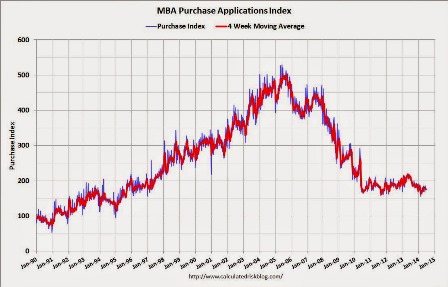
Mortgage purchase apps still dismal:
According to the MBA, the unadjusted purchase index is down about 18% from a year ago.
Full size image
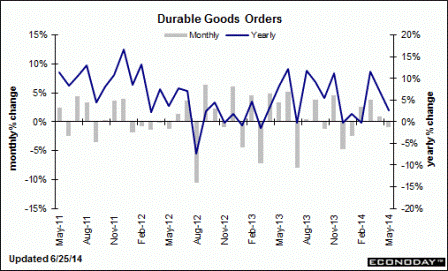
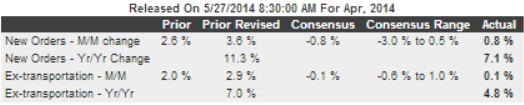
And May durables not so good either:

Highlights
Durables orders were much weaker than expected for May. Durables orders fell 1.0 percent in May after rising 0.8 percent in April. Analysts forecast 0.4 percent. Excluding transportation, orders slipped 0.1 percent, following a 0.4 percent gain in April. Market expectations were for 0.3 percent.
Transportation fell 3.0 percent after a 1.7 percent rise in April. The latest dip was from weakness in nondefense aircraft. Motor vehicles and defense aircraft orders rose.
Outside of transportation, gains were seen in primary metals, fabricated metals, and “other.” Declines were posted for machinery, computers & electronics, and electrical equipment.
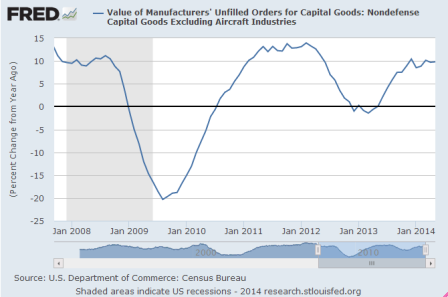
On a positive note, there was improvement in equipment investment. Nondefense capital goods orders excluding aircraft rebounded 0.7 percent in May after decreasing 1.1 percent the month before. Shipments of this series rebounded 0.4 percent after a 0.4 percent dip in April.
The good news is this series is muddling along ok:
Full size image
The latest durables report is in contrast to recently positive regional manufacturing surveys and also the sharp jump in manufacturing production worker hours of 0.8 percent for May. But durables data are very volatile and we likely need a couple of more months of data before taking a negative tone on this sector.
The next leg to fall may be employment, as the 1.2 million people who lost long term benefits at year end may have been taking menial jobs at the rate of maybe 75,000/month or more for 6 months or so, which may have front loaded the monthly jobs numbers. If so, monthly job gains may fall into the 100,000 range soon.
So in general it was down for the winter, back up some, and we’ll see what happens next.
The ‘survey’ numbers and professional forecasts look promising, however it still looks to me like we are under the macro constraint of a too low govt deficit that’s struggling to keep up with the unspent income/demand leakages, with scant evidence of help from growth in private credit expansion.
And I tend to agree with Fed Chair Yellen here, which would tend to keep rates lower/longer if she gets her way. However I don’t agree that low rates somehow support aggregate demand, so I don’t see the likelihood of any call from the Fed or other forecasters for the fiscal relaxation I’ve been proposing.
Yellen may be poised to rewrite Fed’s rule book on wages, inflation
June 25 (Reuters) — “My own expectation is that, as the labor market begins to tighten, we will see wage growth pick up some to the point where … nominal wages are rising more rapidly than inflation, so households are getting a real increase in their take home pay,” Federal Reserve Chair Janet Yellen said last week, adding: “If we were to fail to see that, frankly, I would worry about downside risk to consumer spending.” Over the last year Fed staff changed their main model for forecasting wage and price inflation to reflect evidence that companies were adjusting prices more slowly than in prior years.
My immediate proposals remain 1) A full FICA suspension, which raises take home pay by 7.6%, and, for businesses that are competitive, lowers prices as well, restoring sales/output/employment in short order 2) A $10/hr federally funded transition job for anyone willing and able to work to promote the transition from unemployment to private sector employment 3) A permanent 0 rate policy with Tsy issuance limited to 3 mo bills. 4) Unrestricted campaign contributions, however, say, 40% of any contribution goes to the opposition…
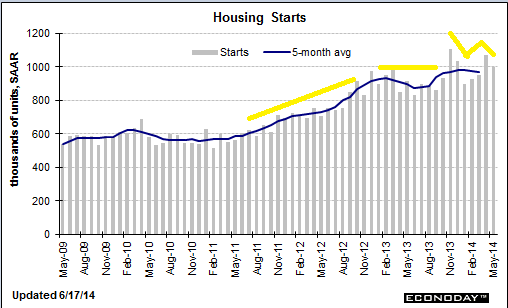
housing starts and other charts
Same pattern- down some for the winter, up some, then backing off some.
If this is in fact what’s happening, Q2 GDP could be up less than 3%, and 2014 sub 2%, or even sub 0, if the demand leakages are allowed to keep the upper hand and a fiscal adjustment isn’t made.
“The Business Roundtable survey showed chief executives forecast GDP growth of 2.3 percent in 2014, down from last quarter’s estimate of 2.4 percent for the year.”
“Federal Reserve Chair Janet Yellen said last month there was a risk a protracted housing slowdown could undermine the economy.”
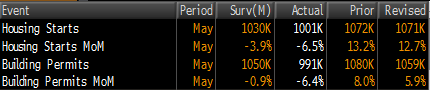
Housing Starts
Highlights
Housing took a step back in May. Starts fell a monthly 6.5 percent but followed a strong 12.7 percent spike in April. The 1.001 million unit pace was up 9.4 percent on a year-ago basis and fell short of expected 1.036 million units.
Single-family starts dropped 5.9 percent after a 4.6 percent rise. Multifamily starts declined 7.6 percent, following a 29.2 percent spike in April.
Building permits followed a similar pattern, suggesting some moderation in construction. Permits fell 6.4 percent after a 5.9 percent rise in April. Permits posted at 0.991 million units and were down 1.9 percent on a year-ago basis. Analysts forecast 1.062 million units.
Builder was up some, but has remained below 50 for 5 months, and by historical standards remains dismal:
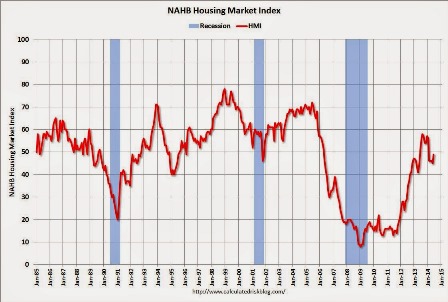
Full size image
Industrial production/manufacturing was up some yesterday, but it’s a relatively small part of the economy and seems to chug along at 3-4% annual growth rates.
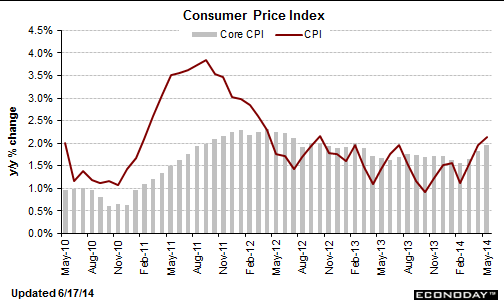
“The core CPI was lifted by a 0.3 percent rise in rent. There were also increases in medical care costs, apparel, new cars prices and airline fares.”
This doesn’t read to me like an ‘excessive demand problem’ that higher rates would reverse. But that’s just me. I agree the Fed may think otherwise!
per student funding drops
Total funding for schools dropped for the 1st time in 2012 since 1977
http://t.co/TeEVQOUJG3 v @FiveThirtyEight pic.twitter.com/59JAj5mUT6
— ProPublica (@ProPublica) June 10, 2014
Review of last weeks data
So my narrative is:
The Federal budget deficit is too small to support growth given the current ‘credit environment’- maybe $400b less net spending in 2014. The automatic fiscal stabilizers are ‘aggressive’, as they materially and continually reduce the deficit it all turns south. The demand leakages are relentless, including expanding pension type assets, corporate/insurance accumulations, foreign CB $ accumulation, etc. etc.
The Jan 2013 FICA hike and subsequent sequesters took maybe 2% off of GDP as they flattened the prior growth rates of housing, cars, retail sales, etc. etc. Q3/Q4 GDP was suspect due to inventory building, a net export ‘surge’, and a ‘surge’ in year end construction spending/cap ex etc. I suspected these would ‘revert’ in H1 2014. It was a very cold winter that slowed things down, followed by a ‘make up’ period. The question now is where it all goes from there. For every component growing slower than last year, another has to be growing faster for the total to increase.
The monthly growth rate of durable goods orders fell off during the cold snaps and the worked it’s way back up, though still not all the way back yet, and the ‘ex transportation’ growth rate was bit lower:
And of note:
Investment in equipment eased after a robust March. Nondefense capital goods orders excluding aircraft dipped 1.2 percent, following a 4.7 percent jump in March. Shipments for this series slipped 0.4 percent after gaining 2.1 percent the prior month.
In general the manufacturing surveys were firm.
Mortgage purchase applications continued to come in substantially below last year, even with the expanded, more representative survey:
According to the MBA, the unadjusted purchase index is down about 15% from a year ago.
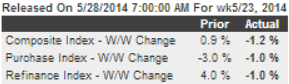
MBA Mortgage Applications
Highlights
Mortgage applications for home purchases remain flat, down 1.0 percent in the May 23 week to signal weakness for underlying home sales. Refinancing applications, which had been showing life in prior weeks tied to the dip underway in mortgage rates, also slipped 1.0 percent in the week. Mortgage rates continue to edge lower, down 2 basis points for 30-year conforming loans ($417,000 or less) to 4.31 percent and the lowest average since June last year.
And then there was the Q1 revised GDP release:

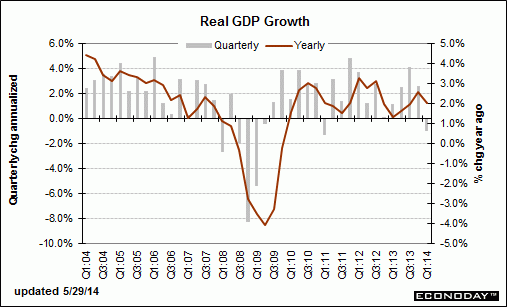
What drove it negative was a decline in inventories, net exports, and construction/cap ex:
The largest revisions to the headline number were from inventories (revised downward by -1.05%) and imports (down -0.36%), and although exports improved somewhat from the prior report, they still subtracted -0.83% from the headline. Fixed investments in both equipment and residential construction continued to contract.
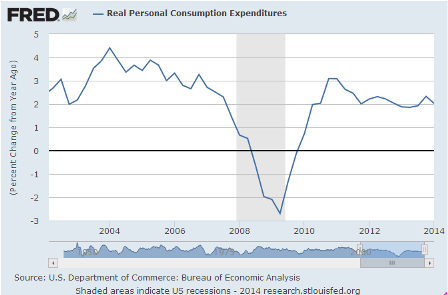
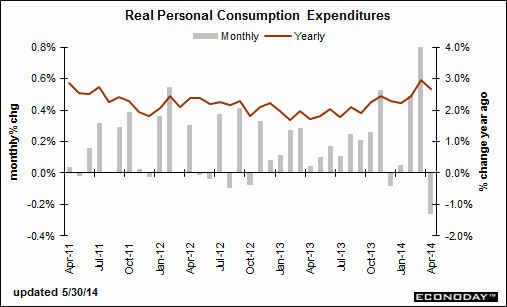
PCE growth was revised up to +3.1% (adding 2.09% to GDP) but seems over 1% of that came from ACA (Obamacare) related and other non discretionary expenditures like heating expenses, etc. The question then is whether the increases will continue at that rate and whether the increased ACA related expenses will eat into other, discretionary expenditures.
The contribution made by consumer services spending remained essentially the same at 1.93% (up 0.36% from the 1.57% in the prior quarter). As mentioned last month, the increased spending was primarily for non-discretionary healthcare, housing, utilities and financial services – i.e., increased expenses that stress households without providing any perceived improvement to their quality of life.
And seems this Chart is consistent with my narrative:
And not that it matters, but just an interesting observation:
And lastly, for this report the BEA assumed annualized net aggregate inflation of 1.28%. During the first quarter (i.e., from January through March) the growth rate of the seasonally adjusted CPI-U index published by the Bureau of Labor Statistics (BLS) was over a half percent higher at a 1.80% (annualized) rate, and the price index reported by the Billion Prices Project (BPP – which arguably reflected the real experiences of American households while recording sharply increasing consumer prices during the first quarter) was over two and a half percent higher at 3.91%. Under reported inflation will result in overly optimistic growth data, and if the BEA’s numbers were corrected for inflation using the BLS CPI-U the economy would be reported to be contracting at a -1.52% annualized rate. If we were to use the BPP data to adjust for inflation, the first quarter’s contraction rate would have been a staggering -3.64%.
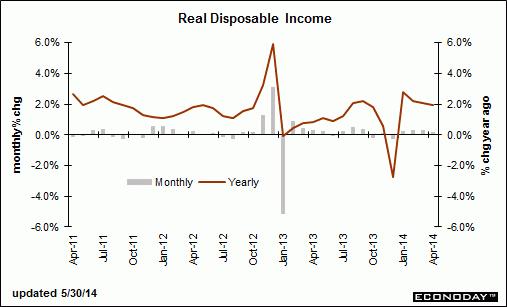
And looks like this will be limiting the next quarter:
Real per-capita annual disposable income grew by $95 during the quarter (a 1.03% annualized rate). But that number is down a material -$227 per year from the fourth quarter of 2012 (before the FICA rates normalized) and it is up only about 1% in total ($359 per year) since the second quarter of 2008 – some 23 quarters ago.
And remember this?
So the question is, how strong will the Q2 recovery be, and where does it go from there?
Again, looks to me like the deficit is having trouble keeping up with the demand leakages, and it keeps getting harder with time?
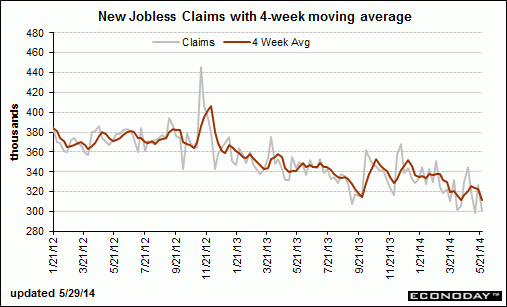
Jobless claims continue to work their way lower, but they are a bit of a lagging indicator and even with 0 claims there aren’t necessarily any new hires, either, for example.
And there’s another couple of issues at work here.
First, 1.2 million people lost benefits at year end, and it’s expected up to half of them will find ‘menial’ jobs during H1. However, corporations don’t add to head count just because unskilled workers lose benefits, so the employment numbers may thus be ‘front loaded’ with higher numbers of hires in H1, followed by fewer hires in H2.
Second, seems the new jobs don’t pay a whole lot, and a lot of higher paying jobs continue to be lost, so the increased employment isn’t associated with the kind of subsequent growth multipliers of past cycles.
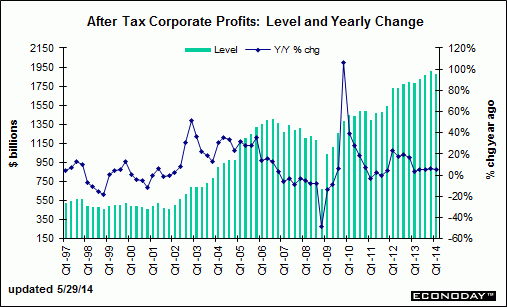
Corporate profits were down over 10% in the Q1 GDP report, and mainly in the smaller companies as the S&P earnings saw a modest increase. Hence the small caps under performing, for example? Not mention earnings also tend to up and down with the Federal deficit:
This year over year pending home sales chart speaks for itself:
Full size image
Another series following the pattern- down for the winter weather, then back up some, and this time then backing off some:
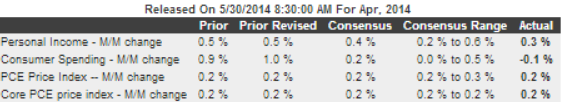
Highlights
Personal income & spending, up 0.3 percent and down 0.1 percent, fell back in April following especially strong gains in March. Wages & salaries slowed to plus 0.2 percent vs a 0.6 percent surge in March while spending on durables, reflecting a pause in auto sales, fell 0.5 percent vs gains of 3.6 and 1.3 percent in the prior two months. Spending on services, however, also fell, down 0.2 percent on a decline in utilities and healthcare after a 0.5 percent rise in March. In real terms, spending fell 0.3 percent following the prior month’s 0.8 percent surge. Price data remain muted, up 0.2 percent overall and up 0.2 percent ex-food and energy. Year-on-year price rates are at plus 1.6 percent and 1.4 percent for the core.
And again, the ACA and other non discretionaries added about 1% in Q1. So, again, it’s down for the winter, then up and this time back down to begin Q2 (with the growth of healthcare expenses backing off some):
New home sales
Another uninspiring chart, as sales dipped with the cold weather and only partially recovered, down vs same month last year, and, at best, looking very flat as we enter the ‘prime selling season’
Not to mention inventories are up and the composition of sales was towards condos, last I read:
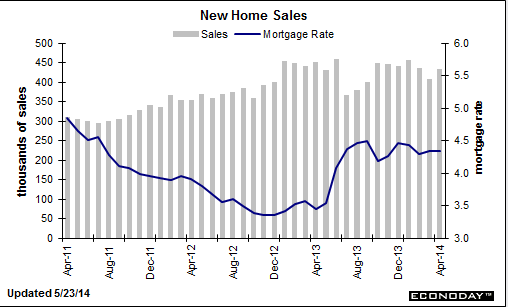
Highlights
April did provide a spring lift to the housing sector at least compared to March, evident in yesterday’s report on existing home sales and especially evident in today’s 6.4 percent jump in new home sales to a higher-than-expected 433,000 annual rate. Also positive is an upward net revision of 11,000 to the two prior months.
A dip in prices contributed to April’s sales strength with the median price down 2.1 percent to $275,800. Year-on-year, the median price is at minus 1.3 percent for only the second negative reading since July 2012. Prices are now in line with sales where the year-on-year rate is minus 4.2 percent.
But, unlike the existing home sales report that shows a sudden swelling in supply, supply on the new home side remains scarce and will remain a negative for sales. Supply was hardly changed on the month, at 192,000 units for sale, while supply at the current sales rate fell to 5.3 months from March’s 5.6 months.
The new home market got an April bounce but against a very weak March. In context, April’s 433,000 is the second weakest rate of the last seven months. Still, the gain is welcome and should give a slight boost to the housing outlook. The Dow is holding at opening highs following today’s report.

Just landed Portland and still somewhat out of close touch.
My concerns remain that the too small federal deficit is keeping a lid on aggregate demand as the demand leakages continue, and the automatic fiscal stabilizers keep tightening the noose even with modest levels of growth.
It’s also possible the monthly employment numbers have been supported by the 1.2 million who lost benefits at year end taking ‘menial’ jobs, which would ‘front load’ jobs to the first several months of 2014, followed by lower than otherwise increases subsequently.
Early car sales forecasts are coming in just over 16 million, so that chart would continue it’s flattish appearance as well.
I’m thinking June numbers will show whether this economy can keep it’s head up with credit expansion sufficient to replace the reduction in govt deficit spending, or head south.
French spending cuts outlined
French Prime Minister Manuel Valls Outlines Spending Cuts
(WSJ) French Prime Minister Manuel Valls unveiled some details as to how the government aims to extract €50 billion ($69 billion) in savings between 2015 and 2017.
Almost reads like he knows savings comes from deficit spending!
;)
Mr. Valls indicated for the first time that the government is prepared to take aim at politically sensitive areas of France’s welfare state to achieve the savings, including freezing benefit and pension payments at current levels for the next year. He also said a freeze in the basic pay of civil servants would continue.
Since the price level is ultimately a function of prices paid by govt, this type of thing is a highly disinflationary force.
“I am obliged to tell the truth to French people. Our public spending represents 57% of our national wealth. We can’t live beyond our means,” Mr. Valls said.
Which is true under their current institutional arrangements. So seemes no move to ‘change the rules’
Mr. Valls said the central state would account for €18 billion of the savings; local authorities €11 billion; health care €10 billion; and social security €11 billion.
CBO estimates lower deficits as health subsidies fall
As suspected Obamacare doesn’t add to the deficit, otherwise the Republicans would have let us know for sure!
However, it also means it’s a pro active contractionary bias that will make it that much harder for GDP growth to meet expectations this year.
CBO estimates slightly lower deficits as health subsidies fall
April 14 (Reuters) — U.S. budget deficits over the next decade will be $286 billion less than previously estimated, the Congressional Budget Office said on Monday, attributing much of the decline to lower estimates of subsidy costs under President Barack Obama’s health insurance reform law.
The non-partisan CBO, in revisions to its annual budget estimates, said the fiscal 2014 deficit would fall to $492 billion from $514 billion estimated in February. The forecasts assume no changes to current tax and spending laws.
The agency attributed the current year’s decline to technical revisions to the way it estimates spending on discretionary programs. But from fiscal 2015 onwards, it estimates a $186 billion decline in outlays for health insurance subsidies under the Affordable Care Act, commonly known as Obamacare.
This reflects a lower projection of premiums charged for health care plans offered through government-run exchanges, CBO said, based on an updated analysis of plans now being offered.
Overall, the budget referee agency now projects cumulative 10-year deficits at $7.62 trillion compared to its previous forecast of $7.9 trillion.
In addition to the lower health insurance subsidy costs, CBO also estimated a $98 billion 10-year reduction in Medicare outlays due to lower spending on prescription drugs and hospital insurance. Medicaid, the health care program for the poor, would see a $29 billion reduction, CBO said.
CBO lowered its 10-year cost estimate for the federal food stamps program by $24 billion, based on new data from the Department of Agriculture on monthly average benefits.
But the CBO left intact its previous economic projections, which envision rising deficits after 2015 as more of the massive “baby boom” generation retires or drops out of the workforce.
Deficits will reach a low point of $469 billion, or 2.6 percent of U.S. economic output, in 2015, then gradually start to rise, topping $1 trillion again in 2023 and 2024.
U.S. deficits exceeded that dollar amount during each of the first four years of Obama’s administration as the economy recovered slowly from the worst recession since the 1930s, falling to $680 billion in fiscal 2013.
consumer credit and a few comments
Note the year over year rate of growth:
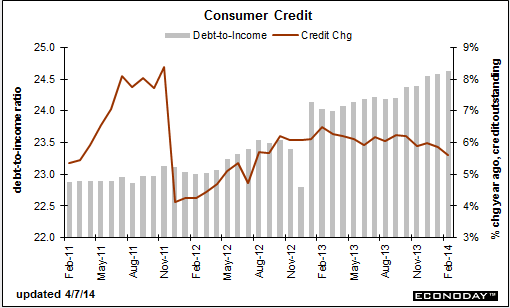
As previously discussed, in order for GDP to grow at last year’s pace all the pieces, ‘on average’ have to do same.
And so far, housing and cars are well below last year’s growth rates.
And the contribution of net govt spending is well below last year’s contribution.
And so far net export growth isn’t coming to the rescue.
Nor is consumer credit driving spending.
Even capex just took a hit.
And the personal income growth rate isn’t looking like it’s ‘bounced’ any.
Employment growth, a lagging indicator that’s largely a function of sales, if anything looks a tad less as well.
The ‘surveys’ are still showing positive growth, and maybe they’ll turn out to be correct. But I have noticed a tendency for their responses to be influenced by the stock market.
Hopefully we’ve just had a weather pause, and the consumer and business celebrate spring with a material surge of spending that exceeds their incomes to off set the ongoing ‘demand leakages’.
But if not, growth slips into reverse until the federal deficit again gets large enough to stop the slide.