2008-01-30 US Economic Releases

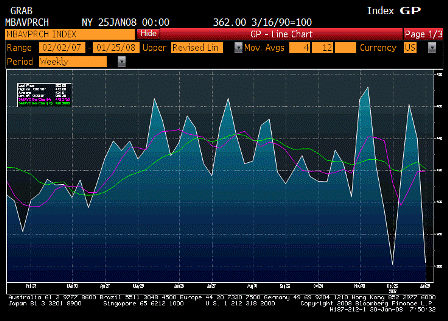
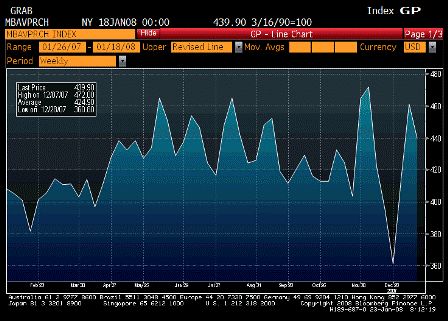
2008-01-30 MBAVPRCH + 4 Wk Ave + 12 Wk Ave

MBAVPRCH Index + 4 Wk Ave + 12 Wk Ave

From Karim:
very volatile series-see chart-white line is purchase index-purple line is 4wk avg and green line is 12wk avg-latter is probably best indicator of trend and looks like still heading lower. Of course this series also reflects multiple applications for same home purchase, which is more likely over the past few months in light of tighter standards for many borrowers, so probably have to adjust for that compared to same series a year ago.


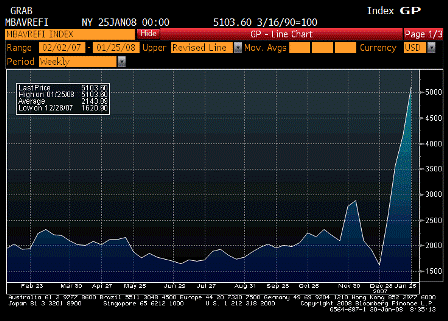
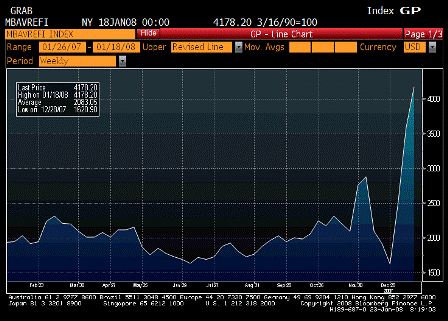
2008-01-30 MBAVREFI

MBA Refinancing Index (Jane 25)

Survey n/a
Actual 5103.6
Prior 4178.2
Revised n/a

Refi index positive for ‘market functioning’, but purchase index could be softening.

As before, winter housing numbers are volatile.


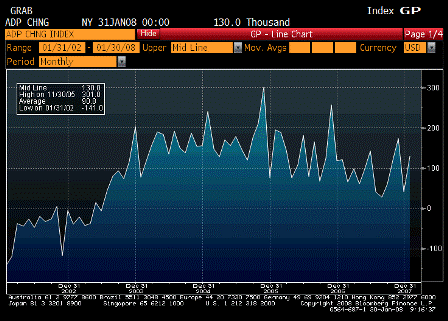
2008-01-30 ADP Employment Change

ADP Employment Change (Jan)

Survey 40K
Actual 130K
Prior 40K
Revised 37K

Not the stuff of recession. While not a reliable predictor of Friday’s payroll report, it is a ‘real’ number as it’s ADP’s report of 392,000 business it services.


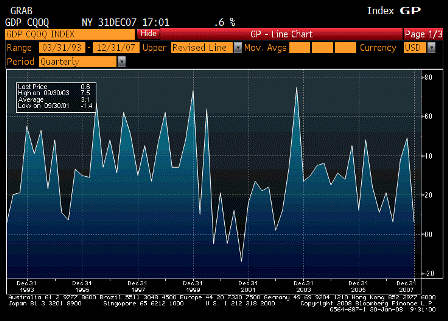
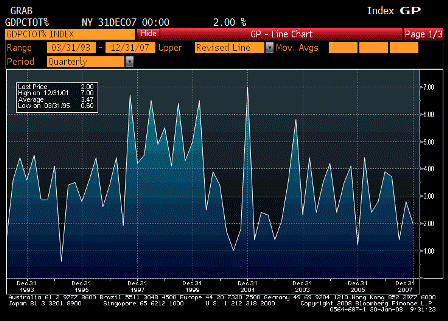
2008-01-30 GDP Annualized

GDP Annualized (4Q A)

Survey 1.2%
Actual 0.6%
Prior 4.9%
Revised n/a

Lower than expected but still positive, consumer up 2% which is far from recession, and final sales for domestic purchases were up 1.4%, and the Dec export number won’t be reported until Feb 14. The durable goods number yesterday may portend a higher than estimated export number for the next Q4 GDP revised report. Inventories were burned off by 1.25% of GDP, which is also generally not indicative of recession.


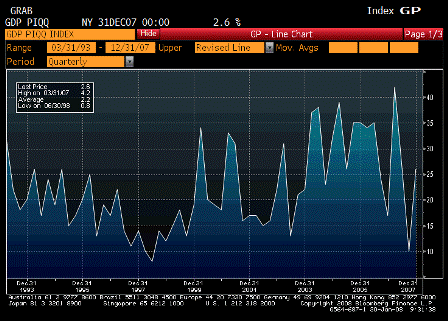
2008-01-30 Personal Consumption

Personal Consumption (4Q A)

Survey 2.6%
Actual 2.0%
Prior 2.8%
Revised n/a

Down but not terrible, and not the stuff of recession


2008-01-30 GDP Price Index

GDP Price Index (4Q A)

Survey 2.6%
Actual 2.6%
Prior 1.0%
Revised n/a

Not good.


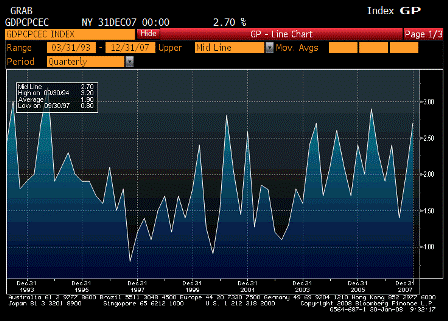
2008-01-30 Core PCE QoQ

Core PCE QoQ (4Q A)

Survey 2.5%
Actual 2.7%
Prior 2.0%
Revised n/a

Very troubling to the Fed. Mainstream theory says you can’t let core elevate. The cost to bring it down is much higher than any possible losses due to near term weakness caused by keeping rates high.


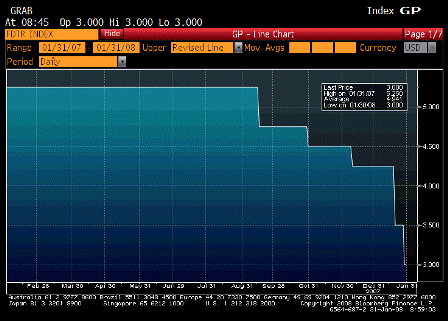
2008-01-30 FOMC Rate Decision

FOMC Rate Decision (Jan 30)

Survey 3.0%
Actual 3.0%
Prior 3.5%
Revised n/a

♥
2008-01-29 US Economic Releases

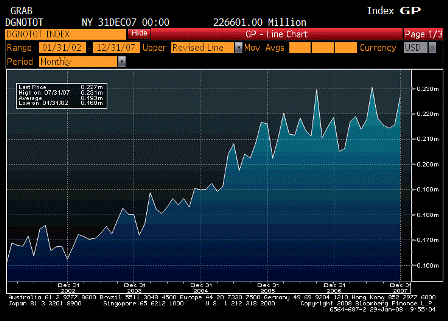
2008-01-29 Durable Goods Orders Total

Durable Goods Orders Total (Dec)

Survey n/a
Actual 226,601
Prior 215,433
Revised n/a

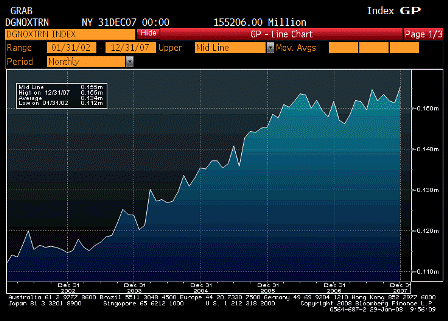
2008-01-29 Durables Ex Transporation Total

Durables Ex Transportation Total (Dec)

Survey n/a
Actual 155,206
Prior 151,303
Revised n/a

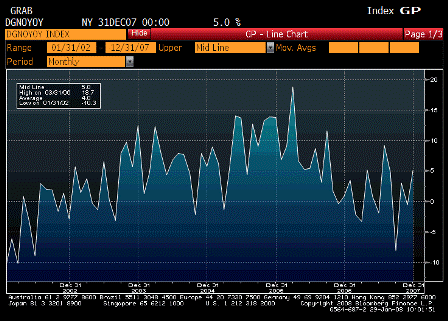
2008-01-29 Durable Goods YoY % Change

Durable Goods YoY % Change

Survey n/a
Actual 5.0%
Prior -0.6%
Revised n/a

Doesn’t look much like recession to me. November revised up to where last month’s number might have changed impressions as well.

This also increases the chances that the December employment number gets revised up this Friday, along with a lower unemployment number for January.

From Karim:

The 5.2% rise in DGO is a bit of a mixed bag
–81% rise in aircraft orders (likely to help exports)
–ex-aircraft and defense still up 4.4%;

Yes, that’s what an export economy looks like.

but looks like making up for lost ground as 3mth trend (annualized) falls from -1.2% to -2.8%
–more troubling is shown in chart attached; inventory/shipments ratio threatening multi-year highs (inverted on chart); suggests more downside for industrial production in period ahead

Or it could mean larger shipments being readied.

Unfilled orders up 2.5% month over month; up 18.5% year over year,

Johnson-Redbook and ICSC chain store sales reflect weak January; sales about flat to December.

Yes, that’s what an export economy looks like. Decent employment but weaker domestic real consumption, as more of the output gets shipped abroad rather than getting consumed domestically.

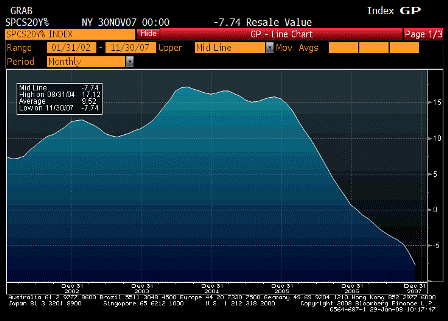
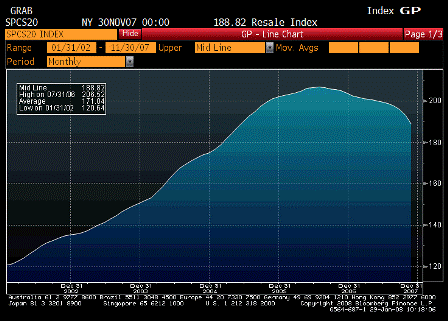
Case-Shiller Index falls from -6.07% y/y to -7.74% y/y. 10 largest metro-areas fall from -6.67% to -8.42% y/y.

Yes, a November number. Real estate in largest areas was still falling back then.


2008-01-29 S&P/CS Composite-20 YoY

S&P/CS Composite-20 YoY (Nov)

Survey -7.1%
Actual -7.7%
Prior -6.1%
Revised n/a

2008-01-29 S&P/CS Home Price Index

S&P/CS Home Price Index (Nov)

Survey n/a
Actual 188.8
Prior 192.9
Revised 192.9

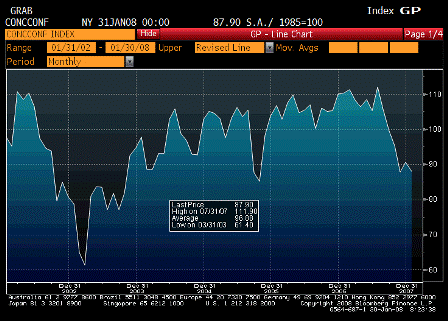
2008-01-29 Consumer Confidence

Consumer Confidence (Jan)

Survey 87.0
Actual 87.9
Prior 88.6
Revised 90.6

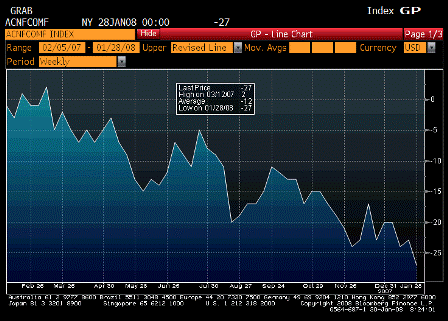
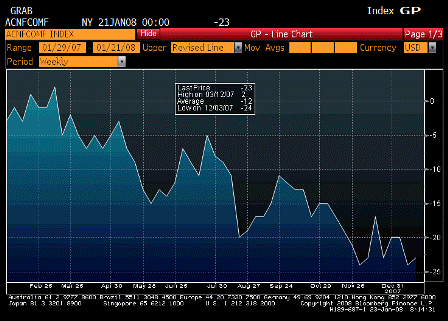
2008-01-29 ABC Consumer Confidence

ABC Consumer Confidence (Jan)

Survey -24
Actual -27
Prior -23
Revised n/a

Still looking weak. But with CNBC turning more positive on the economy, this might turn up soon.


2008-01-28 US Economic Releases

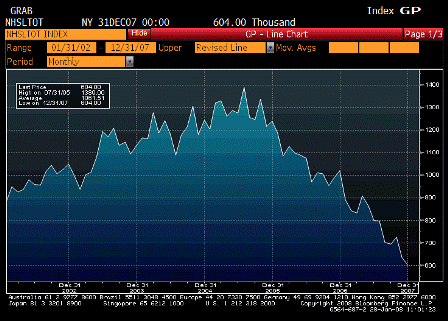
2008-01-28 New Home Sales

New Home Sales (Dec)

Survey 647K
Actual 604K
Prior 647K
Revised 634K

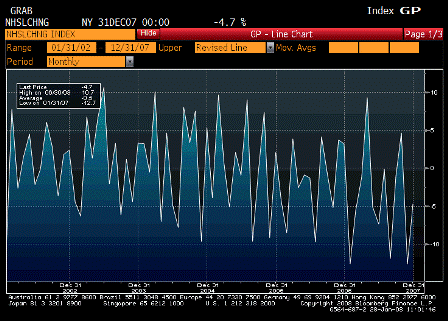
2009-01-28 New Home Sales MoM

New Home Sales MoM (Dec)

Survey 0.0%
Actual -4.7%
Prior -9.0%
Revised -12.6%

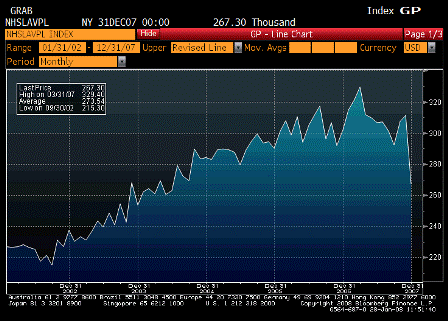
New Home Sales Average Price

Survey n/a
Actual 267.3
Prior 311.2
Revised n/a

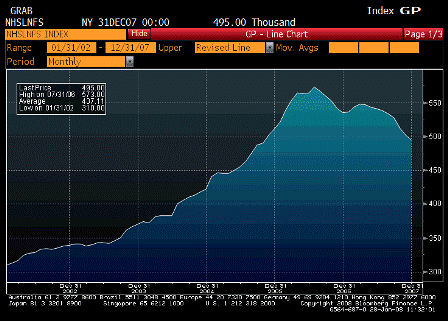
2008-01-28 # Homes for Sale

# Homes for Sale

Survey n/a
Actual 495
Prior 502
Revised n/a

Home sales data continues to show weakness in the housing sector, which is now a much smaller percentage of GDP than it was a year ago.

I haven’t dug into the numbers to see is weather or other year end issues were a factor.

The December drop was a smaller percentage drop than November.

The lower average price is not quality adjusted.

Interesting that total homes for sale continues to drop, meaning actual inventories are being worked off. I have also seen regional anecdotal evidence of inventories of new homes being relatively tight.

This is consistent with housing starts being down by about 80,000 per month from previous levels and affordability is increasing.


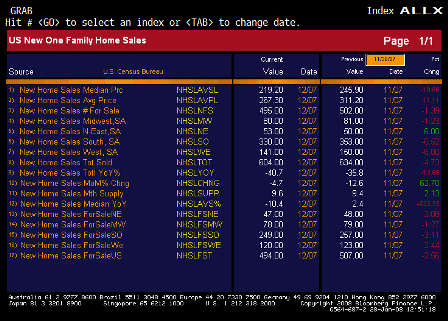
2008-01-28 New Home Sales TABLE

Looks like homes for sale fell in every region.


♥
2008-01-24 US Economic Releases

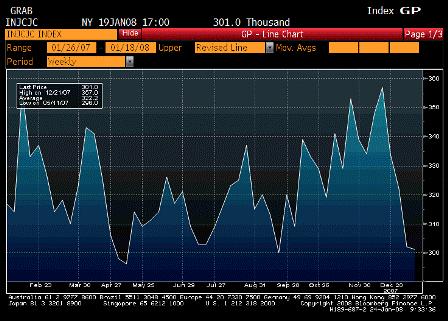
2008-01-24 Initial Jobless Claims

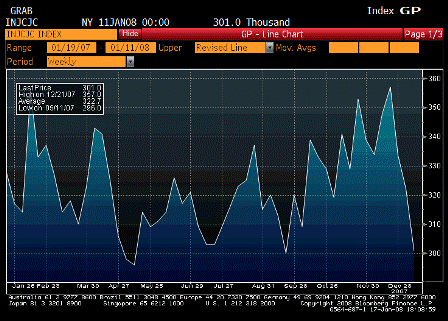
Initial Jobless Claims (Jan 19)

Survey 320K
Actual 301K
Prior 301K
Revised 302K

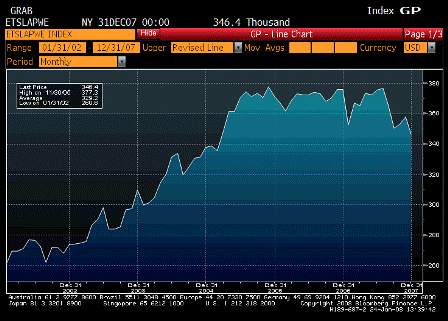
Back to the lows.

This means Q4 GDP probably won’t be all that weak.

Full employment recessions are extremely rare.

Exporters must have maintained and/or increased output as well, which will show up in the Dec trade numbers not out until Feb, so watch for upward revisions from next week’s initial GDP report.

And look for exports to continue strong as markets adjust to CB’s no longer accumulating $US financial assets at the same pace.


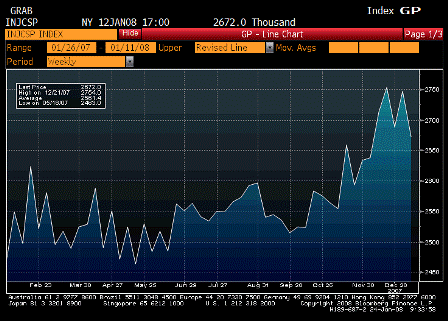
2008-01-24 Continuing Claims

Continuing Claims (Jan 12)

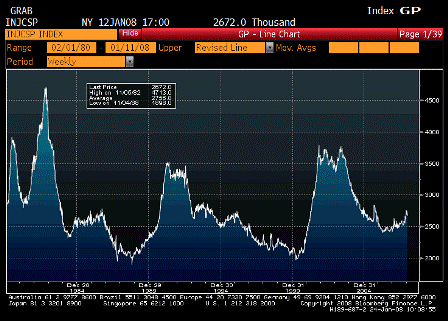
2008-01-24 Continuing Claims since 1980

Continuing Claims since 1980

Survey 2720K
Actual 2672K
Prior 2715K
Revised 2747K

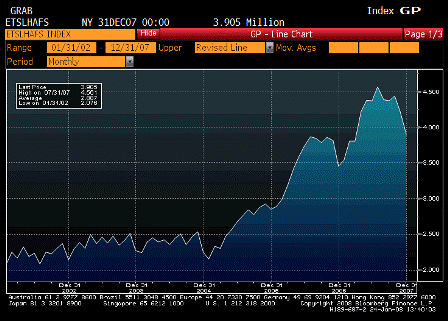
Also moving lower from a small blip up.

It’s all looking more and more like the great repricing of risk and the rearranging of financial assets hasn’t spilled over into the real economy. Yet.

And it also looks like the Fed may have done the ’emergency cut’ in response to Soc Gen evening up positions.

So the score is 175 bp in cuts into a growing economy and a triple negative supply shock that’s so far generated 4%+ year over year inflation and core numbers rising as well.

And demand for Saudi output is up to 9 million bpd, so their position as swing producer and price setter remains secure.

Not to mention the fiscal package that Bernanke has blessed – gives Congress and the President the green light to pump things up for the election.

And don’t forget Federal spending seems to have been moved forward from 2006 to 2007.

Economy should be at full boil by Q2, as we recover from the full employment recession…

And don’t worry about housing anymore. It’s all backwards looking and is a small enough % of GDP to not be a material negative to growth.

But if/when it turns, and I think that is already happening (but we need to wait until after the winter months to get some reliable data) it all starts to overheat again.


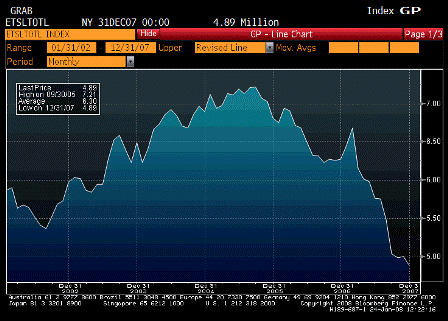
2008-01-24 Existing Home Sales

Existing Home Sales (Dec)

Survey 4.95M
Actual 4.89M
Prior 5.00M
Revised n/a

2008-01-24 Existing Home Sales MoM

Existing Home Sales MoM (Dec)

Survey -1.0%
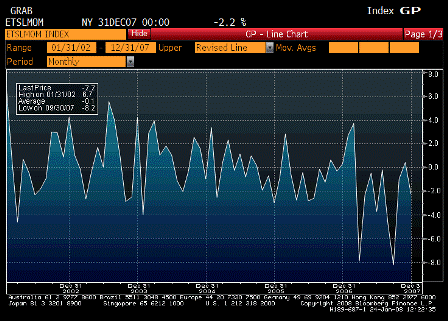
Actual -2.2%
Prior 0.4%
Revised n/a

Both muddling through the winter months.


2008-01-24 Home Sales Average Price

Home Sales Average Price

2008-01-24 Existing Homes Inventory

Existing Homes Inventory

Inventories did drop some, and prices down only modestly year over year.


♥

2008-01-23 US Daily Releases

2008-01-23 MBA Purchase Index SA

MBA Purchase Index SA (Jan 18)

Survey n/a
Actual 439.90
Prior 461.20
Revised n/a

No recession here.

Mtg apps seem to be continuing on the upward trend that started several months ago.


2008-01-23 MBA Refinancing Index SA

MBA Refinancing Index SA (Jan 18)

Survey n/a
Actual 4178.20
Prior 3575.5
Revised n/a

And the refi machine is going full bore as well.

It was feared credit worthy borrowers would not have access to credit to refi from higher rate mtgs.


♥

2008-01-22 US Economic Releases

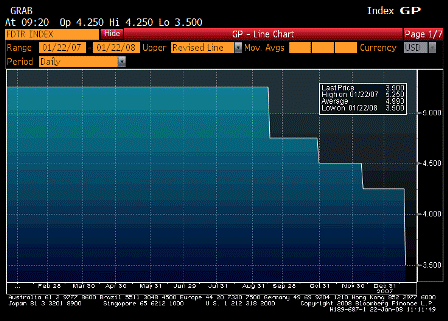
2008-01-22 FOMC Inter-meeting Rate Cut

FOMC Inter-meeting Rate Cut (Jan 22)

Survey n/a
Actual 3.50%
Prior 4.25%
Revised n/a

The cut was fully priced in for next week, with a lesser probability for doing it today.

The Fed is worried about ‘financial conditions’ and hopes to prevent them from spilling over into the real economy by doing, what the mainstream would call, ‘stepping on the inflation pedal.’


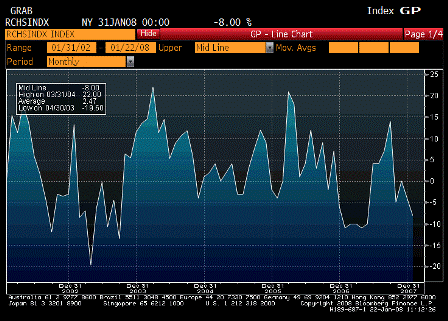
2008-01-22 Richmond Fed Manufact. Index

Richmond Fed Manufacturing Index (Jan)

Survey -5
Actual -8
Prior -4
Revised n/a

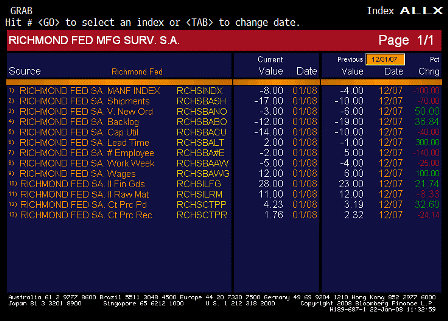
2008-01-22 Richmond Fed Manufact. Index TABLE

Richmond Fed Manufacturing Index TABLE

Down, but was lower last year about this time.

Also, the details of the table say more than the headline number. Shipments, cap utilization, and number of employees were the larger declines. Lead time, wages, and new orders and backlogs were up the highest percent. Prices remained moderately positive.


2008-01-22 ABC Consumer Confidence

ABC Consumer Confidence

Survey n/a
Actual -23
Prior -24
Revised n/a

Bumping along the bottom – still watching CNBC.


♥

2008-01-18 US Economic Releases

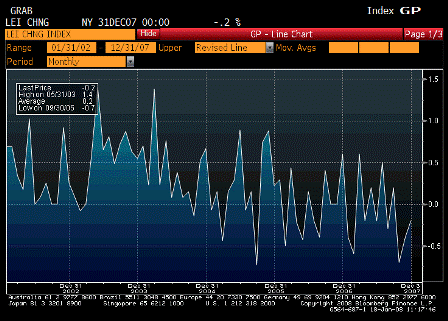
2008-01-18 Leading Indicators

Leading Indicators (Dec)

Survey -0.1%
Actual -0.2%
Prior -0.4%
Revised n/a

Down some, but not terrible.


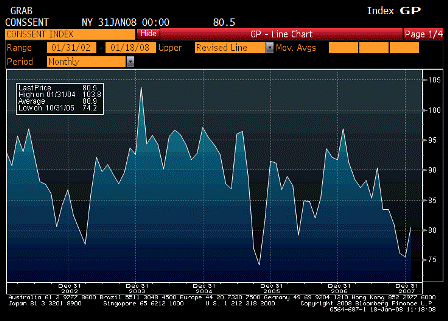
2008-01-18 U. of Michigan Confidence

U. of Michigan Confidence (Jan P)

Survey 74.5
Actual 80.5
Prior 75.5
Revised n/a

Up, but not great – not yet the stuff of recession.


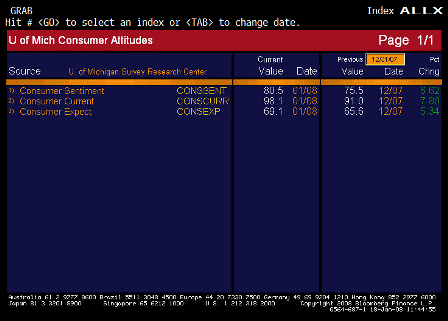
2008-01-18 U. of Michigan Confidence TABLE

U. of Michigan Confidence TABLE

Note how high the current levels are – no recession there.

It’s expectations that are weak – the CNBC effect.

And inflation expectations remain higher than the fed’s comfort level.


♥

2008-01-17 US Economic Releases

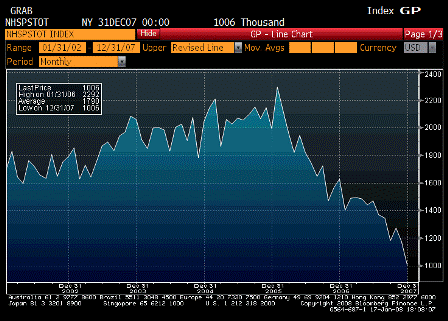
2008-01-17 Housing Starts

Housing Starts (Dec)

Survey 1145K
Actual 1006K
Prior 1187K
Revised 1173K

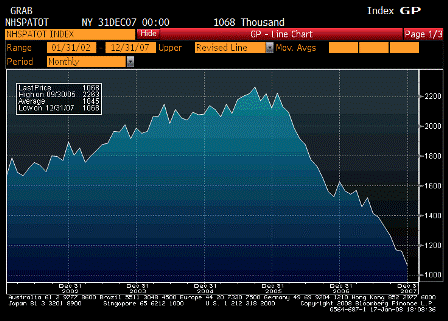
2008-01-17 Building Permits

Building Permits (Dec)

Survey 1135K
Actual 1068K
Prior 1152K
Revised 1162K

Both still in free fall – may be weather distorted some, but they don’t look good.


2008-01-17 Initial Jobless Claims

Initial Jobless Claims (Jan 12)

Survey 331K
Actual 301K
Prior 322K
Revised n/a

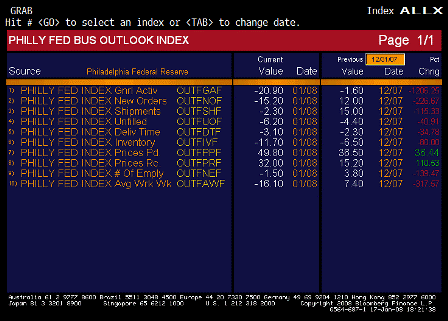
All the way back down. Seems out of line with housing and Philly Fed.

Could be the government spending kicking in that will subsequently support housing and other spending. (See previous posts on government spending.)

Spending resuming its growth after sagging for a couple of quarters as spending got moved forward.


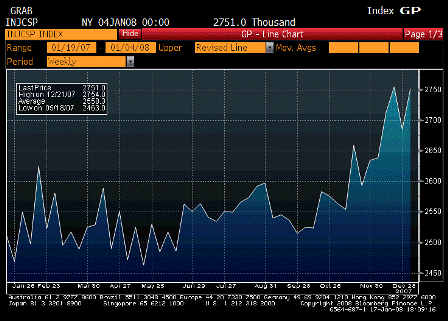
2008-01-17 Continuing Claims

Continuing Claims (Jan 5)

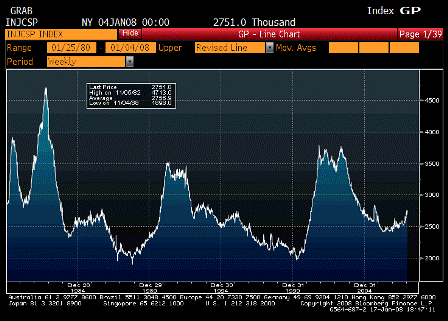
2008-01-17 Continuing Claims from 1980

Continuing Claims since 1980

Survey 2750K
Actual 2751K
Prior 2702K
Revised 2685K

Back up, but this is a tiny blip on the longer term chart.


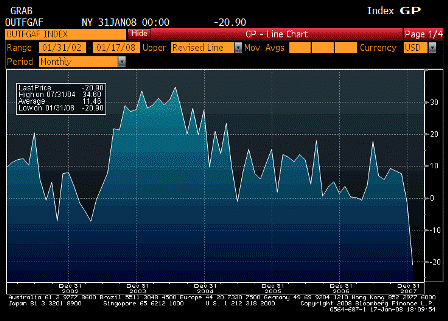
2008-01-17 Philadelphia Fed.

Philadelphia Fed. (Jan)

Survey -1.0
Actual -20.9
Prior -5.7
Revised n/a

Falling off a cliff.


2008-01-17 Philadelphia Fed. TABLE

Philadelphia Fed. TABLE

Weakness in every category – except prices paid and received, which skyrocketed.

Adds to the fed’s dilemma.


♥

2008-01-16 US Economic Releases

2008-01-16 Mortgage Applications

Average Mortgage Purchasing Index (Jan 11)

Survey n/a
Actual 461.20
Prior 414.00
Revised n/a

2008-01-16 Mortgage Applications

Mortgage Refi’s (Jan 11)

Survey n/a
Actual 3575.50
Prior 2494.20
Revised n/a

Purchase index back on uptrend, refi way up. Lower rates and return of market functioning coming together nicely.

Still looks like housing could have bottomed October/November, but jury is still out pending data and revisions.

JP Morgan mtg revenue spiked up as JPM gains market share in mtg markets.

Houses are cheaper, lenders aggressive with real buyers, and income has continued higher.

See Mortgage applications soar.


2008-01-16 Consumer Price Index MoM

Consumer Price Index MoM (Dec)

Survey 0.2%
Actual 0.3%
Prior 0.8%
Revised n/a

2008-01-16 CPI Ex Food & Energy MoM

CPI Ex Food & Energy MoM (Dec)

Survey 0.2%
Actual 0.2%
Prior 0.3%
Revised n/a

2008-01-16 Consumer Price Index YoY

Consumer Price Index YoY (Dec)

Survey 4.1%
Actual 4.1%
Prior 4.3%
Revised n/a

2008-01-16 CPI Ex Food & Energy YoY

CPI Ex Food & Energy YoY (Dec)

Survey 2.4%
Actual 2.4%
Prior 2.3%
Revised n/a

See Food/fuel/$ bakes in core.


2008-01-16 Industrial Production

Industrial Production (Dec)

Survey -0.2%
Actual 0.0%
Prior 0.3%
Revised n/a

Graph looks OK – holding its own!


2008-01-16 Capacity Utilization

Capacity Utilization (Dec)

Survey 81.2%
Actual 81.4%
Prior 81.5%
Revised 81.6%

Drifting off some, but still at a relatively high level.


2008-01-16 NAHB Housing Market Index

NAHB Housing Market Index (Jan)

Survey 19
Actual 19
Prior 19
Revised 18

Rounding bottom?


♥

2008-01-15 US Economic Releases

2008-01-15 Producer Price Index MoM

Producer Price Index MoM (Dec)

Survey 0.2%
Actual -0.1%
Prior 3.2%
Revised n/a

2008-01-15 PPI Ex Food & Energy MoM

PPI Ex Food & Energy MoM (Dec)

Survey 0.2%
Actual 0.2%
Prior 0.4%
Revised n/a

2008-01-15 Producer Price Index YoY

Producer Price Index YoY (Dec)

Survey 7.1%
Actual 6.3%
Prior 7.2%
Revised n/a

2008-01-15 PPI Ex Food & Energy YoY

PPI Ex Food & Energy YoY (Dec)

Survey 2.0%
Actual 2.0%
Prior 2.0%
Revised n/a

Inflation pressures remain alarming.

2007 highest inflation since the early 1980s, when inflation was on the way down.

Last hit this number on the way up was in the 1970s.


2008-01-15 Advance Retail Sales

Advance Retail Sales (Dec)

Survey 0.0%
Actual -0.4%
Prior 1.2%
Revised 1.0%

Previous month still very high, two month average looks OK.


2008-01-15 Retail Sales YoY % Change

Retail Sales YoY % Change

Year over year numbers still modestly moving back up.


2008-01-15 Retail Sales Less Autos

Retail Sales Less Autos (Dec)

Survey -0.1%
Actual -0.4%
Prior 1.8%
Revised 1.7%

Same as above.


2008-01-15 Empire Manufacturing

Empire Manufacturing (Jan)

Survey 10.0
Actual 9.0
Prior 10.3
Revised 9.8

2008-01-15 Empire Manufacturing TABLE

Empire Manufacturing TABLE

A close look at the table shows prices still very strong.


2008-01-15 Business Inventories

Business Inventories (Nov)

Survey 0.4%
Actual
Prior 0.1%
Revised

Chart looks OK – no excessive build.


Data not in, until 5PM EST..

ABC Consumer Confidence (Jan 13)

Survey -21
Actual
Prior -20
Revised

♥