- ICSC UBS Store Sales YoY (Released 7:45 EST)
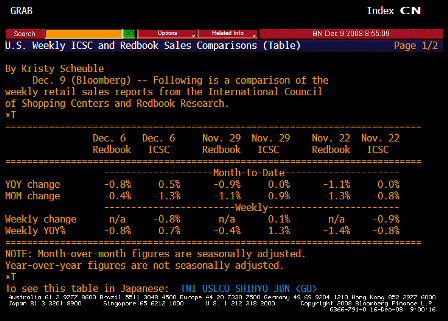
- ICSC UBS Store Sales WoW (Released 7:45 EST)
- Redbook Store Sales Weekly YoY (Released 8:55 EST)
- Redbook Store Sales MoM (Released 8:55 EST)
- ICSC UBS Redbook Comparison TABLE (Released 8:55 EST)
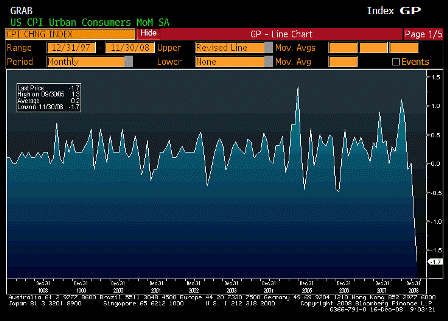
- Consumer Price Index MoM (Released 8:30 EST)
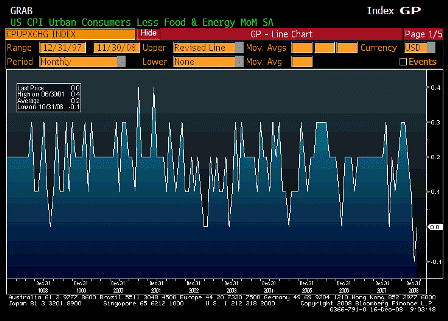
- CPI Ex Food and Energy MoM (Released 8:30 EST)
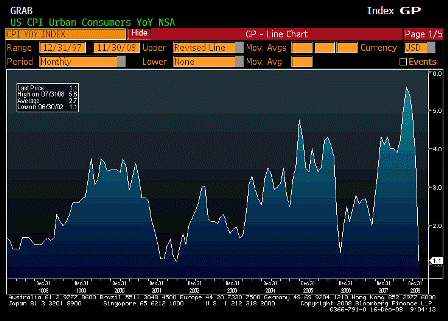
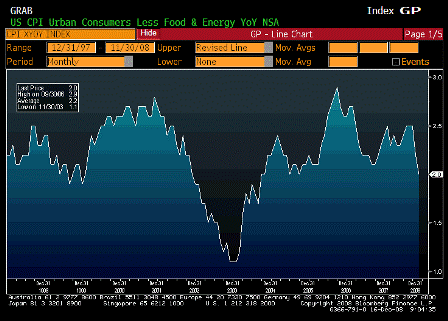
- Consumer Price Index YoY (Released 8:30 EST)
- CPI Ex Food and Energy YoY (Released 8:30 EST)
- CPI Core Index SA (Released 8:30 EST)
- Consumer Price Index NSA (Released 8:30 EST)
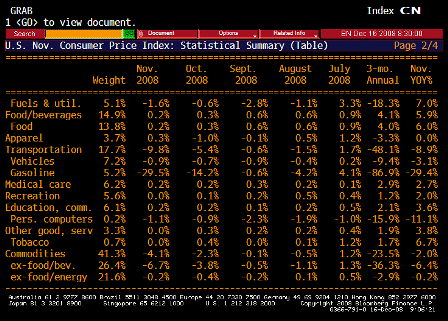
- Consumer Price Index TABLE 1 (Released 8:30 EST)
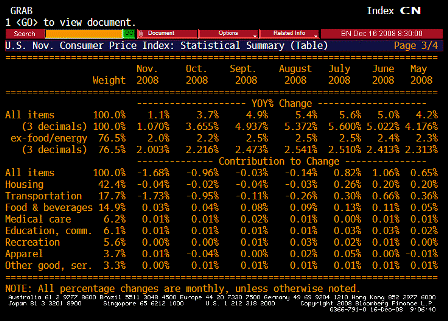
- Consumer Price Index TABLE 2 (Released 8:30 EST)
- Consumer Price Index TABLE 3 (Released 8:30 EST)
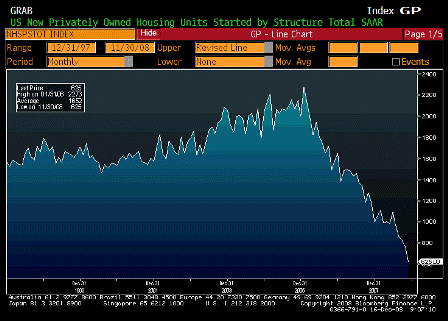
- Housing Starts (Released 8:30 EST)
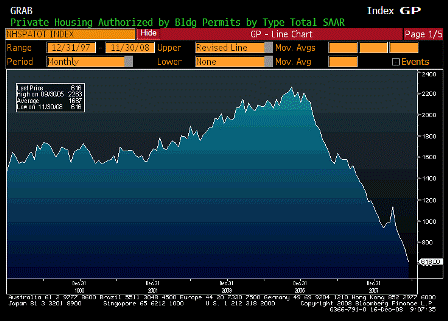
- Building Permits (Released 8:30 EST)
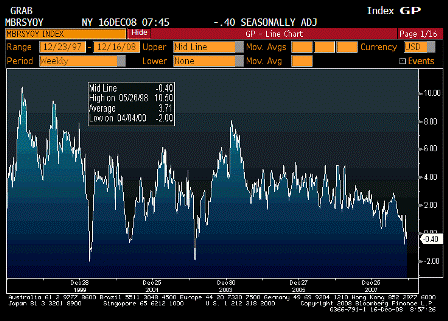
ICSC UBS Store Sales YoY (Dec 16)
| Survey | n/a |
| Actual | -0.40% |
| Prior | 0.40% |
| Revised | n/a |
Continues to move lower.
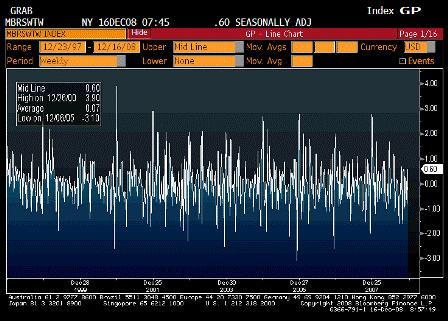
ICSC UBS Store Sales WoW (Dec 16)
| Survey | n/a |
| Actual | 0.60% |
| Prior | -0.80% |
| Revised | n/a |
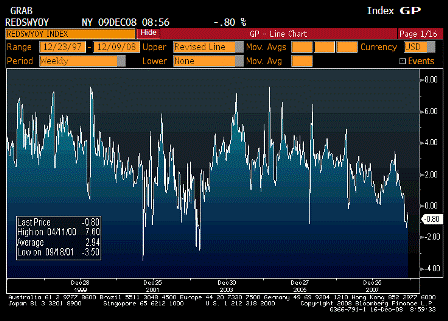
Redbook Store Sales Weekly YoY (Dec 9)
| Survey | n/a |
| Actual | -0.80% |
| Prior | -0.40% |
| Revised | n/a |
Continues to move lower.
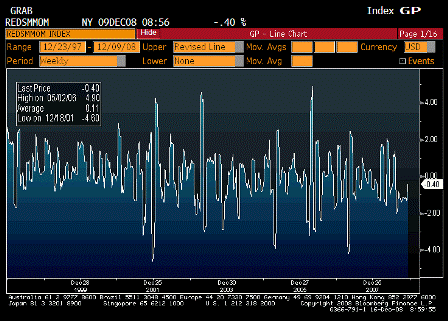
Redbook Store Sales MoM (Dec 9)
| Survey | n/a |
| Actual | -0.40% |
| Prior | -1.10% |
| Revised | n/a |
ICSC UBS Redbook Comparison TABLE (Dec 9)
Consumer Price Index MoM (Nov)
| Survey | -1.3% |
| Actual | -1.7% |
| Prior | -1.0% |
| Revised | n/a |
Karim writes:
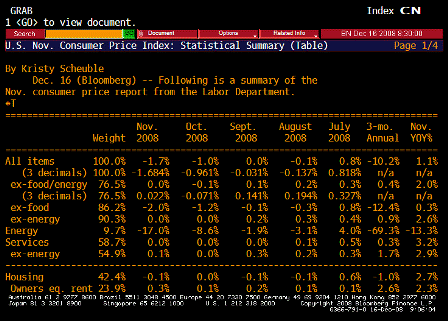
- Headline CPI dropped 1.7% M/M in November after 1.0% decline last month (Y/Y now at +1.1%)
- Core was flat in November after 0.1% decline (Y/Y at 2.0% and 3 month annualized at 0.4%… core is decelerating quickly and inflation certainly not a concern for Fed at this point)
- OER was up 0.3% M/M, but partly due to a decline in utility prices that increases economic rents
CPI Ex Food and Energy MoM (Nov)
| Survey | 0.1% |
| Actual | 0.0% |
| Prior | -0.1% |
| Revised | n/a |
Consumer Price Index YoY (Nov)
| Survey | 1.5% |
| Actual | 1.1% |
| Prior | 3.7% |
| Revised | n/a |
Way down, as crude oil and gasoline are lower than they were last year.
CPI Ex Food and Energy YoY (Nov)
| Survey | 2.1% |
| Actual | 2.0% |
| Prior | 2.2% |
| Revised | n/a |
Core drifting lower though owner equivalent rent went up .30% as utility costs fell and rents stayed about the same.
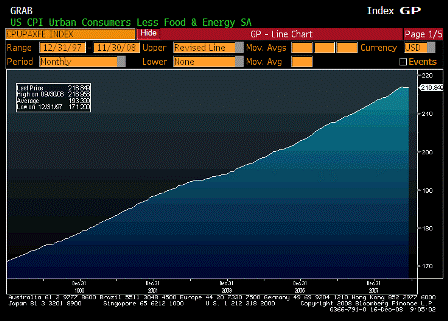
CPI Core Index SA (Nov)
| Survey | n/a |
| Actual | 216.849 |
| Prior | 216.801 |
| Revised | n/a |
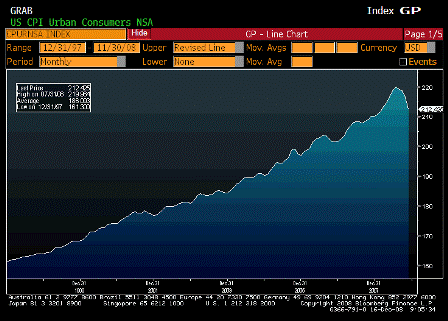
Consumer Price Index NSA (Nov)
| Survey | 212.699 |
| Actual | 212.425 |
| Prior | 216.573 |
| Revised | n/a |
Consumer Price Index TABLE 1 (Nov)
Consumer Price Index TABLE 2 (Nov)
Consumer Price Index TABLE 3 (Nov)
Housing Starts (Nov)
| Survey | 763K |
| Actual | 625K |
| Prior | 791K |
| Revised | 771K |
Keeps falling as the headlines have the public and financial institutions scared stiff.
Karim writes:
- Housing Starts dropped to 625k in November (record low with about 50 years of data!) from 771k last month and 1,179k last year (this should put more downward pressure on residential investment in GDP through early 2009)
- Permits dropped to 616k in November (record low with about 50 years of data!) from 730k last month and 1,111k last year
- Token “Sliver” lining- less pressure on inventories from new homes
Building Permits (Nov)
| Survey | 700K |
| Actual | 616K |
| Prior | 708K |
| Revised | 730K |
[top]


