2008-02-14 US Economic Releases

2008-02-14 Trade Balance

Trade Balance (Dec)

Survey -$61.5B
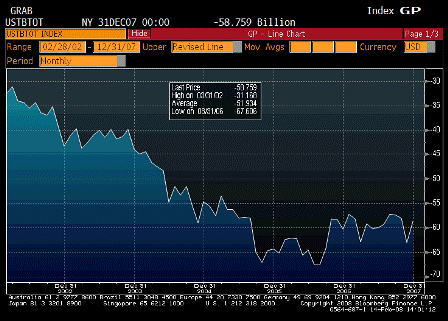
Actual -$58.8B
Prior -$63.1B
Revised n/a

Moving lower as it reflects the declining desire of non residents to accumulate $US financial assets. Three main drivers are Paulson calling CB’s who buy $ currency manipulators, the Fed pursuing what looks to the world an ‘inflate your way out of debt’ policy scaring foreigners out of holding $US financial assets, and Bush’s ideological stance discouraging many oil producers from accumulating $US financial assets. And the new fiscal package doesn’t help, either.

Strong exports continue to support GDP and pick up the slack due to weak housing.


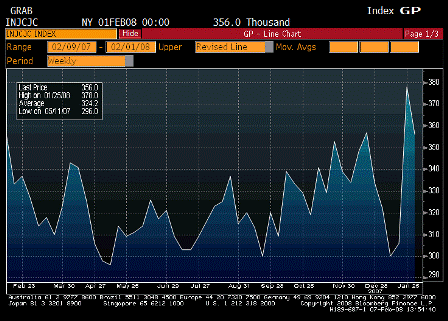
2008-02-14 Initial Jobless Claims

Initial Jobless Claims (Feb 9)

Survey 347K
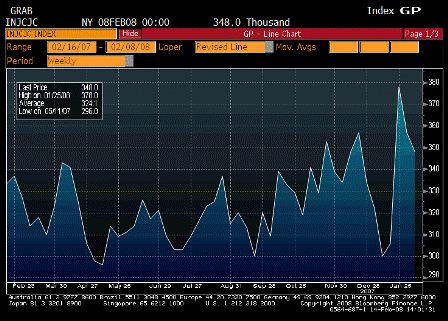
Actual 348K
Prior 356K
Revised 357K

Working their way back down – no recession here.


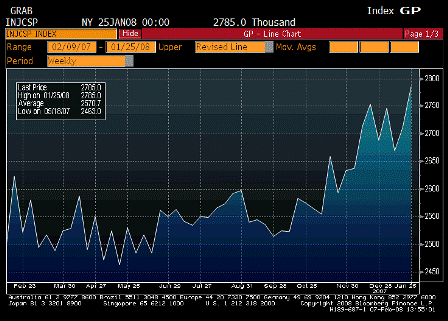
2008-02-14 Continuing Claims

Continuing Claims (Feb 2)

Survey 2759K
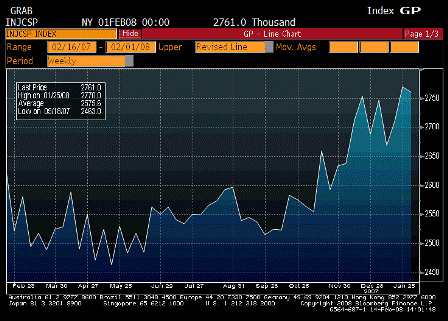
Actual 2761K
Prior 2785K
Revised 2770K

Still at modest levels, and only a very small blip on the long term chart.


♥

2008-02-13 US Economic Releases

2008-02-13 MBAVPRCH Index

MBAVPRCH Index

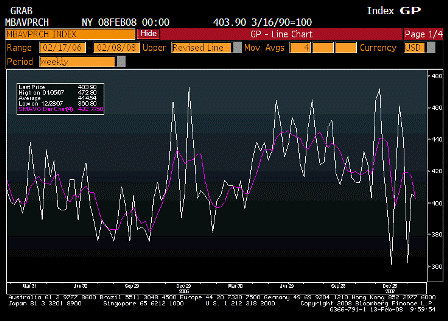
Doesn’t look too bad.

Mortgage bankers have reduced staff and are probably working overtime on refi’s which remain very high.


2008-02-13 Retail Sales

Retail Sales

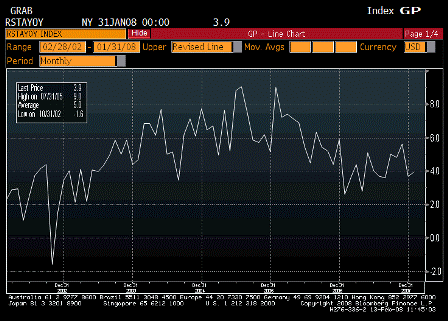
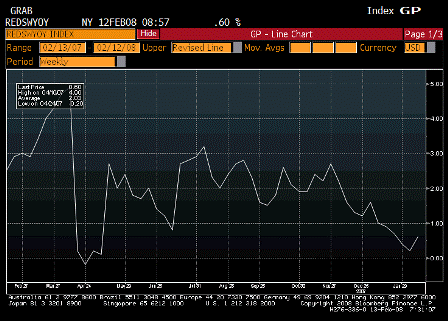
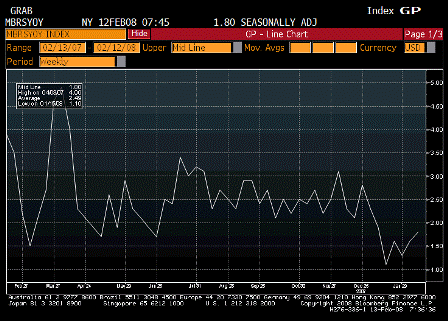
Details of today’s report aside, the year over year chart looks like retail sales have been working their way modestly higher during the last year.


♥

2008-02-07 US Economic Releases

2008-02-07 Initial Jobless Claims

Initial Jobless Claims (Feb 2)

Survey 342K
Actual 356K
Prior 375K
Revised 378K

Moving down, but will need to fall more next week to signal employment is doing reasonably well.


2008-02-07 Continuing Claims

Continuing Claims (Jan 26)

Survey 2715K
Actual 2785K
Prior 2716K
Revised -2710K

Back up a bit, but not through the highs, and reflects lasts weeks higher claims.


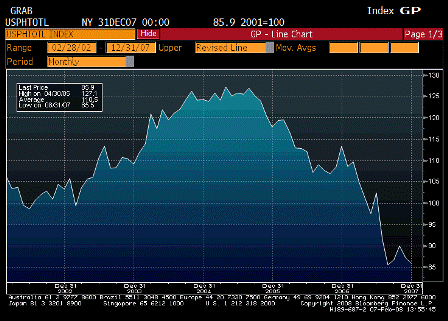
2008-02-07 Total Pending Home Sales SA

Total Pending Home Sales SA (Dec)

Survey -1.0%
Actual -1.5%
Prior -2.6%
Revised -3.0%

Down some, but not through the lows. October/November may still have been the bottom of housing.


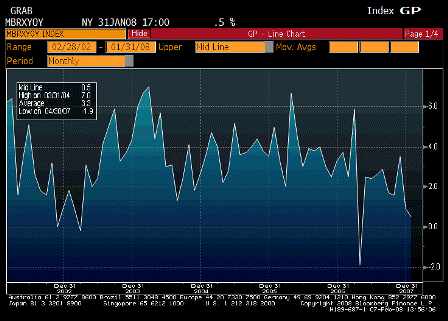
2008-02-07 ICSC Chain Store Sales YoY

ICSC Chain Store Sales YoY (Jan)

Survey 0.8%
Actual 0.5%
Prior 0.9%
Revised n/a

Been drifting lower for quite a while. Part of the expected softening of domestic demand since Q2 2006.


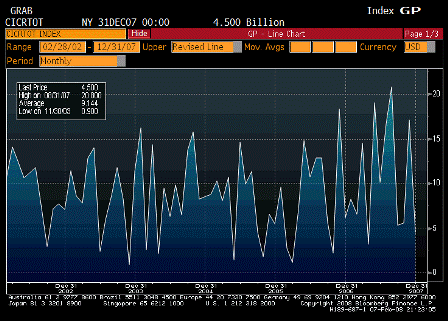
2008-02-07 Consumer Credit

Consumer Credit (Dec)

Survey $7.4B
Actual $4.5B
Prior $15.4B
Revised $17.1B

♥

2008-02-06 US Economic Releases

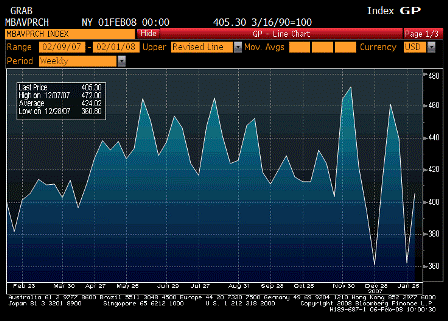
2008-02-06 MBAVPRCH Index SA

Mortgage Bankers Association Purchase Index SA (Feb 1)

Survey n/a
Actual 405.3
Prior 362.0
Revised n/a

Wild January, even considering all year ends are volatile for this series – now back over 400, roughly the 2006 average.

Will take a few more weeks to see where it’s been and where it may be going.

If it holds over 400 it’s one sign housing may not be getting any worse. A move back down to the 350 level signals another move down in housing.


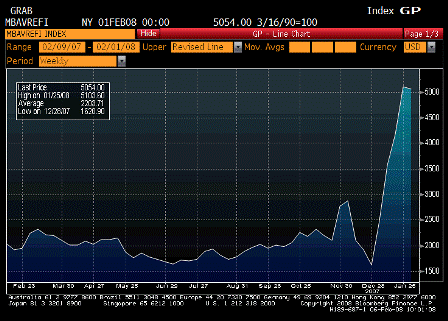
2008-02-06 MBAVREFI Index SA

MBA Refinancing Index SA (Feb 1)

Survey n/a
Actual 5054.0
Prior 5103.6
Revised n/a

Cranking them out as fast as the remaining mortgage banking staff can handle them.


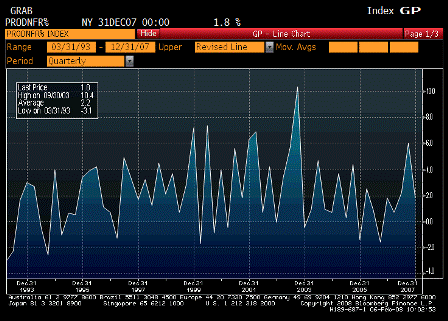
2008-02-06 Nonfarm Productivity

Nonfarm Productivity(4Q P)

Survey 0.5%
Actual 1.8%
Prior 6.3%
Revised 6.0%

This means more output than expected for the same workforce.


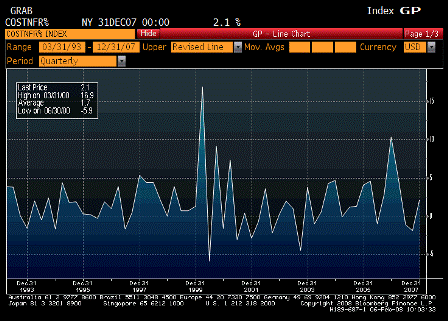
2008-02-06 Unit Labor Costs

Unit Labor Costs (4Q P)

Survey 3.5%
Actual 2.1%
Prior -2.0%
Revised -1.9%

Goes hand in hand with productivity- looks like business has this under control – supports good Q4 profitability.


♥

2008-02-05 US Economic Releases

2008-02-05 ISM Non-Manufacturing Composite

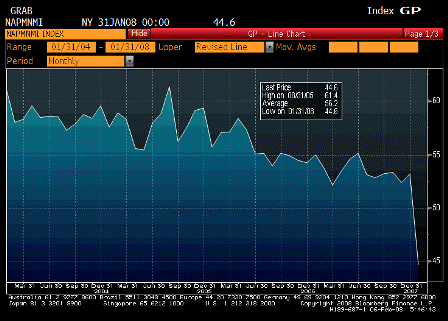
ISM Non-Manufacturing Composite (Jan)

Survey 52.5
Actual 44.6
Prior 53.2
Revised n/a

2008-02-05 ISM Non-Manufacturing Business

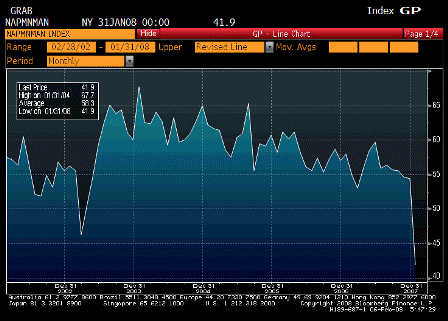
ISM Non-Manufacturing Business (Jan)

Survey 53.0
Actual 41.9
Prior 53.9
Revised 54.4

These are the types of numbers you get after something like Katrina or 911. Either the economy hit the wall suddenly in January or there is some kind of statistical adjustment that took place.

Note that ISM was revised even higher for December, then collapsed in January. Other statistics that fell apart in January include payrolls, vehicle sales, and mortgage applications, which come out in a few hours, and initial claims, due out tomorrow.


2008-02-05 ABC Consumer Confidence

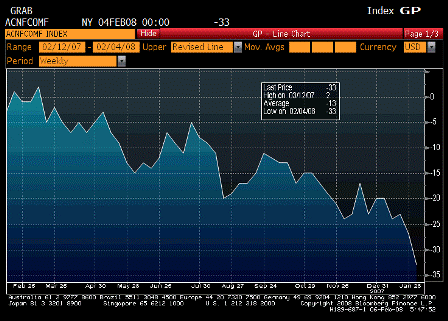
ABC Consumer Confidence (Feb 3)

Survey n/a
Actual -33
Prior -27
Revised n/a

This has been falling for a while and is no surprise given the headline recession proclamations.


♥

2008-02-04 US Economic Releases

small-2008-02-04-challenger-job-cuts-total.gif

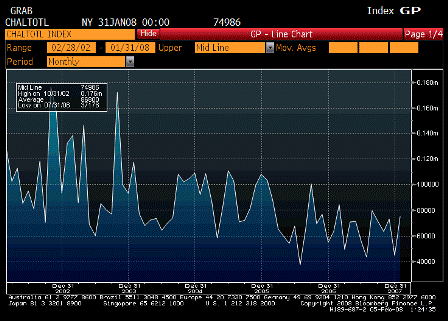
Challenger Job Cuts Total (Jan)

Survey n/a
Actual 74,986
Prior 44,416
Revised n/a

A volatile number that has been showing low levels of layoffs and not given much weight either way.


2008-02-04 Factory Orders Total

Factory Orders (Dec)

Survey n/a
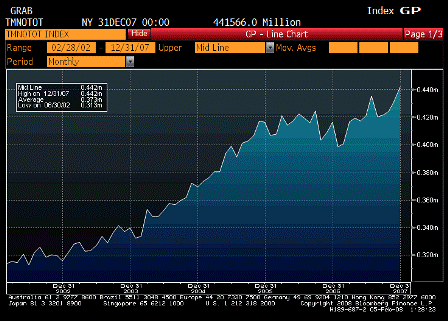
Actual 441,566
Prior 431,489
Revised n/a

Another strong number – no sign of recession here.


♥

2008-02-01 US Economic Releases

2007-02-01 Change in Nonfarm Payrolls

Change in Nonfarm Payrolls (Jan)

Survey 70K
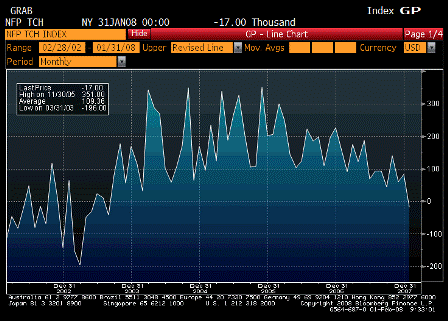
Actual -17K
Prior 18K
Revised 82K

Last negative number was August – got revised up.

Apart from the unrevised January number, the revised previous numbers don’t look too bad.

(See following report.)


2008-02-01 Unemployment Rate

Unemployment Rate

Survey 5.0%
Actual 4.9%
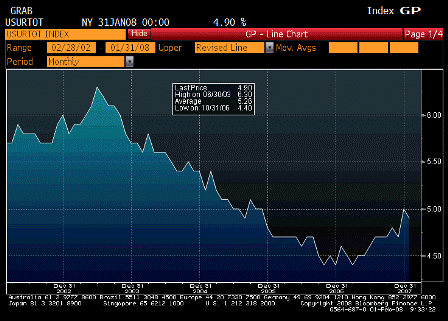
Prior 5.0%
Revised n/a

Slight downtic.

The Fed calls 4.75% full employment.

So, this is close enough.


2008-02-01 Change in Manufacturing Payrolls

Change in Manufacturing Payrolls (Jan)

Survey -20K
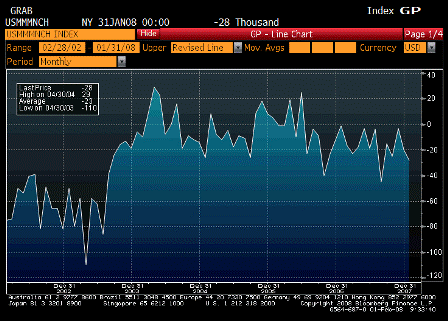
Actual -28K
Prior -31K
Revised -20K

Suspiciously low as a per December durable goods and export numbers.


2008-02-01 Average Hourly Earnings MoM

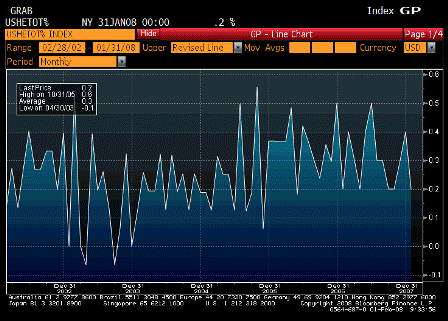
Average Hourly Earnings MoM (Jan)

Survey 0.3%
Actual 0.2%
Prior 0.4%
Revised n/a

2008-02-01 Average Hourly Earnings YoY

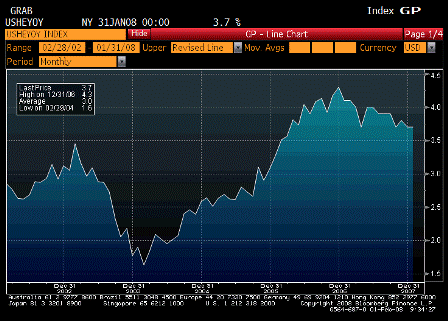
Average Hourly Earnings YoY (Jan)

Survey 3.9%
Actual 3.7%
Prior 3.7%
Revised n/a

Seems to be under control though a weak productivity number could raise unit labor costs.


2008-02-01 Average Weekly Hours

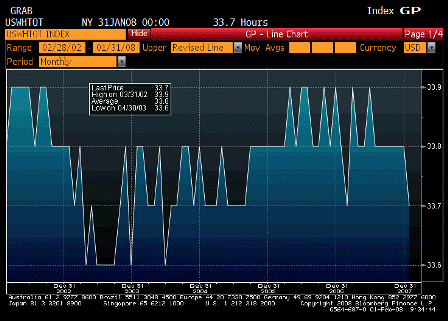
Average Weekly Hours

Survey 33.8
Actual 33.7
Prior 33.8
Revised n/a

Down a bit. Fairly steady.


2008-02-01 RPX Composite 28dy YoY

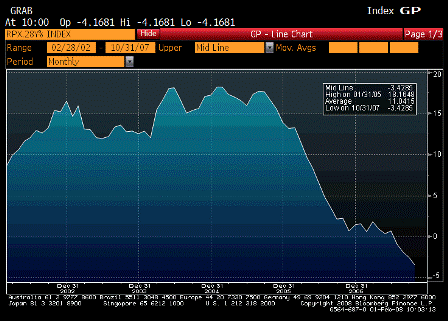
RPX Composite 28dy YoY (Nov)

Survey n/a
Actual -4.1681
Prior -3.4285
Revised n/a

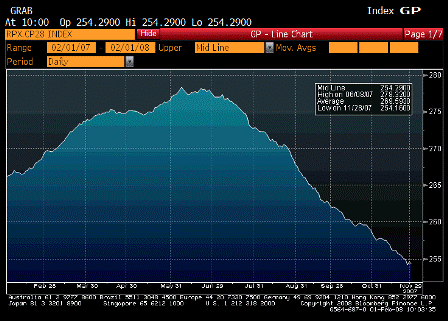
small-2008-02-01-rpx-composite-28dy-index.gif

RPX Composite 28dy Index (Nov)

Survey n/a
Actual 254.3
Prior 255.5
Revised 258.9

November housing was weak.


2008-02-01 U. of Michigan Confidence

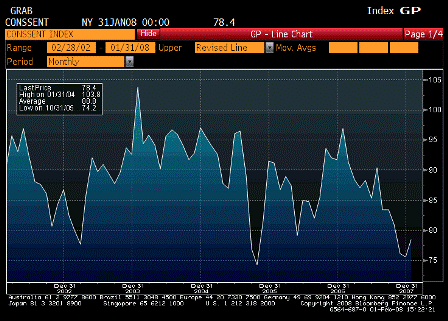
U. of Michigan Confidence (Jan F)

Survey 79.0
Actual 78.4
Prior 80.5
Revised n/a

Not bad.

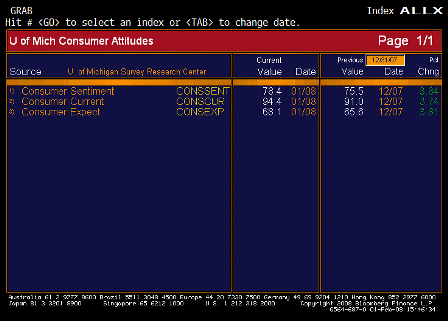
2008-02-01 U. of Michigan TABLE

Both current and expected improved.

U. of Michigan TABLE


2008-02-01 ISM Manufacturing

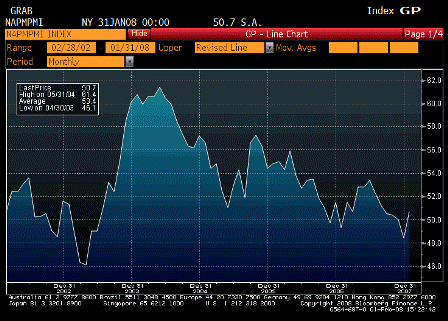
ISM Manufacturing (Jan)

Survey 47.3
Actual 50.7
Prior 47.7
Revised 48.4

Back to growth mode.


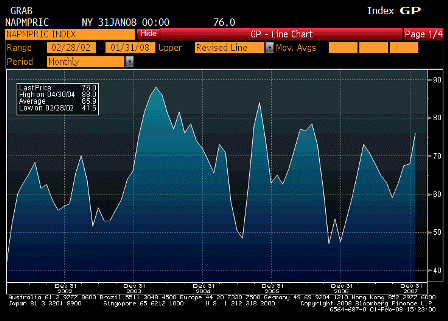
2008-02-01 ISM Prices Paid

ISM Prices Paid (Jan)

Survey 68.0
Actual 76.0
Prior 68.0
Revised n/a

Inflation ripping here.


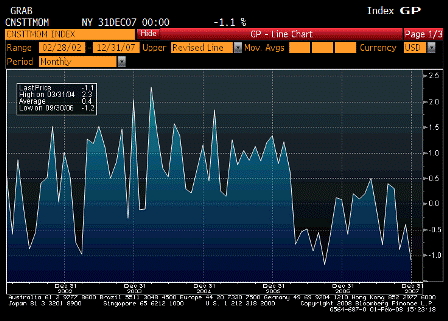
2008-02-01 Construction Spending

Construction Spending MoM (Dec)

Survey -0.5%
Actual -1.1%
Prior 0.1%
Revised -0.4%

Still bumping along the bottom.

2008-01-31 US Economic Releases

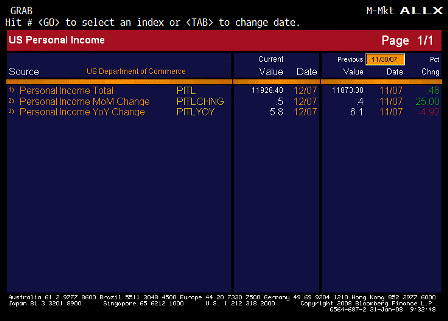
2008-01-31 Personal Income

Personal Income (Dec)

Survey 0.4%
Actual 0.5%
Prior 0.4%
Revised n/a

2008-01-31 Personal Income TABLE

Personal Income TABLE

A bit better than expected, holding up reasonably well, as declining interest rates reduce interest income component.

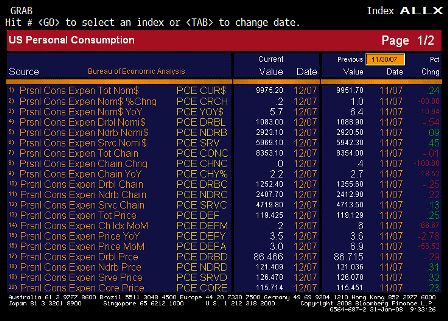
2008-01-31 Personal Spending

Personal Spending (Dec)

Survey 0.1%
Actual 0.2%
Prior 1.1%
Revised 1.0%

2008-01-31 Personal Spending TABLE(1)

2008-01-31 Personal Spending TABLE(2)

Personal Spending TABLE

OK number after last month’s large increase.

Also holding up reasonably well, but trending modestly downward.
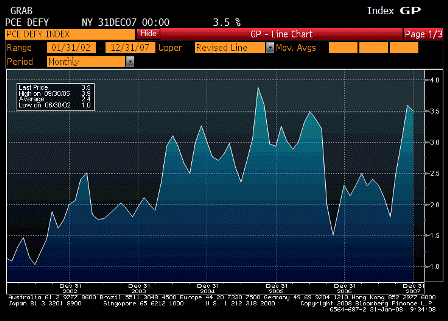

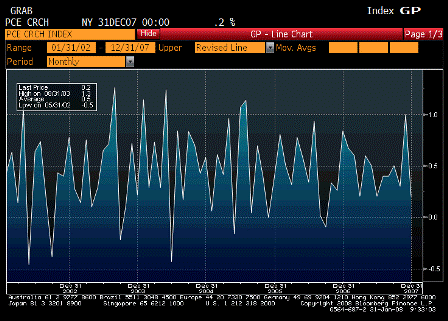
2008-01-31 PCE Deflator YoY

PCE Deflator YoY (Dec)

Survey 3.5%
Actual 3.5%
Prior 3.6%
Revised n/a

Too high for the Fed, but hopefully it will come down to core.
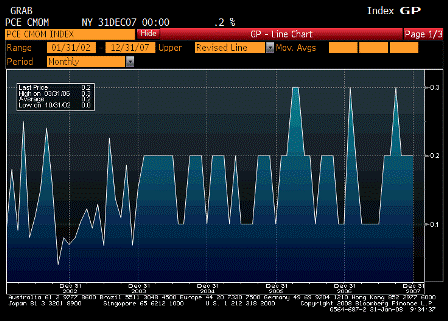

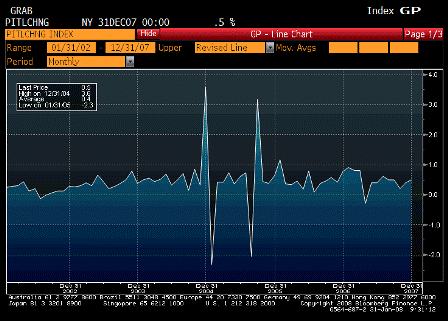
small-2008-01-31-pce-core-mom.gif

PCE Core MoM (Dec)

Survey 0.2%
Actual 0.2%
Prior 0.2%
Revised n/a

Actual was 0.23%


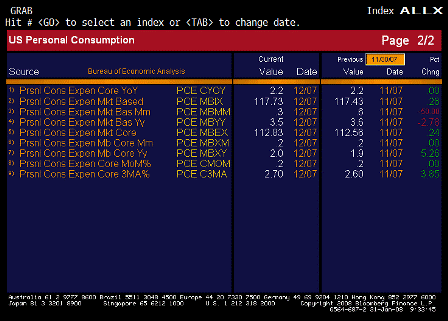
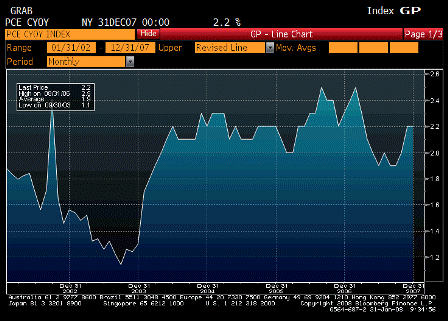
2008-01-31 PCE Core YoY

PCE Core YoY (Dec)

Survey 2.2%
Actual 2.2%
Prior 2.2%
Revised n/a

Fed OK with this number and should be OK next month as January 2007 was up 0.2%. After that, the 2007 numbers are 0.1%’s for a while; so, there’s a better chance of YoY increases after that.
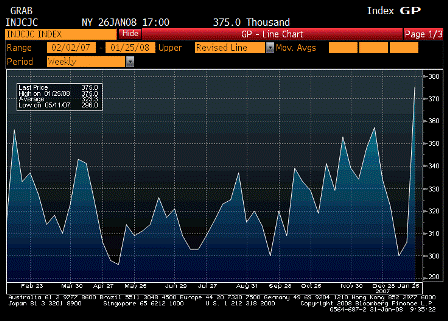

2008-01-31 Initial Jobless Claims

Initial Jobless Claims (Jan 26)

Survey 319K
Actual 375K
Prior 301K
Revised 306K

Big jump up as expected by Karim.

4 week average about 325,000 likely return to pre-January trend of about 350,000 (See Karim’s report).

Not yet the stuff of recession.
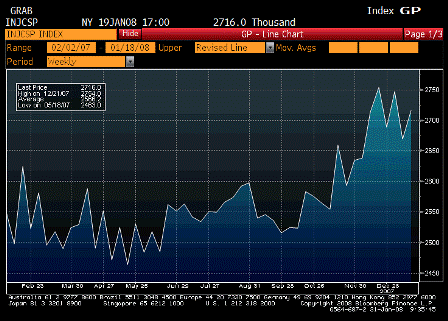

2008-01-31 Continuing Claims

Continuing Claims (Jan 19)

Survey 2685K
Actual 2716K
Prior 2672K
Revised 2669K

Moved back up some.

Also not yet the stuff of recession.
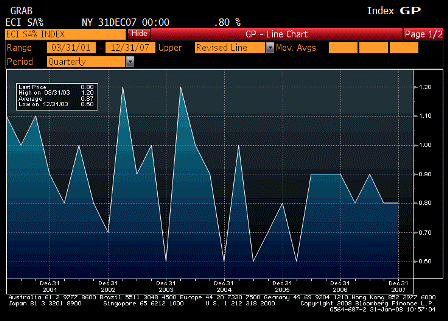

2008-01-31 Employment Cost Index

Employment Cost Index (4Q)

Survey 0.8%
Actual 0.8%
Prior 0.8%
Revised n/a

2008-01-31 Employment Cost Index YoY

Employment Cost Index YoY

Survey n/a
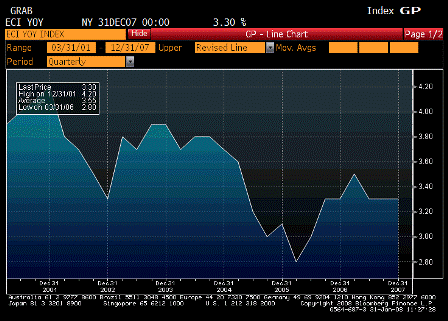
Actual 3.3%
Prior 3.3%
Revised n/a

As expected, Fed is OK with this, but may be giving it too much weight, as it may be the last inflation indicator to move in this cycle.
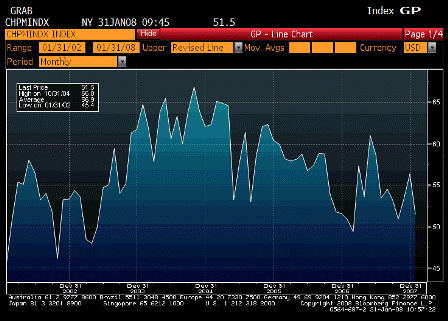

2008-01-31 Chicago Purchasing Manager

Chicago Purchasing Manager (Jan)

Survey 52.0
Actual 51.5
Prior 56.6
Revised 56.4

Still above 50, not the stuff of recession yet.
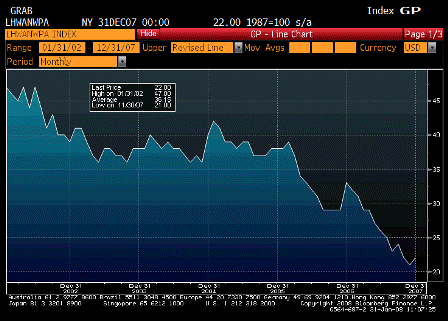

2008-01-31 Help Wanted Index

Help Wanted Index (Dec)

Survey 20
Actual 22
Prior 21
Revised n/a

Very small uptick from a very low level.
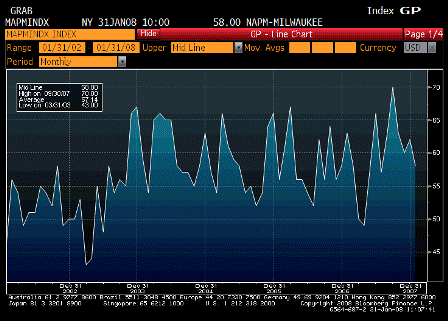

2008-01-31 NAPM-Milwaukee

NAPM-Milwaukee (Jan)

Survey n/a
Actual 58.0
Prior 62.0
Revised n/a

No recession here, yet.


♥
Claims, ECI

From Karim:

  • True to the past 5yrs pattern, claims seem to be reverting to trend after the first few weeks of January.

Right, good call!

  • IJC climbed from 306k to 375k; the trend before the January drop was around 340-350k; this number was for MLK holiday week, so an adjustment issue here as well; bottom line is I think trend is still around 350k.
  • Continuing claims rose from 2685k to 2716k.
  • ECI (both headline and wage component) up 0.8% q/q

Data below is for Dec, so was largely known in yday’s GDP number.

  • Personal income up 0.5%, with wage and salary component up 0.4%
  • Core PCE up 0.2% m/m (2.2% y/y)

Most meaningful data here was continuing claims (little to no hiring taking place) and ECI (wage gwth still tame).

And Fed still looking at this as an indication of ‘inflation expectations’.


♥