2008-04-16 US Economic Releases

  • MBA Mortgage Applications
  • Bloomberg Global Confidence
  • Consumer Price Index
  • Housing Starts
  • Building Permits
  • Industrial Production
  • Capacity Utilization

2008-04-16 MBAVPRCH Index

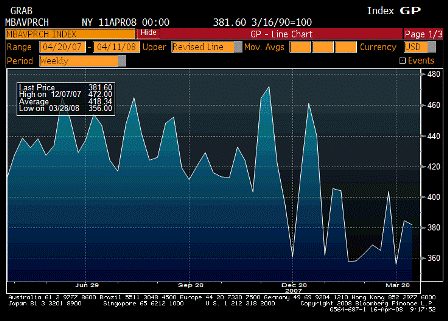
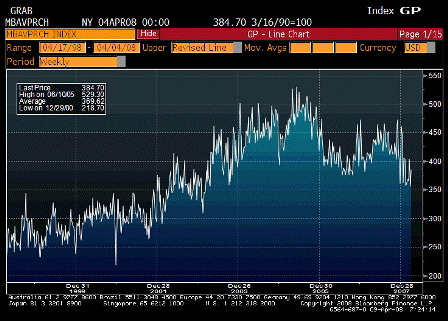
MBAVPRCH Index (Apr 11)

Survey n/a
Actual 381.6
Prior 384.7
Revised n/a

Holding in its new, lower range.


2008-04-16 MBAVREFI Index

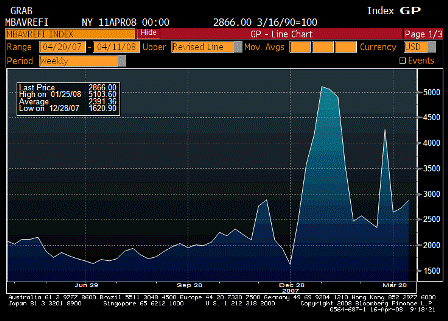
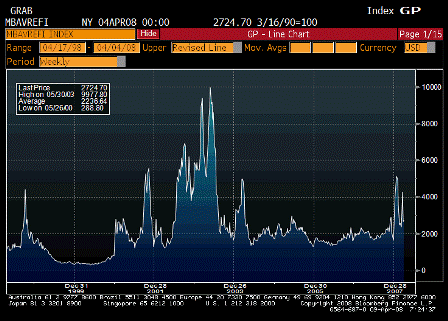
MBAVREFI Index (Apr 11)

Survey n/a
Actual 2866.0
Prior 2724.7
Revised n/a

Doing ok in this prime time for resets, which are peaking and then falling off.


2008-04-16 Bloomberg Global Confidence

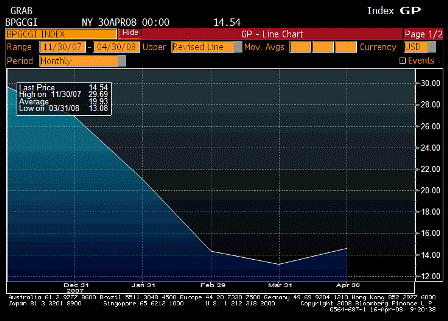
Bloomberg Global Confidence (Apr)

Survey n/a
Actual 14.54
Prior 13.08
Revised n/a

Still down, but signs of a bottom.


In my humble opinion, inflation is ripping, and the Fed’s in a very bad place. April’s food and energy price hikes, along with hosts of others, and the weaker USD all are pointing to an upward surge for prices on a forward looking basis.The Fed’s forecasting models should be showing higher inflation as well.And futures markets continue to be an unreliable forecasting tool for the Fed.

2008-04-16 Consumer Price Index MoM

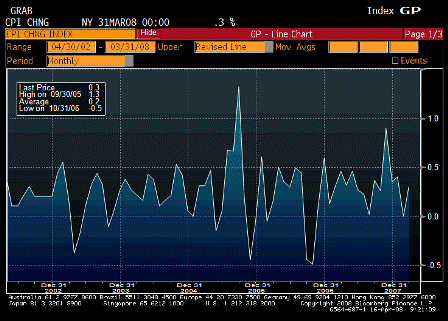
Consumer Price Index MoM (Mar)

Survey 0.3%
Actual 0.3%
Prior 0.0%
Revised n/a

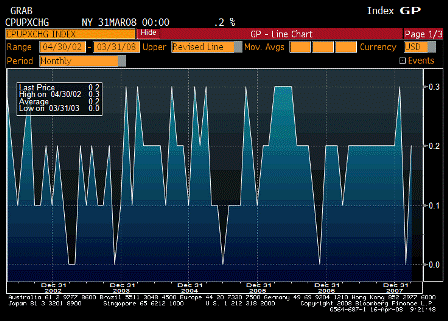
2008-04-16 CPI Ex Food & Energy MoM

CPI Ex Food & Energy MoM (Mar)

Survey 0.2%
Actual 0.2%
Prior 0.0%
Revised n/a

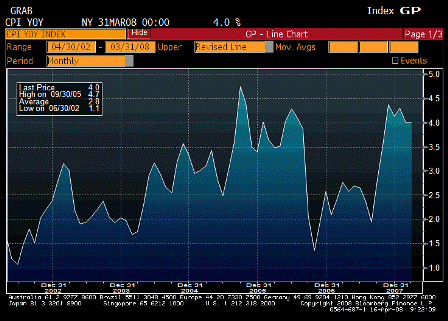
2008-04-16 Consumer Price Index YoY

Consumer Price Index YoY (Mar)

Survey 4.0%
Actual 4.0%
Prior 4.0%
Revised n/a

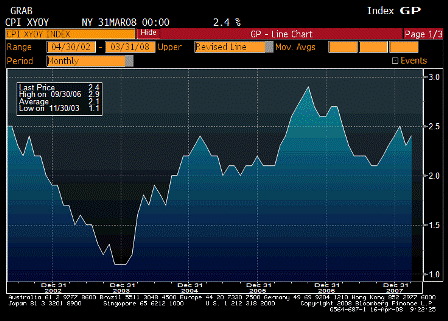
2008-04-16 CPI Ex Food & Energy YoY

CPI Ex Food & Energy YoY (Mar)

Survey 2.4%
Actual 2.4%
Prior 2.3%
Revised n/a

From Karim:

Headline/Core divergence->limited passthrough

  • Headline 0.343% and stays at 4% y/y

  • Core rises 0.152% (after 0.04% last month), showing limited pass-through from headline and even more limited pass-through from wholesale level (PPI from yday).

  • Core rises from 2.3% to 2.4%, equates to about 1.9-2.0% on core PCE basis due to measurement differences

  • Food up 0.2% and gas up 1.3%

  • OER up 0.2%, apparel down 1.3%, vehicles down 0.1%

  • Lodging away from home down 0.6% and medical up only 0.1%, a bit below trend

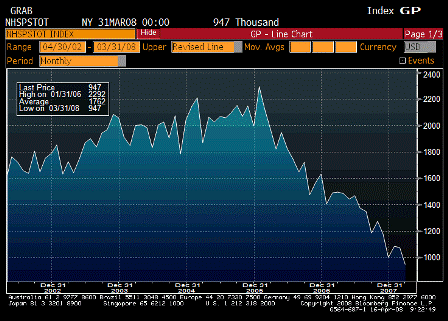
Housing starts not looking good. The glimmer of hope is that prior months have been revised up for the last two reports, so there’s a chance this number could be revised substantially as well.

2008-04-16 Housing Starts

Housing Starts (Mar)

Survey 1010K
Actual 947K
Prior 1065K
Revised 1075K

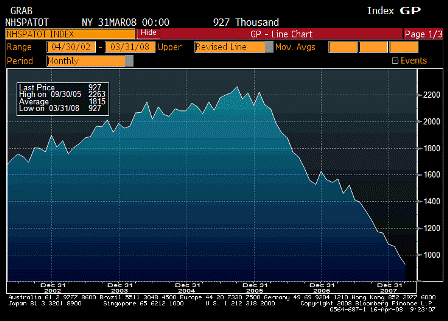
2008-04-16 Building Permits

Building Permits (Mar)

Survey 970K
Actual 927K
Prior 978K
Revised 984K

From Karim:

Housing data shows drag continuing with at least the same intensity

  • Starts down 11.9%, boding poorly for current GDP

  • Permits down 5.8%, boding poorly for future GDP

  • Best news is not adding to inventories

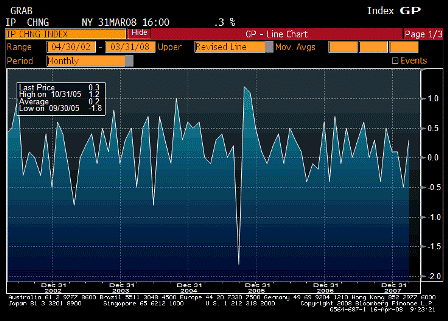
2008-04-16 Industrial Production

Industrial Production (Mar)

Survey -0.1%
Actual 0.3%
Prior -0.5%
Revised -0.7%

May be due to exports, which are keeping GDP and employment muddling through


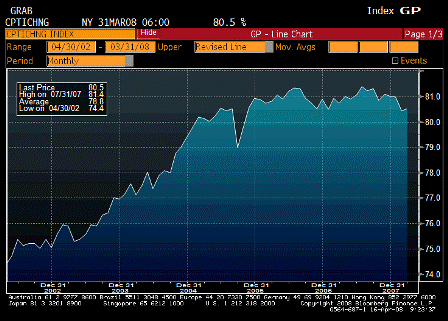
2008-04-16 Capacity Utilization

Capacity Utilization (Mar)

Survey 80.3%
Actual 80.5%
Prior 80.9%
Revised 80.3%

Staying too high for the typical recession.

2008-04-15 US Economic Releases

  • Producer Price Index
  • Empire Manufacturing
  • NAHB Housing Market Index
  • ABC Consumer Confidence

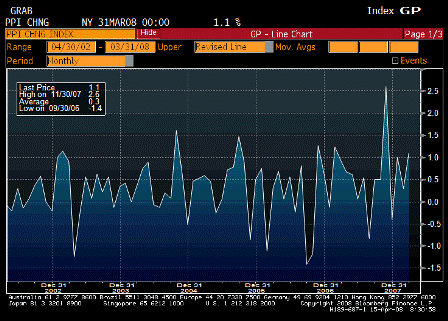
2008-04-15 Producer Price Index MoM

Producer Price Index MoM (Mar)

Survey 0.6%
Actual 1.1%
Prior 0.3%
Revised n/a

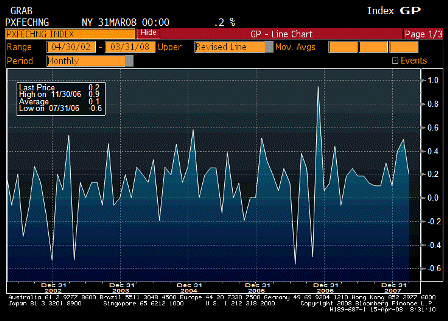
2008-04-15 PPI Ex Food & Energy MoM

PPI Ex Food & Energy MoM (Mar)

Survey 0.2%
Actual 0.2%
Prior 0.5%
Revised n/a

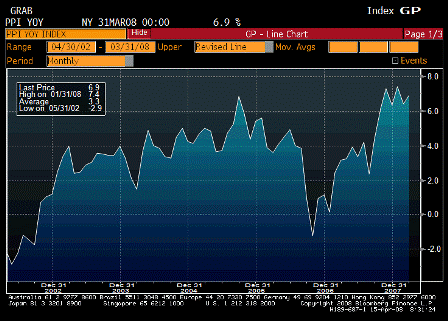
2008-04-15 Producer Price Index YoY

Producer Price Index YoY (Mar)

Survey 6.2%
Actual 6.9%
Prior 6.4%
Revised n/a

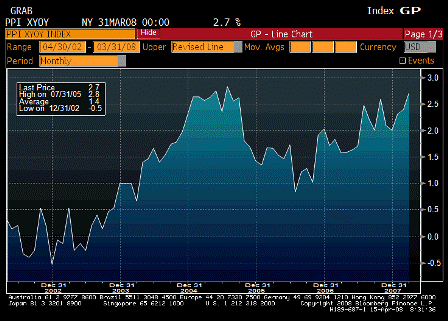
2008-04-15 PPI Ex Food & Energy YoY

PPI Ex Food & Energy YoY (Mar)

Survey 2.8%
Actual 2.7%
Prior 2.4%
Revised n/a

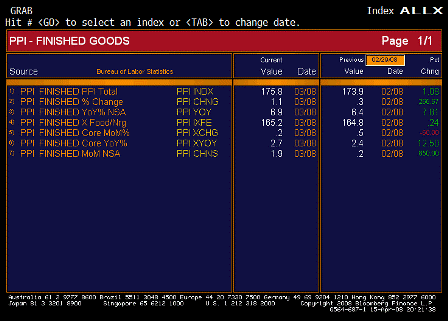
2008-04-15 Producer Price Index TABLE

Producer Price Index TABLE

Inflation ripping.

From Karim:

Headline/Core divergence continues

  • Headline up 1.1% m/m and 6.9% y/y

  • Core up 0.2% m/m and 2.7% y/y

  • Food (+1.2%) and gas (+1.3%) lead the way up, computers (-3.2%) and passenger cars (-0.2%) lead the way down.

  • Intermediate and crude pressures remain intense, rising 2.3% and 8.0% respectively for the month

  • Further margin squeeze likely to put further downward pressure on capex, especially in light of weak economy and credit conditions (see below)

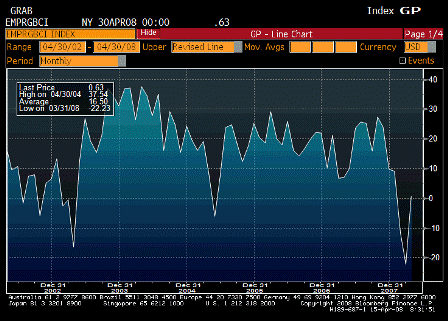
Empire jumps from -22.2 to 0.6. Index quite volatile and 10-20 point moves per month the norm as of late.

6mth expectations deteriorate from 25.8 to 19.6.

  • Shipments show largest jump from -5 to +17 (for current conditions)

  • Employment and average workweek both extremely weak

  • Capex intentions fall from 18 to 11.5

2008-04-15 Empire Manufacturing

Empire Manufacturing (Apr)

Survey -17.0
Actual 0.6
Prior -22.2
Revised n/a

Survey is colored by subjective recessions fears bouncing back some.


2008-04-15 NAHB Housing Market Index

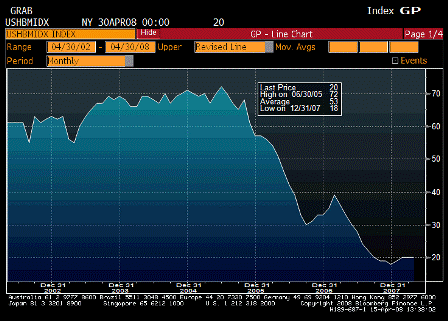
NAHB Housing Market Index (Apr)

Survey 20
Actual 20
Prior 20
Revised n/a

Still looks to me like a bottom.


2008-04-15 ABC Consumer Confidence

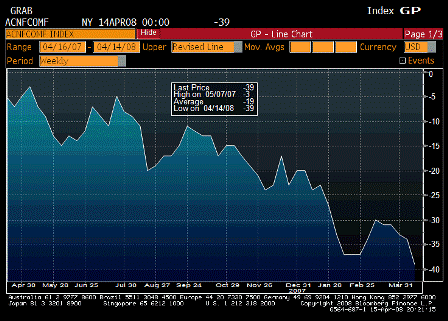
ABC Consumer Confidence (Apr 13)

Survey n/a
Actual -39
Prior -34
Revised n/a

Still looking weak. Much like an export economy

2008-04-14 US Economic Releases

2008-04-14 Advance Retail Sales

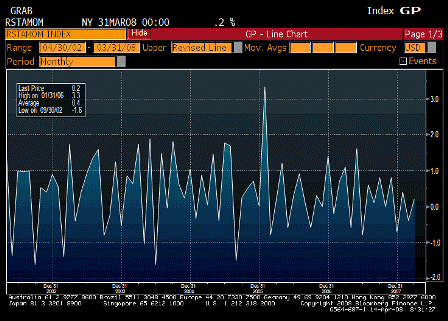
Advance Retail Sales (Mar)

Survey 0.0%
Actual 0.2%
Prior -0.6%
Revised -0.4%

2008-04-14 Retail Sales Less Autos

Retail Sales Less Autos (Mar)

Survey 0.1%
Actual 0.1%
Prior -0.2%
Revised -0.1%

2008-04-14 Retail Sales YoY

Retail Sales YoY

Survey n/a
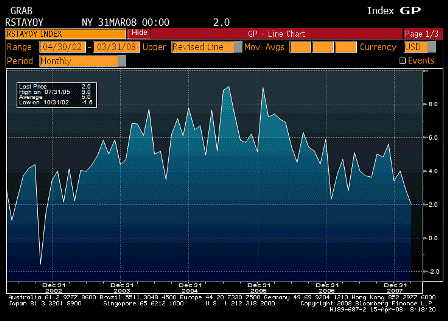
Actual 2.0%
Prior 2.9%
Revised n/a

Down, but not yet at ‘traditional’ recession levels, particularly with exports as strong as they are.

2008-04-14 Retail Sales TABLE

Retail Sales TABLE

From Karim:

Recent trend intact and in line with confidence surveys:

Nominal gwth zero for Q1 consumer spending

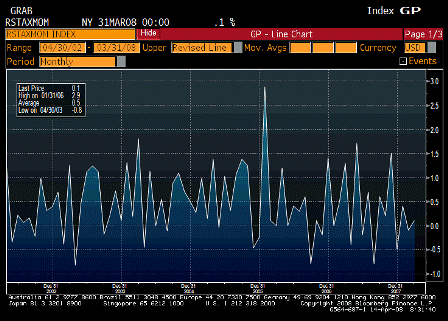
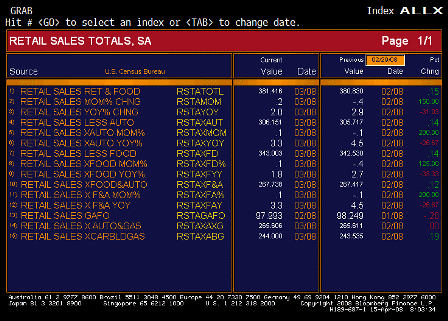
  • March retail sales +0.2%, +0.1% ex-autos, 0.0% ex-gas, and +0.2% for control group (autos, gas, and building materials)

  • Building materials down 1.6% shows housing decline continues to exert impact

  • Following items also negative: electronics -0.4%, furniture -0.3%, clothing -0.5%. Food +0.4% and gas +1.1%, lead the way.

  • Despite minor upward revision to February, 3mth annualized rate of change 0.0% for overall retail sales and -2.2% for retail sales ex-gas.

2008-04-14 Business Inventories

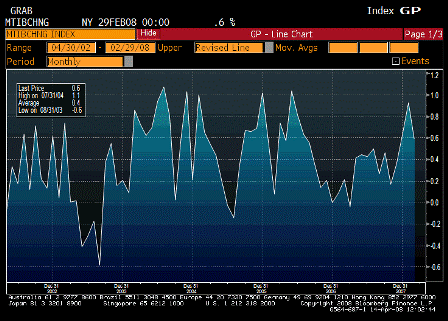
Business Inventories (Feb)

Survey 0.6%
Actual 0.6%
Prior 0.8%
Revised 0.9%

2008-04-14 Manufacturing & Trade Inventories YoY

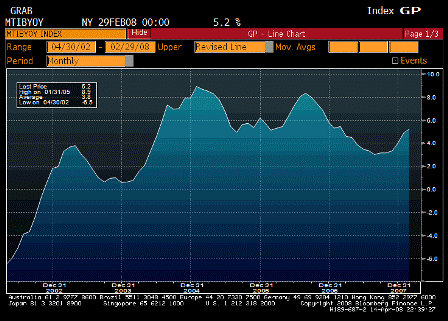
Business Inventories YoY

Survey n/a
Actual 5.2
Prior 4.9
Revised n/a

Inventories still very low for a recession, if we are in one.

2008-04-11 US Economic Releases

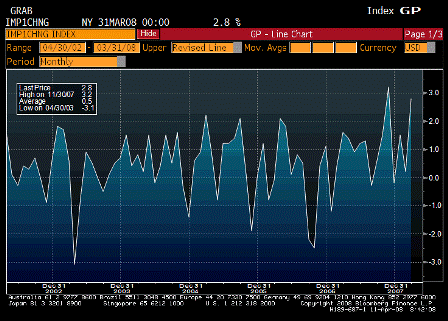
2008-04-11 Import Price Index MoM

Import Price Index MoM (Mar)

Survey 2.0%
Actual 2.8%
Prior 0.2%
Revised n/a

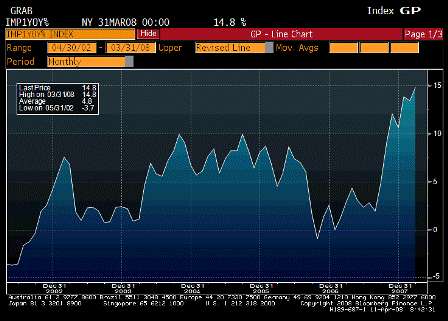
2008-04-11 Import Price Index YoY

Import Price Index YoY (Mar)

Survey 13.7%
Actual 14.8%
Prior 13.6%
Revised 13.4%

This is a very strong inflation channel.


2008-04-11 U. of Michigan Survey

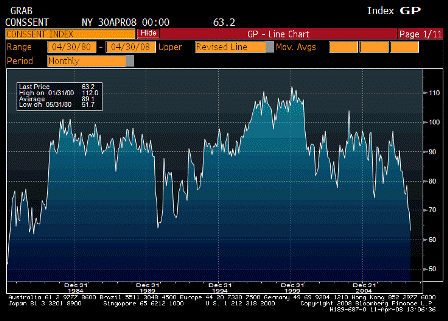
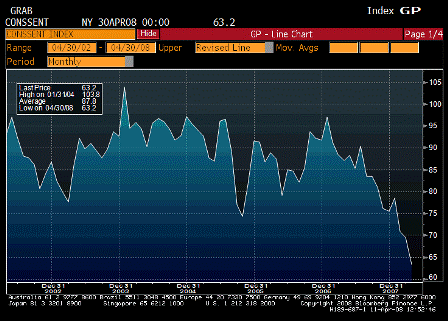
U. of Michigan Confidence (Apr P)

Survey 69.0
Actual 63.2
Prior 69.5
Revised n/a

From Karim:

  • Michigan survey takes out low from 1990-91 recession; prior lowest point was March 1982. Decline was from 69.5 to 63.2

2008-04-11 U. of Michigan Survey since 1980

U. of Michigan Survey since 1980

Interesting how low ‘confidence’ is in light of how much better GDP and employment is doing now vs then.

Part of it is the rising influence of the media, and part are the factors behind the export boom that are causing us to consume less and instead export more of our own output.

The channel this time around is rising costs for food and energy take away the purchasing power power needed to buy the rest of our output, and foreigners get to consume it instead via US exports.

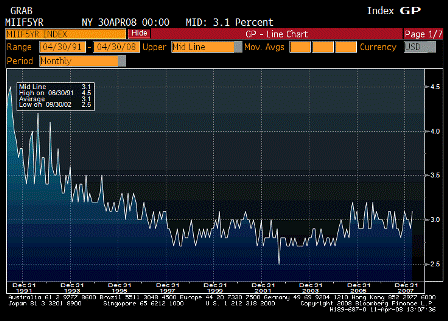
  • 5-10yr inflation expectations move to higher end of recent range

2008-04-11 U. of Michigan 5yr Ahead Inflation Expectations

5yr Ahead Inflation Expectations

Yes, it’s part of the equation, as above, and the FOMC ‘knows’ it can’t allow inflation expectations to elevate.

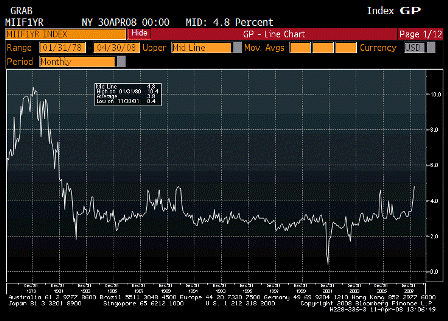
While the Fed gives the 5 year more weight, it also watches the one year, particularly when it spikes.

2008-04-11 1yr Inflation Expectations

1 yr Inflation Expectations

In today’s report the one year survey hit 4.8%, they highest since one 4.8% reading in 1990. The only time it’s been higher was during the ‘great inflation’ of the 70’s- early 80’s.

  • Worsening confidence also visible in job leavers component of employment report-% of workers who voluntarily leave their jobs (chart 3). Tends to rise when times are good and vice-versa. When declining, tends to be associated with lower wage growth and core CPI (an important piece of the output gap argument).

Other comments from Michigan survey make from grim reading:

  • There have only been a dozen other surveys that have recorded a lower level of consumer sentiment in the more than fifty-year history of the survey.

  • Consumers expected gains in their nominal incomes of just 1.0% in April, the smallest gain expected in three decades.

  • Three-in-four consumers expected bad times financially in the overall economy during the year ahead, the largest proportion recorded since 1980, and the fourth highest proportion in more than fifty years.

  • A record 41% of all home owners reported that their home had lost value during the past year
  • Just 5% of all consumers expected the unemployment rate to decrease in the year ahead, the smallest proportion ever recorded.

  • Uncertainty about future income and job prospects has had a devastating impact on buying plans, with consumers citing these uncertainties three times as frequently as they did a year ago. Purchase plans for furniture, appliances, home electronics, and similar goods fell to their lowest level since the 1990 recession, with one-third of all consumers specifically mentioning their uncertainty about jobs and incomes as their primary reason. Vehicle buying plans also fell to their lowest level since the 1990 recession, with one-third of all consumers citing uncertainty about jobs and incomes as well as the future price of gasoline.

That’s the Bernanke vision as per his latest congressional testimony- less consumption and more exports and investment. Looks good, feels bad.

2008-04-10 US Economic Releases

2008-04-10 Trade Balance

Trade Balance (Feb)

2008-04-10 Trade Balance TABLE

Trade Balance TABLE

Survey -$57.5B
Actual -$62.3B
Prior -$58.2B
Revised -$59.0B

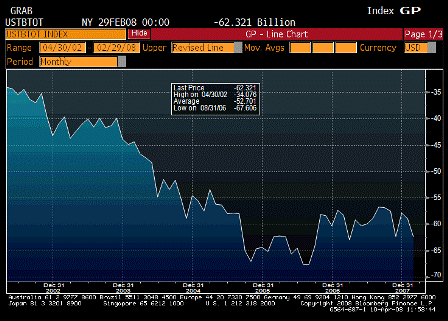
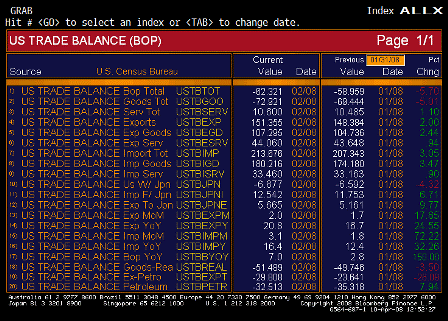
Exports still accelerating- up 2% over last month, a 26%+ annual rate, and 20.8% year over year.

Looks like an anomaly with imports, up 3.1% month over month and petroleum imports down. Very odd for non petroleum imports to be up – look for adjustments with next month’s number.

While this February number means Q1 GDP will be revised lower, the March report is likely to more than reverse this.


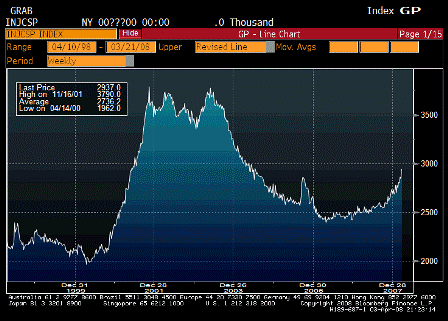
2008-04-10 Initial Jobless Claims since 1998

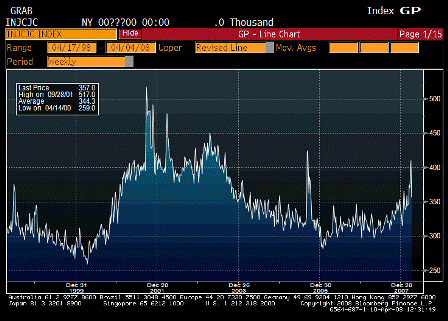
Initial Jobless Claims (Apr 5)

Survey 383K
Actual 357K
Prior 407K
Revised 410K

Back down but 4 week moving average still inching up some.

Not at recession levels yet.


2008-04-10 Continuing Claims since 1998

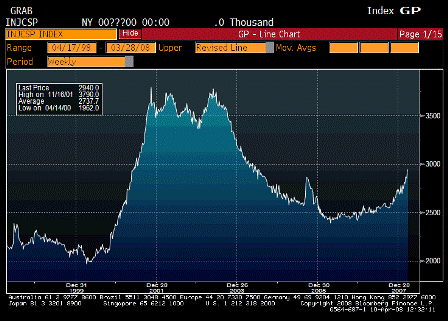
Continuing Claims (Mar 29)

Survey 2935K
Actual 2840K
Prior 2937K
Revised n/a

This lags a week. It has moved up over the last year, but still far from previous recession levels.


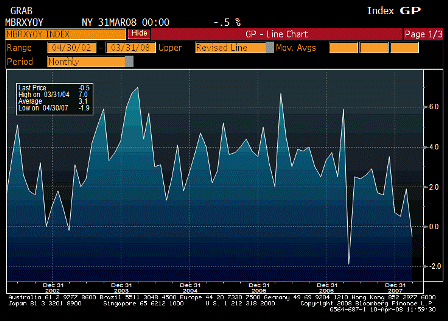
2008-04-10 ICSC Chaing Stores Sales YoY

ICSC Chain Stores Sales YoY (Mar)

Survey 0.9%
Actual -0.5%
Prior 1.9%
Revised n/a

Consumer remained weak in March – that’s what an export economy looks like.


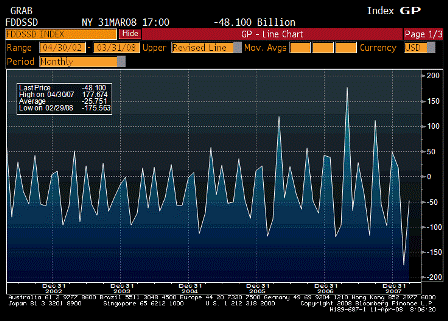
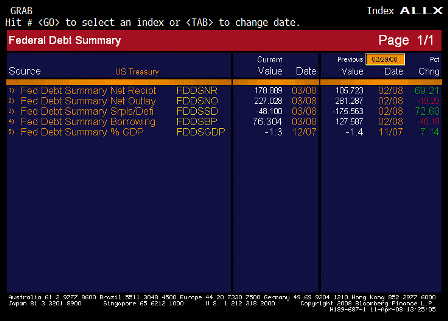
2008-04-10 Monthly Budget Statement

Monthly Budget Statement (Mar)

Survey -$70.0B
Actual -$48.1B
Prior -$96.3B
Revised n/a

2008-04-11 Monthly Budget Statement TABLE

Monthly Budget Statement TABLE

2008-04-09 US Economic Releases

2008-04-09 MBAVPRCH Index

MBAVPRCH Index (Apr 4)

Survey n/a
Actual 384.7
Prior 356.0
Revised n/a

If this is a recession, it’s not much of one, and housing is slowly bottoming and turning back up some.


2008-04-09 MBAVREFI Index

MBAVREFI Index (Apr 4)

Survey n/a
Actual 2724.7
Prior 2636.0
Revised n/a

The refi machine is far from dead.


2008-04-09 Wholesale Inventories

Wholesale Inventories

Survey 0.5%
Actual 1.1%
Prior 0.8%
Revised 1.0%

[comments]

2008-04-08 US Economic Releases

COMMENTS TO COME!!

2008-04-08 Pending Home Sales MoM

Pending Home Sales MoM (Feb)

Survey -1.0%
Actual -1.9%
Prior 0.0%
Revised 0.3%

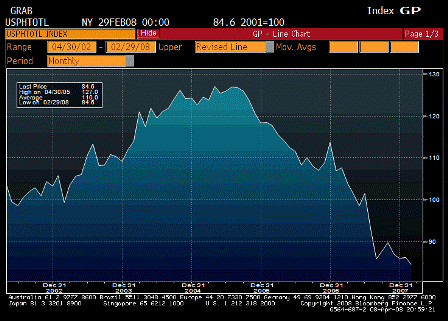
2008-04-08 Pending Home Sales Total SA

Pending Home Sales Total SA

Survey n/a
Actual 84.6
Prior 86.2
Revised n/a

Last month revised to actually being up a tad, but back down this month.

Not going anywhere as of February, but still a winter number.


IBD/TIPP Economic Optimism (Apr)

Survey 41.5
Actual 39.2
Prior 42.5
Revised n/a

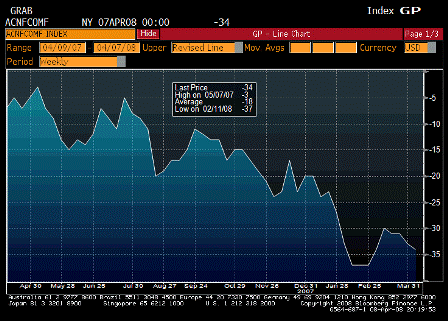
2008-04-08 ABC Consumer Confidence

ABC Consumer Confidence (Apr 6)

Survey n/a
Actual -34
Prior -33
Revised n/a

Still looking to me as turning to the upside. A stable stock market should help a lot.

2008-04-04 US Economic Releases

2008-04-04 Unemployment Rate

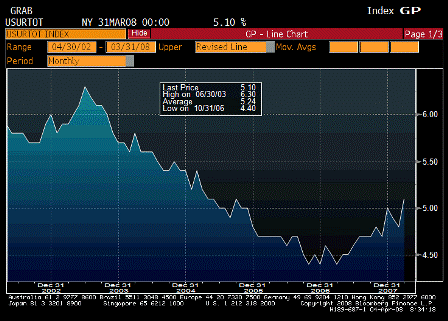
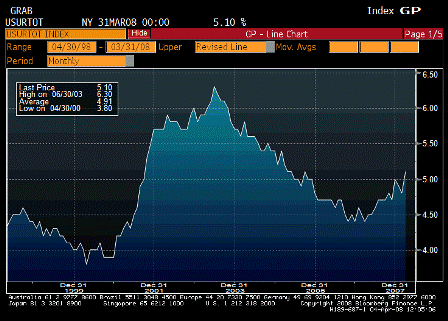
Unemployment Rate (Mar)

2008-04-04 Unemployment Rate since 1998

Unemployment Rate since 1998

Survey 5.0%
Actual 5.1%
Prior 4.8%
Revised n/a

From Karim:

Very weak report. Among the high(low)lights:
Unemployment rate rises from 4.8% to 5.1%
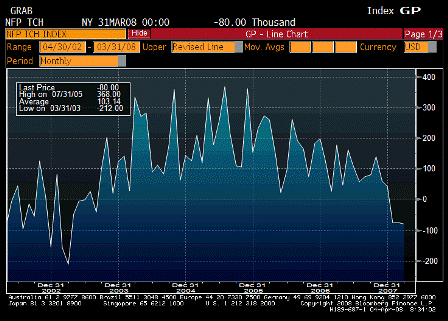
NFP -80k; net revisions -67k (Jan and Feb now down -76k in each month)
Household survey shows 434k rise in number of unemployed
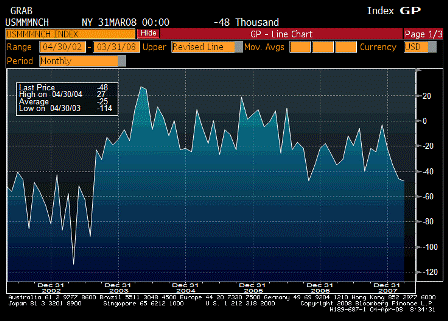
Construction -51k; manufacturing -48k;retail -12k; professional and business services -35k; education +42k; government +12k
Index of aggregate hours up 0.2% but down -1.2% annualized in Q1; all but assuring negative Q1 growth
Diffusion index up from 43.6 to 47.6


2008-04-04 Change in Nonfarm Payrolls

Change in Nonfarm Payrolls (Mar)

Survey -50K
Actual -80K
Prior -63K
Revised -76K

2008-04-04 Change in Manufacturing Payrolls

Change in Manufacturing Payrolls (Mar)

Survey -35K
Actual -48K
Prior -52K
Revised -46K

Payrolls lower than expected, previous months revised down some, confirming Q1 GDP somewhere around zero, and a flattish start for Q2 as well.

Not much of a market response, as this kind of weakness is no longer seen to threaten ‘market functioning’.

The perception of tail risk to market functioning is greatly diminished due to market perceptions that the Fed/Tsy is standing by to ‘write the check’ and that the checks won’t bounce.

Yes, they can be inflationary, and make the USD go down, but govt checks will clear and nominal demand can be sustained as desired.

The balance of risks are slowly returning to the more traditional/mainstream inflation vs growth and the appropriate interest rate policy to sustain the output gap necessary for price stability.

New data points for the Fed:

flat growth at best,

5.1% unemployment,

and yet demand is high enough to keep crude over $105, food prices skyrocketing, inflation at 4%, and the dollar falling like a stone and driving other import prices up.

And for as long as they can remember their forecasting models for prices have been unreliable at best.

Weaker growth with higher inflation likely tips their models to requiring a higher output gap (higher unemployment) to bring inflation down over their two year horizon.


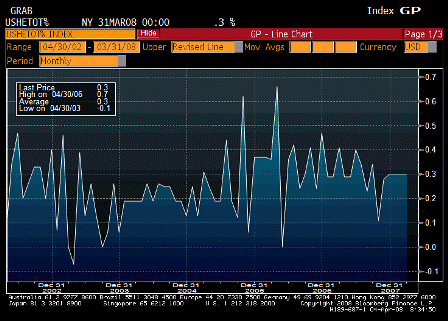
2008-04-04 Average Hourly Earnings MoM

Average Hourly Earnings MoM (Mar)

Survey 0.3%
Actual 0.3%
Prior 0.3%
Revised n/a

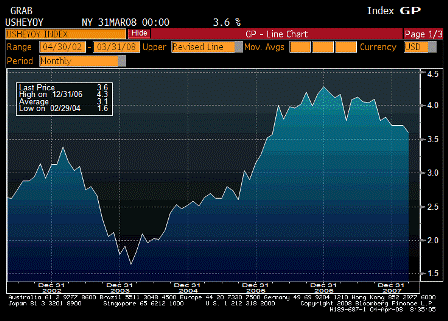
2008-04-04 Average Hourly Earnings YoY

Average Hourly Earnings YoY (Mar)

Survey 3.6%
Actual 3.6%
Prior 3.7%
Revised n/a

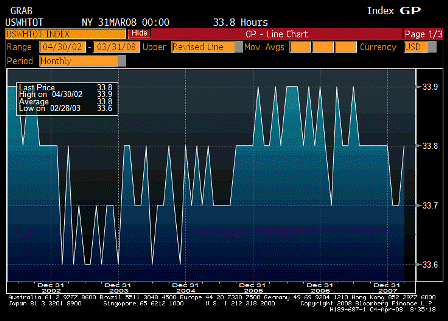
2008-04-04 Average Weekly Hours

Average Weekly Hours (Mar)

Survey 33.7
Actual 33.8
Prior 33.7
Revised n/a

Never actually goes down.

2008-04-03 US Economic Releases

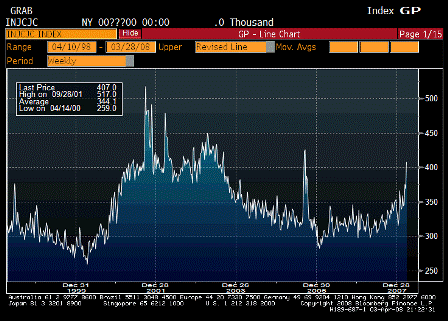
2008-04-03 Initial Jobless Claims

Initial Jobless Claims (Mar 29)

Survey 366K
Actual 407K
Prior 366K
Revised 369K

2008-04-03 Continuing Claims

Continuing Claims (Mar 22)

Survey 2860K
Actual 2937K
Prior 2845K
Revised 2840K

This is now more in line with what’s looked like near zero growth for the first quarter, and not much more is expected for Q2.

While fear of systemic risk has been reduced with the realization that the Fed/Tsy can -and probably will- simply ‘write checks’ as needed, that doesn’t guarantee general weakness won’t continue.

As Karim has been indicating, we may be near the end of rate cuts, but continued weakness could mean rates stay down for a ‘considerable period.’

Also note markets aren’t (yet) moving much on this.

With reduced systemic risk fears, these types of numbers are more ‘rear view mirror’ events than forward looking regarding the future of GDP growth.

In other words, data can be forward looking for some purposes, like systemic risk, and rear view mirror for other purposes, like GDP growth.

Also, Bernanke pointed to differences between now and the 1930’s, leaving out the largest factor – the gold standard. With a fixed exchange rate policy the govt can’t ‘simply write checks’ as that tends to result in outflows of gold/spikes in interest rates that can quickly lead to default/devaluation.

(The US shut down in the payments system in 1934 and reopened with a domestically suspended gold standard and federal deposit insurance.)

From Karim:

  • Initial claims spike from 369k to 407k; a labor department spokesman said that more claims were processed last week due to good Friday holiday the week before

  • So that means that the rate of change is exaggerated, but not the level (prior week should have been more than 369k

  • Continuing claims (which come out with a 1 week lag) rose from 2840k to 2937k; if to follow the same pattern as continuing claims, should rise again next week

  • Employment component of last non-mfg ISM will be important in shaping final estimates for payrolls tomorrow; right now looks to be about flat

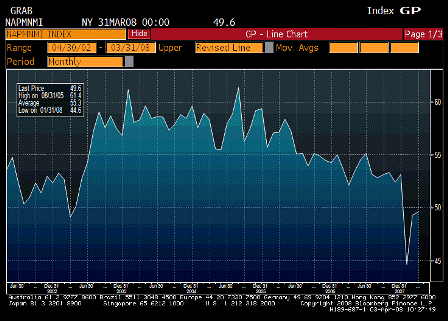
2008-04-03 ISM Non-Manf. Composite

ISM Non-Manf. Composite (Mar)

Survey 48.5
Actual 49.6
Prior 49.3
Revised n/a


Nice bounce off the bottom though longer term still drifting lower.


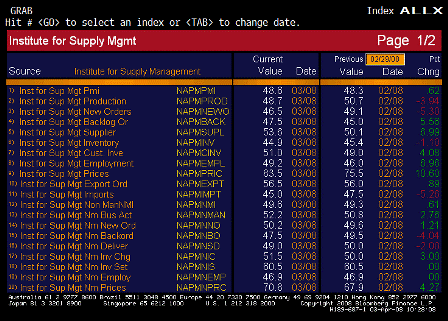
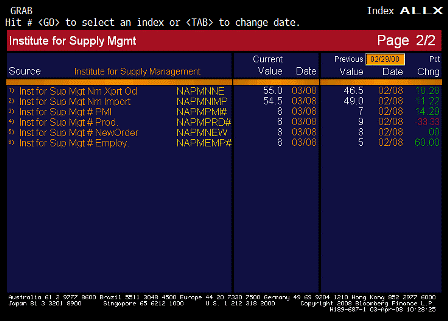
2008-04-03 ISM TABLE

2008-04-03 ISM TABLE

ISM TABLE (Mar)

From Karim:

Consolidating at contraction levels; employment unch at 46.9;

Yes, bodes for flat Q1 and probably a slow start to Q2.

inventory
sentiment remains poor (inventories too high)

Yes, meaning they are running relatively lean for a recession.
Also, new orders up some export orders up very sharply to 55, indicating continuing weakness for domestic demand but exports picking up the slack and then some.
Prices paid up and too high as well.

Weakness and higher prices continues.

(Crude now up on the day.)