Mtg Purchase Apps, Arch. Billings, Japan Exports, Bernie Article

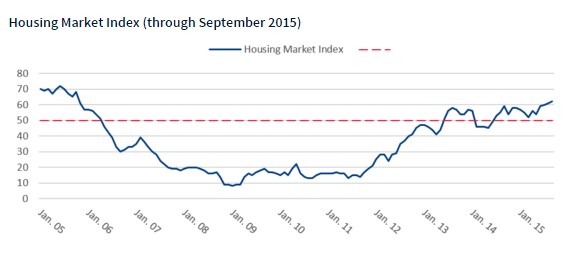
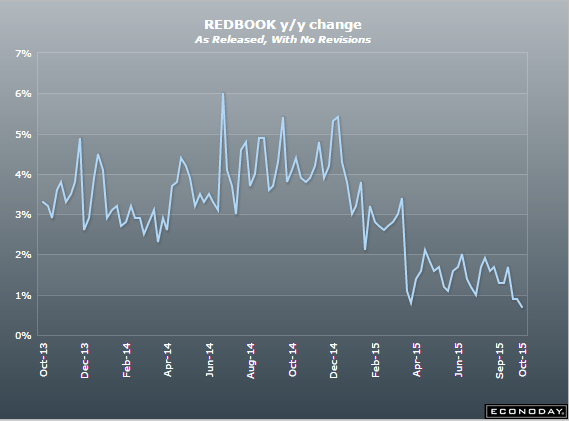
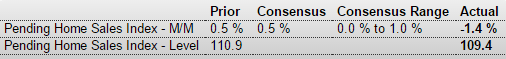
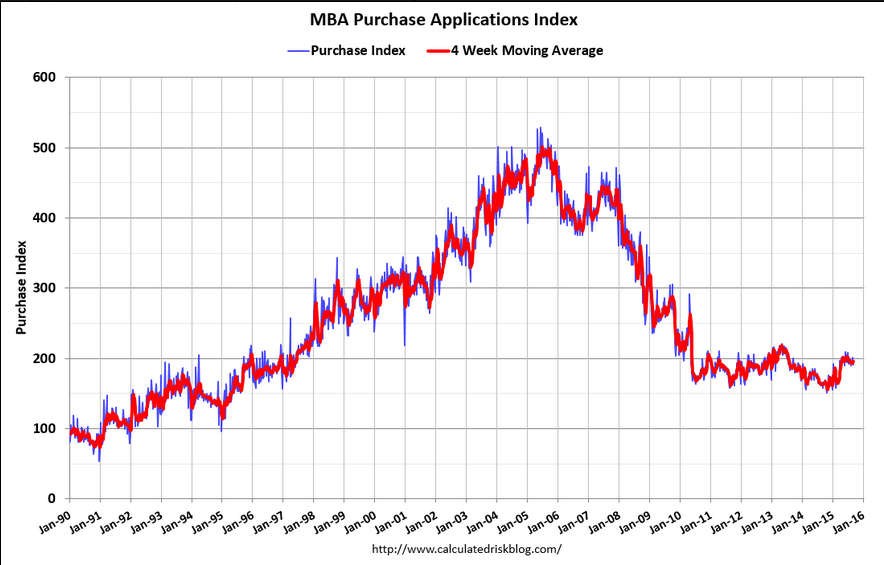
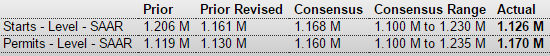
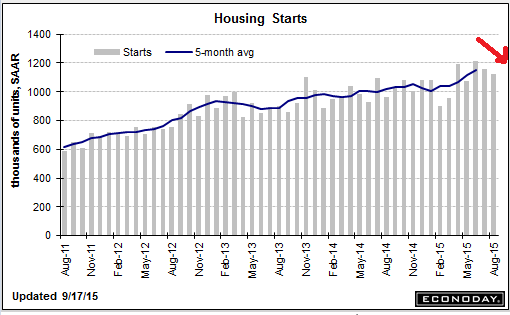
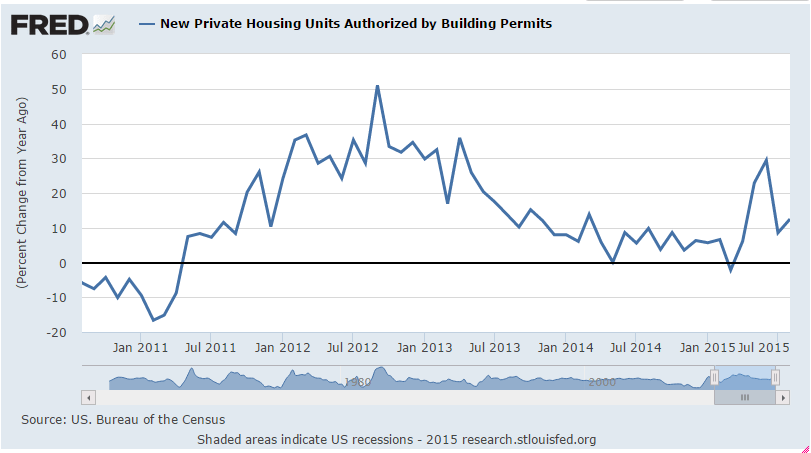
After the up and down in front of the change in regulations new purchase apps are, so far, lower than before:
sg2015102141533 (1)

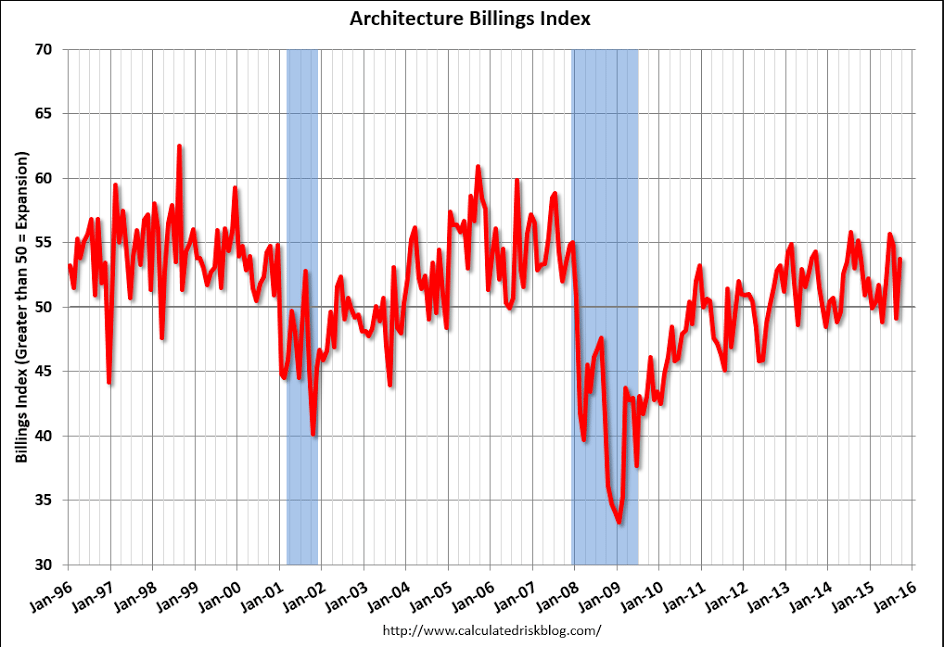
Fits with the permit spike/decline story, and there was also this note:

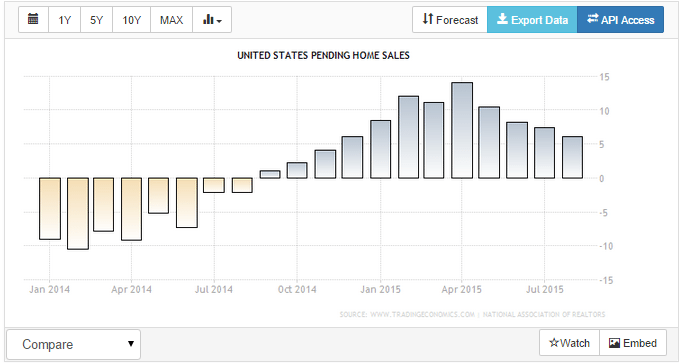
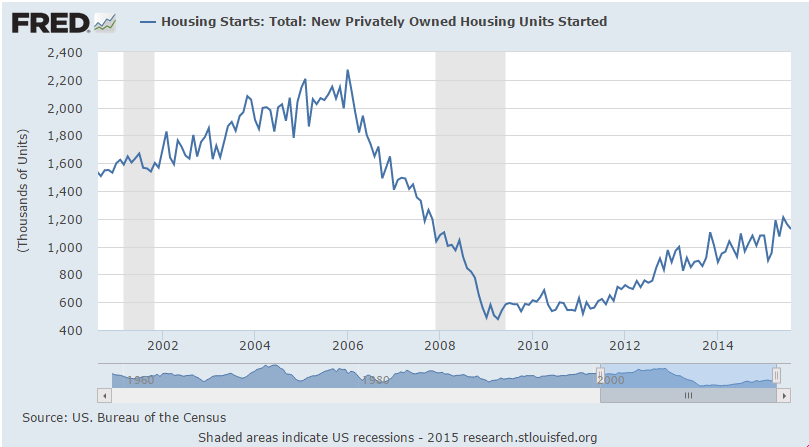
The multi-family residential market was negative for the eighth consecutive month – and this might be indicating a slowdown for apartments – or at least less growth.
er-10-21-5

Japan export growth slows sharply, raising fears of recession

By Tetsushi Kajimoto

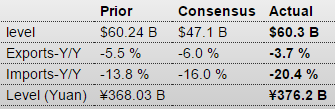
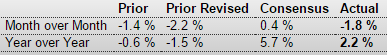
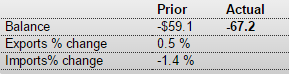
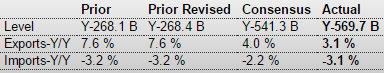
Oct 21 (Reuters) — Japan’s annual export growth slowed for the third straight month in September, a worrying sign that overseas sales continued to drag on growth last quarter, adding to fears of a recession.

Ministry of Finance data showed exports rose just 0.6 percent in the year to September, against a 3.4 percent gain expected by economists in a Reuters poll.

That was the slowest growth since August last year and followed a 3.1 percent gain in August 2015. Compared with last month seasonally-adjusted shipments declined 1.7 percent.

Wednesday’s data is the first major indicator for September and is part of the calculation of third quarter gross domestic product. A third quarter contraction would put Japan into recession, given the second quarter’s negative GDP data.

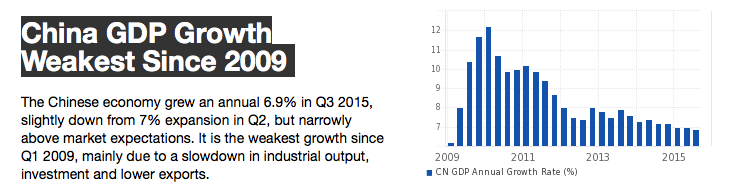
China’s slowdown and soft domestic demand weighed on factory output and the broader economy, although the Bank of Japan saw the effects of China’s slowdown were limited for now, as it sticks to its rosy growth outlook, but that may change at the BOJ’s monetary policy review on Oct. 30.

The author is on the right track- it’s about aggregate demand and ‘inflation’ from excess demand.

But it’s not about rates per se, which are about the Fed’s reaction function, which does happen to include inflation, so to that extent it’s sort of ok…

Bernie Sanders doesn’t need to pay for his socialist utopia

By Jeff Spross

Without a doubt, presidential contender Bernie Sanders boasts the most ambitious policy proposals of anyone on the Democratic side. And sooner or later, the same question always comes up:

“Yeah, those are lovely ideas, but how’s he gonna pay for all this?”

For people who oppose Sanders’ program, it makes for a nice “gotcha.” But Sanders’ supporters bring it up sometimes too. Comedian Bill Maher pressed the senator on this last Friday, and Sanders dutifully listed off various ideas. They might bring in enough revenue or they might not; like his fellow candidates, Sanders’ proposals are still in their protean stage. What’s interesting is that Sanders and his fans are implicitly conceding that, yes, we would need to pay for this stuff.

May I humbly suggest this is wrong?

Not only do we not need to pay for Sanders’ programs, we shouldn’t pay for them. In fact, the federal government’s budget deficit is much too low.

How could I possibly suggest anything so loony? Contrary to popular belief, smaller deficits are not always better. How big or small the deficit should be is determined by how it interacts with the rest of the U.S. economy and other international economies. And there are two key metrics to look for there: interest rates and inflation.

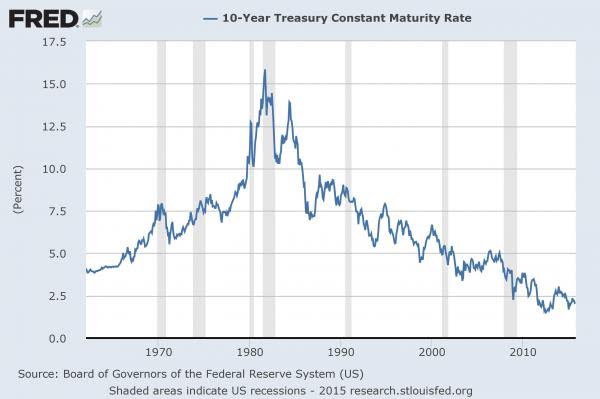
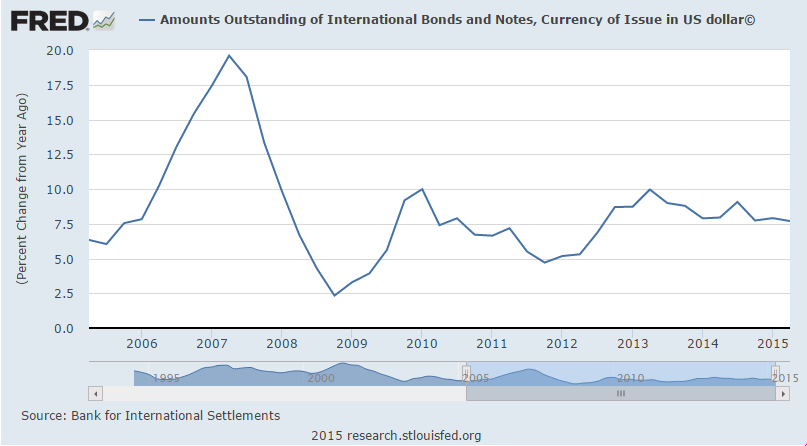
Like you or me or any company, when the U.S. government borrows money, it pays its lenders interest. This is an investment by the lender based on how much risk they want to take. So if they consider you a safe investment, they’ll demand low interest rates, and if they consider you a risky investment, they’ll demand higher rates. And interest rates on U.S. debt are currently the lowest they’ve been in at least half a century:
er-10-21-6
Equally important is why. If investors consider government debt unusually safe, it’s because they aren’t seeing lots of other places in the economy worth investing in. This shouldn’t be surprising: Our economic growth and job creation remain sluggish, there are no signs of wage growth, work force participation isdown, and economic insecurity remains high. There’s just not a lot of exciting economic ferment going on out there.

One big reason for this is that the government itself has pulled way back from spending money in the economy and hiring people. Economic ferment breeds economic ferment. More government aid, investment and hiring would mean more people with incomes to spend, creating more jobs in the private sector. So there should be a natural corrective here: Interest rates on government debt fall because it’s the only safe investment, so government borrows more and spends it, the economy picks up, and interest rates on the debt rise as investors find other places to park their cash.

But American policymakers moralize debt and deficits and think they should always be smaller, so that doesn’t happen.

Which brings us to the other key metric: inflation. Unlike you or me or any company, the U.S. government can print (or, in the digital age, create) money. At the end of the day, if you’re worried that government borrowing will drive up interest rates, you can always just have your central bank print more money and buy up government debt. One of the big reasons investors view the debt of advanced governments as safe is because, at the end of the day, they can always pay you back with money creation. And the central bank buying debt raises the demand for it, which brings interest rates back down.

But it also adds to the money supply, which threatens inflation — except that, as with interest rates, inflation is only going to rise once we’ve attained full employment. That’s when the new money stops being soaked up by new economic activity, and starts going into price increases instead. But the Federal Reserve has actually been creating a ton of new money recently, and it hasn’t really goosed the economy. That’s probably because the normal ways the Fed injects money into the economy don’t work as well as going in via government hiring and state aid.

So at the highest conceptual level, money printing and borrowing — monetary policy and fiscal policy — collapse into one another. This makes inflation, even more than interest rates, the key upper limit to government borrowing.

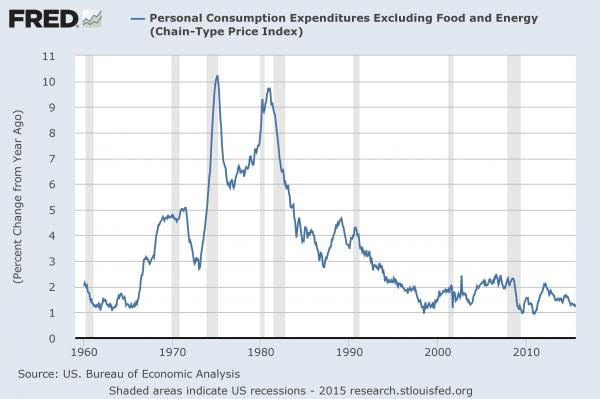
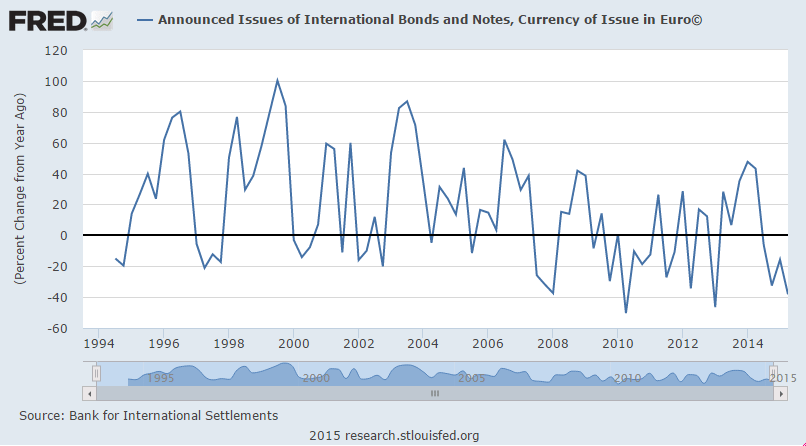
And the inflation rate is, well, about as low as it’s been in half a century:
er-10-21-7
The conclusion, by now, should be obvious: Government deficits are too low, and have been too low for agood long while.

Once you realize all this, it actually upends a lot of conventional wisdom. People usually talk about taxes and spending as being in balance with one another, but they’re actually both in balance with two other forces: the money supply and the overall health of the economy. You really can’t think of the government as just another economic actor, like an individual person or a business. It’s a unique thing unto itself: a hub or ballast tank for the overall flow of money and activity through the economy. No, its capacities to borrow and print money aren’t infinitely elastic. But it’s perfectly plausible that we could enter periods, like the current global doldrums, where government should run really big deficits and print lots of money for extended periods.

Take Bernie Sanders’ own favored example of Denmark: The Danes run a very generous welfare state, and have taxes high enough to pay for it. But Denmark is also facing a sluggish economy and rock-bottom inflation. So it’s actually being much too fiscally responsible. Denmark should expand its deficit — in this case, given the size of its deficit, by cutting its tax rates — and loosen up its monetary policy to buy up all that new debt. Taxes, under this logic, aren’t really about bringing in revenue — rather, they’re just another dial for managing this flow. And it’s conceivable that they would never need to balance with spending.

What’s funny is that Sanders might be gearing up to make this very argument. His chief economic adviser, University of Missouri-Kansas City economist Stephanie Kelton, is a fan of something called modern monetary theory: a batch of ideas that sketches out a very similar case to the one above.

Of course, Sanders hasn’t done this yet. And maybe he won’t.

But if he ever chose to throw down in favor of bigger deficits and more money-printing — on the national stage of a presidential election, no less — he’d be doing the country a tremendous service.

Home Buyer Index, China GDP

Builders are expecting improvement, but seems actual buyers walking in the door remains depressed:

Housing Market Index
er-10-19-1

Sales expectations in the next six months rose 7 points to 75, while current sales conditions rose 3 points to 70. Buyer traffic, however, didn’t move, sitting at 47— the only component still in negative territory.

Regionally, on a three-month moving average, the West registered a 5-point gain to 69, and the Northeast, Midwest and South each rose 1 point to 47, 60 and 65, respectively.

er-10-19-2
er-10-19-3

China trade, WRKO interview

Total trade is down, but the surplus is still high and holding, which ultimately supports the currency:

China : Merchandise Trade Balance
er-10-13-5
Highlights
Every month China’s trade data are reported in both the renminbi and U.S. dollars by the National Bureau of Statistics. The renminbi report comes out first, followed about an hour later by the more closely-watched U.S. dollar report. Since the August 11 devaluation of the renminbi there is a wider discrepancy between the two sets of data and it has taken on added significance.

September imports, in renminbi terms, fell 17.7 percent from a year ago after dropping 14.3 percent in August. This is the 11th consecutive decline and the worst pace since May. But, exports fell just 1.1 percent, holding up much better than expected. This is third straight decline and points to some stabilization. As a result of weakening imports but improving exports, the trade surplus surged to a record high. The surplus was Rmb376 billion. That was almost 30 percent higher than the August surplus.

Low commodity prices, compounded by deteriorating domestic demand, are cutting the import bill. Exports have performed comparatively better but are also weak and are falling in year-on-year terms.

The trade surplus in U.S. dollar terms was $60.3 billion. On the year, exports were down a less than anticipated 3.7 percent while imports plunged 20.4 percent.
er-10-13-6

Short interview on recession possibility:

Saudi Oil Production, US Trade, Gallup Index, Redbook Retail Sales, German Manufacturers’ Orders

Their price cuts reported yesterday indicate they’d like to pump more:
er-10-6-1
Gap widening as previously suspected, even with lower oil prices:

International Trade
er-10-6-2
Highlights
A surge in imports of new iPhones helped feed what was an unusually wide trade gap in August of $48.3 billion, well up from July’s revised $41.8 billion. But cell phones, at $2.1 billion, make up only a portion of the gap with a drop in exports the most salient factor. Exports were down nearly across the board including industrial supplies at minus $2.2 billion, consumer goods at minus $0.6 million, autos at minus $0.5 million, and foods/feeds/beverages at minus $0.3 million. Weakness in exports reflects weakness in foreign demand together with the strength of the dollar.

The goods gap came in at $67.9 billion, which is up from last week’s advance reading of $67.2 billion. The petroleum gap, which is always a central factor in the nation’s deficit, fell to $6.9 billion from July’s $8.1 billion and reflects lower prices. Demand for the nation’s services, unlike its goods, continues to climb, to a surplus of $19.6 billion vs $19.5 billion in a reflection of demand for technical and managerial services.

By country, the gap with China, the main source of iPhones, rose sharply, to $35.0 billion from $31.6 billion. The gap with Mexico widened to $5.3 from $3.4 billion. Other bilateral data are mostly steady though the gap with the EU narrowed to $13.8 from $15.2 billion.

Imports are a subtraction on the national accounts but are, nevertheless, a two-way street, that is reflecting demand at home which is a sign of economic strength, not weakness. Still these results will limit expectations for third-quarter GDP.
er-10-6-3
Gallup US ECI
er-10-6-4
Highlights
Unlike other confidence readings that are climbing, Gallup’s reading is holding at lows, at minus 14 in September vs August’s minus 13. The report cites losses in the stock market and disappointing jobs data as negatives, offset by low prices at the gas pump. For current conditions, 24 percent of the sample rates the economy as excellent or good vs 31 percent rating it as poor. For expectations, 38 percent say the economy is getting better vs 58 percent who say it’s getting worse.

Just when you think it can’t get any worse:

Redbook
er-10-6-5
Highlights
Retail sales are looking very soft based at least on Redbook’s sample which has been reporting, mostly in contrast to solid government data, soft results since way back in March. Same-store sales are up only 0.7 percent for the October 3 week which is the weakest Redbook reading of the year. The report doesn’t offer any meaningful commentary on the weakness but does say seasonally cooler weather is now helping sales at specialty and department stores.
er-10-6-6

Germany under pressure as well:

Germany : Manufacturers’ Orders
er-10-6-8
Highlights
Manufacturing orders were weaker than expected in August. A 1.8 percent monthly fall followed a steeper revised 2.2 percent drop in July and constituted the first back-to-back decline since January/February. However, with orders down a particularly hefty 5.3 percent a year ago, annual growth still rebounded sharply to stand at 2.2 percent.

The monthly decrease was led by capital goods which were down fully 2.8 percent. However, weakness was broad-based as consumer and durable goods dropped 1.5 percent and basics were off 0.4 percent.

Regionally domestic orders contracted 2.6 percent after a 3.7 percent bounce at the start of the quarter and, ominously, have now declined in four of the last five months. Overseas demand fell 1.2 percent, compounding July’s 6.1 percent slump and would have looked a lot worse but for the surprising robustness of the Eurozone component which posted a 2.5 percent gain following a 0.6 percent increase last time. Orders from the rest of the world fell 3.7 percent having already nosedived 10.1 percent in July.

August’s setback means that average total orders in July/August were 2 percent below their mean level in the second quarter. The new manufacturing PMI pointed to solid growth of both output and orders in September but readings here have proved overly strong in recent months. Although early days yet, there are good reasons for supposing that the economic recovery has lost some momentum and hopes for a rebound this quarter are looking somewhat optimistic.

Cartoon, US International Trade, India, Redbook Retail Sales, China Comments, Consumer Confidence

image (3)
As previously discussed, trade deficit increasing:

United States : International trade in goods

dt-9-29-1

Definition
The Census Bureau is now publishing an advance report on U.S. international trade in goods. The BEA will incorporate these data into its estimates of exports and imports for the advance GDP estimates. This is expected to reduce the size of revisions to GDP growth in the second estimates.

Just maybe the higher rates have been supporting the higher inflation? And supporting growth?

India cuts policy rate by bigger-than-expected 50 bps

Sept 29 (Reuters) — The Reserve Bank of India cut its policy interest rate to a 4-1/2 year low of 6.75 percent on Tuesday, in a bigger-than-expected move that, with inflation running at record lows, could help an economy in danger of slowing down.

A Reuters poll last week showed only one out of 51 economists had expected a 50 basis points cut in the repo rate , while 45 had expected a 25 bps cut.

The RBI had previously cut interest rates three times this year, lowering it by 25 basis points each time.

The RBI justified the bigger reduction, saying consumer inflation was likely be running at 5.8 percent, below the 6 percent target for January, thanks partly to the government’s efforts to contain food prices.

Redbook retail sales dismal and dragging along the lows:
image (4)

Barclays analysts visited China and came back saying it was one of the most bearish trips they’ve ever taken

Good number here but not confirmed by sales reports, at least not yet:

Consumer Confidence
dt-9-29-2

Personal Income, Pending Home Sales, Dallas Fed, China

Been almost a year, and still looks to me like the oil price collapse was an unambiguous negative for the US and global economies. And for the same reasons. For every buyer of oil who benefited, a seller of oil lost exactly that much. That leaves the drop in capex, as well as the continued decrease in net government spending, which has yet to be ‘replaced’ by alternative spending. Apart from inventory building…

Personal Income and Outlays
er-9-28-1
Highlights
The consumer is making money and spending money at the same time that inflation is very quiet. Personal income rose 0.3 percent in August which is on the low side of expectations but July is now revised 1 tenth higher to a very solid 0.5 percent. And the wages & salaries component is also very solid, at plus 0.5 and 0.6 percent the last two months. Turning to spending, the gain is 0.4 percent which is 1 tenth above consensus with July revised 1 tenth higher to 0.4 percent also.

Inflation readings came in as expected, at no change for the PCE price index and up only 0.1 percent for the core. Year-on-year, overall prices are up only 0.3 percent, which is unchanged from July, with the core ticking 1 tenth higher to 1.3 percent which is still well below the Fed’s 2 percent target.

The savings rate is solid at 4.6 percent and has been edging lower from 4.9 percent in April. This may be a sign of confidence among consumers who are now willing to spend while saving less. Other details include a rise for rents but a dip for proprietor income.

This report is very healthy but how it plays for the FOMC is uncertain. Income and spending would justify a rate hike but not the inflation readings.

Note the ‘peaks’ back around November when oil prices collapsed:
er-9-28-2
This is before inflation adjustment:
er-9-28-3

And this is per capita:
er-9-28-4
And on the consumption side:
er-9-28-5
er-9-28-6
er-9-28-7
Slipping back as previously suggested:

Pending Home Sales Index
er-9-28-8
Highlights
The existing home sales market looks to remain flat in the coming months based on the pending home sales index which fell a disappointing 1.4 percent in August. Three of four regions posted declines led by the Northeast at 5.6 percent with the South, which is by far the biggest housing region, down 2.2 percent. Only the West posted a gain, at 1.8 percent.

Existing home sales are being limited by lack of homes on the market which itself, however, reflects softness in home prices and general demand. But there is strength in housing and that’s in new home sales and construction. Watch for Case-Shiller home price data on tomorrow’s calendar.
er-9-28-9

Less worse, but remains negative:

Dallas Fed Mfg Survey
er-9-28-10
Highlights
The Dallas Fed rounds out a full run of negative indications on the September factory sector with the general activity index remaining in deeply negative ground at minus 9.5. New orders are at minus 4.6 which, however, is an 8 point improvement from August. Production is actually in positive ground at 0.9.

Other readings include a decline in the workweek and the fifth straight contraction for employment. Price readings show little change for inputs but, like other reports, contraction for finished prices.

The Texas economy has been depressed all year by the energy sector while the nation’s factory sector continues getting hurt by weak foreign demand and strength in the dollar.

Looks a lot like a recession, no?
er-9-28-11

China’s industrial restructuring cuts power use, freight volume

Sept 26 (Xinhua) — Zhang Xiaoqiang, executive deputy director of China Center for International Economic Exchanges. Zhang admitted that there were some doubts about China’s economic growth rate in the first half (H1), as two key indicators of economic growth, namely power consumption and freight volume, dropped remarkably. The discrepancy between economic growth and the two key indicators’s growth in the first six months did not fit with previous patterns, but industrial restructuring is a new factor, and should be taken into account when analyzing the new situation, he said.

Redbook Retail Sales, Richmond Fed, Architectural Index, Mtg Purchase Index, Chemical Activity Barometer, China, Unemployment Duration Chart

No sign of improvement:
er-9-23-1

Bad:

Richmond Fed Manufacturing Index
er-9-23-2
Highlights
Early indications on the September factory sector are negative and now include a minus 5 headline from the Richmond Fed. New orders, unfortunately, are even more deeply in the negative column at minus 12 which points to even weaker activity in the months ahead. Shipments are already in the negative column for a second straight month at minus 3. And manufacturers in the region have already worked down their backlogs to keep up production with backlogs in deep contraction at minus 24 and minus 15 the last two months. Employment is in the plus column but just barely at 3 and it won’t stay there for long if orders and production continue to weaken. Price readings are moderating further to round out an unpleasant picture of unexpected slowing. Last week’s Philly Fed report and especially the Empire State report also pointed to weakness this month. Watch for the manufacturing PMI on tomorrow’s calendar which will give a national look at the September factory sector.

Down as well:
er-9-23-3
Moved up some for the week but as per the chart still drifting a bit lower:
er-9-23-4

Looks like it’s maybe heading south:

September 2015 Chemical Activity Barometer Says Economy Will Continue to Slow

from the American Chemistry Council

The Chemical Activity Barometer (CAB), dropped 0.4 percent in September, following a revised 0.2 percent decline in August. The pattern shows a marked deceleration, even reversal, over second quarter activity. It is unlikely that growth will pick up through early 2016.
er-9-23-5

‘Markit’ reports like this PMI are always suspect but narrative is interesting:

PMI Manufacturing Index Flash
er-9-23-6
Highlights
Growth in Markit’s manufacturing sample remains as slow as it’s been since October 2013, stuck at 53.0 for the September flash. The reading is the same as the final August result and little changed from August’s flash of 52.9. It’s also below the recovery’s 54.3 average.

Growth in new orders is the slowest since January with businesses citing caution among customers and subdued business conditions. Export orders, hurt by weak foreign demand and strength in the dollar, have been very weak this year but did improve slightly in the latest report. Slow orders are leading the sample to slow hiring and trim inventories. The latest gain for employment is only marginal and the weakest since July last year.

Prices are especially weak in the report, showing the first drop in four months for input costs and the first drop in finished goods since August 2012. Fed policy makers, concerned by low inflation, are likely to take special notice.

The 53.0 headline points to more strength than many of the details of the report. Together with the September run so far of regional surveys, the manufacturing sector does not look like it’s having much of a month. Watch for durable goods orders tomorrow for definitive data on August followed by the Kansas City manufacturing update for September.

Fiscal does work if they ‘do what it takes’. Maybe the policies of the western educated kids has been over ruled by their elders?

Production declines further as total new orders fall at faster pace

Sept 23 (Markit) — Flash China General Manufacturing PMI at 47.0 in September (47.3 in August). Manufacturing Output Index at 45.7 in September (46.4 in August). The decline indicates the nation’s manufacturing industry has reached a crucial stage in the structural transformation process. Overall, the fundamentals are good. The principle reason for the weakening of manufacturing is tied to previous changes in factors related to external demand and prices. Fiscal expenditures surged in August, pointing to stronger government efforts on the fiscal policy front.

er-9-23-7

Japan Downgrade, China GDP Model, Earnings Reports, Italian Trade, Housing Starts, Rail Traffic, Fed Comment

Yields on JGB’s fall a bit with S&P downgrade. I’ve spoken to S&P. They know better. They are intellectually dishonest.
er-9-18-1
er-9-18-2

I included these as they give some indication of the macro outlook:

FedEx Trims Outlook on Weak Freight Demand

Sept 16 (WSJ) — FedEx said it expects adjusted earnings of $10.40 to $10.90 a share for the year ending May 31, down from its previous guidance of $10.60 to $11.10 a share. Average daily volume for Ground’s package business grew 4% in the quarter, which was about in line with the company’s expectations. Ground’s operating income slipped 1% to $537 million, while revenue shot up 29% to $3.83 billion in part from the addition of GENCO. For the first quarter ended Aug. 31, FedEx posted a profit of $692 million, or $2.42 a share, up from $653 million, or $2.26 a share, a year earlier. Revenue increased 5% to $12.3 billion.

Oracle Reports Decline in Profits

Sept 16 (WSJ) — Oracle said net income fell 20% in the period ended Aug. 31, but was off only 8% excluding currency effects. Total revenue, off 2%, was up 7% on a constant-currency basis, Oracle said. Oracle said new licenses declined 16% in dollars, or 9% in constant currency. Overall, Oracle reported a profit of $1.75 billion, or 40 cents a share, down from $2.18 billion, or 48 cents a share, a year earlier. Excluding stock-based compensation and other items, profit would have been 53 cents a share, compared with 62 cents a year earlier. Total revenue declined to $8.45 billion from $8.6 billion a year earlier.

Euro friendly:

Italy : Merchandise Trade
er-9-18-3
Highlights
The seasonally adjusted trade balance was in a E3.7 billion surplus in July, up from an unrevised E2.6 billion excess in June.

However, the headline improvement masked contractions in both sides of the balance sheet. Hence, exports fell 0.4 percent on the month, their third decline since March but only due to weakness in energy (ex-energy exports grew 0.4 percent). Imports were off a steeper 3.7 percent (minus 4.0 percent ex-energy). Compared with a year ago, exports were up 6.3 percent after a 9.4 percent rise in June and imports 4.2 percent higher following a 12.2 percent gain last time.

The July black ink was more than 6 percent above its average level in the second quarter. This suggests that net exports could provide a boost to real GDP this quarter having been a drag in the previous period.

They talk about the ‘portfolio balance channel’ meaning investors shifting to ‘riskier assets’ due to QE, etc. But at the macro level, it’s about the total ‘risky assets’ available, and it looks like the growth rate is declining:
er-9-18-4
No sign of a burst in issuance here:
er-9-18-5
er-9-18-6
er-9-18-7

Housing Starts
er-9-18-8

Highlights
Housing starts fell back in August but not permits which gained and point to strength for starts ahead. Starts fell 3.0 percent in the month to a lower-than-expected 1.126 million annual pace while permits rose 3.5 percent to a higher-than-expected 1.170 million. Starts for single-family homes, like the headline for starts, also fell 3.0 percent in August but follow a 10.9 percent surge in July. Permits for single-family homes rose 2.8 percent in the latest month to 699,000 which is the highest since 2008.

Housing under construction is also at a 2008 high, at 920,000 vs 908,000 in July. But completions were down in the month, from July’s 966,000 pace to a still healthy 935,000.

By region, starts data show increasing strength for the South which is by far the largest region, up 7.1 percent in the month. Permits in the South rose 2.4 percent for a 10 percent year-on-year gain. Permits in the West are the strongest of any region, up 9.6 percent in the month for a year-on-year rate surge of 36 percent.

Revisions to July were mixed with starts revised lower but permits higher. On net, this report is another positive for housing which is proving to be a key sector for the 2015 economy.
er-9-18-9

Steady progress but still depressed and still well below the lows of the 2001 recession:
er-9-18-10

Too soon to tell if the prior spike will be followed by a more serious collapse:
er-9-18-11

Philadelphia Fed Business Outlook Survey
er-9-18-12

Highlights
There may very well be something wrong with the manufacturing sector, at least in the Northeast where the Empire State index has been in deep negative ground for the last two months followed now by a minus 6.0 headline for the Philly Fed index. This is the first negative reading since February 2014.

But the headlines for both of these reports, which are not composite scores of separate components, are sentiment scores of sorts, rough month-to-month assessments of general conditions. A key positive in today’s is continued strength in new orders which rose 3.6 points to 9.4. Unfilled orders, nevertheless, have been trending into contraction, at minus 6.6 for the third straight negative reading.

But some details are very strong with shipments at plus 14.8 and employment at plus 10.2 for a 5-month high. In a negative signal also seen in the Empire State report, prices received, that is prices for final goods, is in contraction at minus 5.0.

The Fed is wondering whether global volatility and stock market losses are affecting consumer confidence. Early data this month from regional Feds suggest the effects may also be extending to business sentiment.
er-9-18-13

Rail Week Ending 12 September 2015: Tremendous Unimprovement After Previous Week’s Improvement

Sept 17 (Econintersect) — Week 36 of 2015 shows same week total rail traffic (from same week one year ago) collapsed according to the Association of American Railroads (AAR) traffic data. Intermodal traffic significantly declined year-over-year, which accounts for approximately half of movements. and weekly railcar counts continued in contraction. It could be that the data last week was screwed up – and the data this week was an adjustment.

And so how good can the US economy be if the Fed thinks the appropriate fed funds rate is still near 0%?

;)

Autos and export related anecdotes, Atlanta Fed GDP forecast

This is consistent with the US production and inventory numbers.

While the total vehicle sales rate was up a bit, the gains seem to be entirely in imported vehicles:
er-9-17-1
er-9-17-2
er-9-17-3
er-9-17-4
More anecdotal evidence of export softness:
er-9-17-5

August 2015 Sea Container Exports Still Lagging

By Steven Hansen

The data for this series continues to be less than spectacular – but imports improved this month while exports degraded. The year-to-date volumes are contracting for exports but imports are now in the green.

This continues to indicate weak economic conditions domestically and globally. Consider that imports final sales are added to GDP usually several months after import – while the import cost itself is subtracted from GDP in the month of import. Export final sales occur around the date of export. Container counts do not include bulk commodities such as oil or autos which are not shipped in containers.

Japan : Merchandise Trade
er-9-17-6
Highlights
August’s merchandise trade deficit was a greater than anticipated ¥569.7 billion, much larger than July’s revised deficit of ¥268.4 billion. It was the fifth consecutive month that balance was negative. On the year, exports were up 3.1 percent while imports retreated 3.1 percent. Expectations were for an increase of 4 percent for exports and a decline of 2.2 percent for imports.

Exports to Asia were up 1.1 percent for the sixth straight increase. However, exports to China sank 4.6 percent for the first decline in six months. Exports to the EU slipped 0.2 percent for the first drop in nine months. Exports to the U.S. jumped 11.1 percent for the 12 straight increase.

er-9-17-7

Empire State, Industrial Production, Business Inventories, Retail Sales

Ugly:

Empire State Mfg Survey
er-9-15-1
Highlights
The shocking weakness in August was no fluke as the Empire State index came in far below expectations for September, at minus 14.67. Next only to August’s minus 14.92, September’s reading is the weakest of the recovery, since April 2009. And, unfortunately, judging by new orders, activity in October may prove to be just as weak. New orders are deeply negative this month, at minus 12.91 vs minus 15.70 in August and the fourth straight negative reading. And manufacturers in the New York region won’t be able to turn to backlogs which are extending their long run of contraction at minus 8.25.

Searching for positives in this report is difficult. Negative signs sweep components including shipments, at minus 7.98 following August’s minus 13.79. If extended to national data, these results point to trouble for third-quarter GDP. Employment is at minus 6.19 which is the first negative reading since all the way back in January 2013. The workweek, reflecting the weakness in shipments, is down very steeply at minus 10.31. Price data show outright contraction for finished goods at minus 5.15 — the first negative reading since November 2013. And rounding things out is a 10 point loss in the 6-month outlook to 23.21 which is the weakest since, once again, January 2013.

The negative signals from this report from August were not confirmed by other regional indications but could be confirmed as early as this morning with the August industrial production report. Strength in the auto sector gave manufacturing a lift in June and July but this lift, given weakness in foreign markets and the energy sector, may not have extended too far, at least based on this report.
er-9-15-2

Bad here too, as excess prior inventory building led to production cuts:

Industrial Production
er-9-15-3
Highlights
A reversal in the auto sector pulled down industrial production in August, falling 0.4 percent vs the Econoday consensus for a 0.2 percent decline. The manufacturing component fell 0.5 percent, also deeper than the consensus at minus 0.3 percent. In an offset, gains in July proved more robust than initially reported with total industrial production revised 3 tenths higher to plus 0.9 percent and manufacturing revised 1 tenth higher, now also at plus 0.9 percent.

Motor vehicle production is August’s disappointment, down 6.4 percent following July’s giant 10.6 percent spike. When excluding motor vehicle production, however, industrial production was unchanged in August following respectable gains of 0.3 percent in the prior two months. But these readings are far from spectacular and the weakness in the latest month could be a signal of retrenchment tied to Chinese-based volatility.

Turning to the report’s other two components, utility production rose 0.6 percent in August with mining at minus 0.6 percent. Mining, hit by weak commodity prices, has been hurting all year with the year-on-year reading at minus 3.2 percent. Utilities, however, are up 3.2 percent year-on-year which leads the major components as manufacturing’s year-on-year rate is a soft looking plus 1.4 percent. Total industrial production is up only 0.9 percent year-on-year.

This weakness is reflected in capacity utilization which is at 77.6 percent in the August report, down 4 tenths in the month and 2 tenths lower than consensus. Manufacturing utilization is at a soft 75.8 percent vs an unrevised 76.2 percent in July.

The vehicle-led burst in the manufacturing sector faded noticeably by summer’s end, a reminder that foreign demand for U.S. goods is weak and that the domestic energy sector is suffering. The consumer is the lead horse for the economy, making up for factory slack that the doves are certain to cite at this week’s FOMC.
er-9-15-4

The inventory build was small, but weak sales kept inventory to sales ratio too high.

Note the July inventory build in autos led to the August cutback in production just reported:

Business Inventories
er-9-15-5
Highlights
The nation’s inventories remain slightly on the heavy side, up an as-expected 0.1 percent in July vs a 0.1 percent gain in sales that leaves the stock-to-sales ratio at 1.36, substantially higher than 1.29 a year ago.

Retail inventories rose 0.6 percent in July with the build, however, centered in vehicles which is positive given the strength, evident in this morning’s retail sales report, of strong consumer demand for vehicles. Excluding vehicles, retail inventories rose a manageable 0.2 percent. Building materials rose 0.6 percent which may be a problem given weakness for this component in the August retail sales report. The stock-to-sales ratio for retail is unchanged at 1.46.
er-9-15-6

I don’t see this as good news:

Retail Sales
er-9-15-7
Highlights
For a second report in a row, upward revisions highlight solid growth in retail sales. Retail sales rose 0.2 percent in August with ex-auto at plus 0.1 percent and ex-auto ex-gas at plus 0.3 percent. These are all 1 tenth below consensus. July, however, shows broad upward revisions with total sales at a very strong plus 0.7 percent vs an initial plus 0.6 percent. Ex-auto for July is revised upward by 2 tenths to plus 0.6 percent and ex-auto ex-gas revised upward by 3 tenths to plus 0.7 percent.

Turning first to strength in the August data, motor vehicles rose 0.7 percent on top of July’s 1.4 percent gain. These are very solid readings for a very important component that points squarely at a healthy and confident consumer. Restaurants, another component tied to discretionary health, rose a very strong 0.7 percent to extend a run of gains. On the weak side are gasoline stations where, due to lower gas prices, sales fell 1.8 percent. But this decline actually underscores one of the reasons behind the consumer’s health unlike, however, declines in building materials, down 1.8 percent, and furniture, down 0.9 percent. Yet both of these declines follow very strong gains in the prior month.

Taken together, July and August point to a very strong start to the third quarter for the consumer, a fact that plays into the hands of the hawks at this week’s FOMC. Still, the doves can argue that slowing in August could point to negative effects from China-based volatility.
er-9-15-8