Valance Weekly Economic Reports: Global News Highlights

Same twin themes taking hold – weakness and inflation.

Highlights:
US Mixed data
EU Softening data could change ECB’s inflation rhetoric
JN CPI Higher on food, energy prices; Mixed data continues
UK Housing Market Continued To Show Weakness
AU Businesses Less Confident About Q1 economic outlook

♥

GDP/ADP

From Karim:

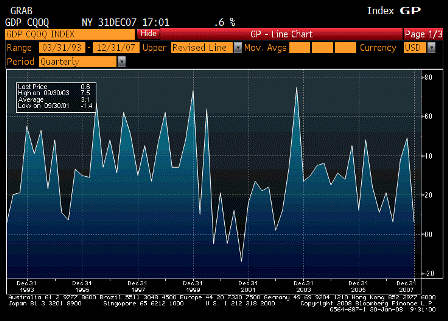
  • GDP slows from 4.9% to 0.6%
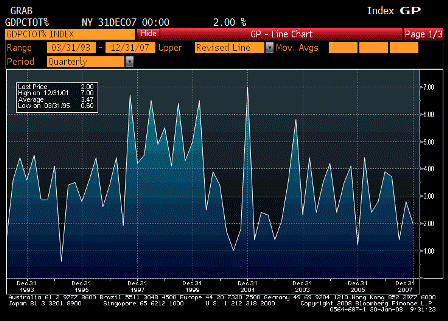
  • Personal consumption slows from 2.8% to 2.5%
  • DGO strength in Dec shows up in modest positive in equipment and software (+3.8%)
  • Residential FI (housing) down 23.9%
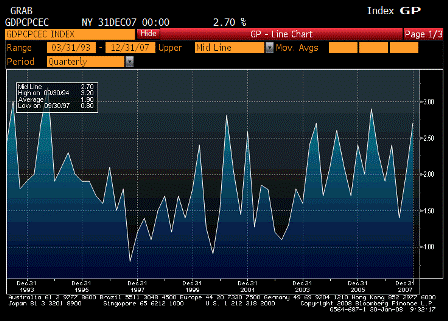
  • Core PCE up 2.7% annualized for quarter and 2.1% y/y
  • Net exports add 0.4% to gwth
  • Inventories a drag by 1.25%
  • Inventory/shipment ratio still at recent highs, so unlikely that inventory drag is over yet
  • ADP gain of 130k signals upside risk to consensus 65k advance in nfp; while usually reliable, adp has also had some spectacular misses
  • In light of decline in jobs hard to get component of conference board survey and adp, will call for 90k gain in nfp Friday.
  • Pretty long period between jan and march fed meetings (next meeting march 21). So by next meeting, will have 2 nfp reports to look at as well as decent idea on Q1 gwth. Bernanke testimony likely on 2/27.

♥

2008-01-30 US Economic Releases

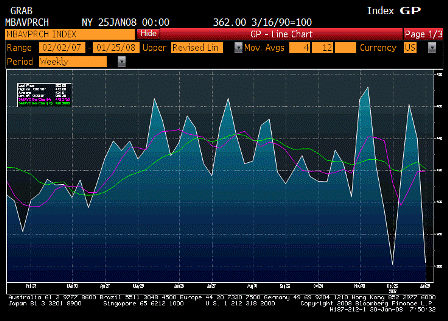
2008-01-30 MBAVPRCH + 4 Wk Ave + 12 Wk Ave

MBAVPRCH Index + 4 Wk Ave + 12 Wk Ave

From Karim:
very volatile series-see chart-white line is purchase index-purple line is 4wk avg and green line is 12wk avg-latter is probably best indicator of trend and looks like still heading lower. Of course this series also reflects multiple applications for same home purchase, which is more likely over the past few months in light of tighter standards for many borrowers, so probably have to adjust for that compared to same series a year ago.


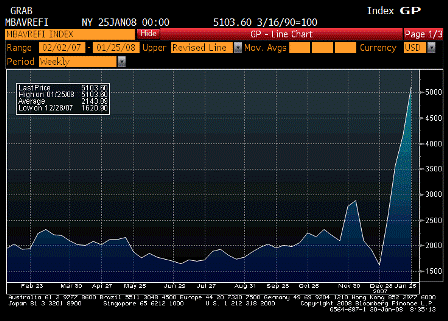
2008-01-30 MBAVREFI

MBA Refinancing Index (Jane 25)

Survey n/a
Actual 5103.6
Prior 4178.2
Revised n/a

Refi index positive for ‘market functioning’, but purchase index could be softening.

As before, winter housing numbers are volatile.


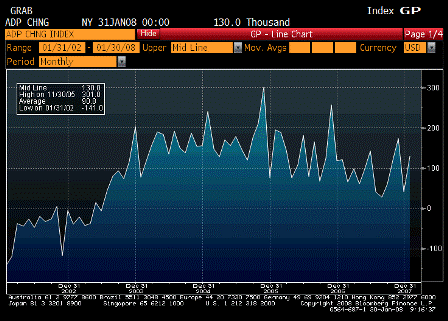
2008-01-30 ADP Employment Change

ADP Employment Change (Jan)

Survey 40K
Actual 130K
Prior 40K
Revised 37K

Not the stuff of recession. While not a reliable predictor of Friday’s payroll report, it is a ‘real’ number as it’s ADP’s report of 392,000 business it services.


2008-01-30 GDP Annualized

GDP Annualized (4Q A)

Survey 1.2%
Actual 0.6%
Prior 4.9%
Revised n/a

Lower than expected but still positive, consumer up 2% which is far from recession, and final sales for domestic purchases were up 1.4%, and the Dec export number won’t be reported until Feb 14. The durable goods number yesterday may portend a higher than estimated export number for the next Q4 GDP revised report. Inventories were burned off by 1.25% of GDP, which is also generally not indicative of recession.


2008-01-30 Personal Consumption

Personal Consumption (4Q A)

Survey 2.6%
Actual 2.0%
Prior 2.8%
Revised n/a

Down but not terrible, and not the stuff of recession


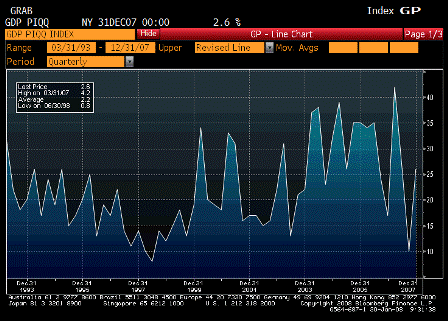
2008-01-30 GDP Price Index

GDP Price Index (4Q A)

Survey 2.6%
Actual 2.6%
Prior 1.0%
Revised n/a

Not good.


2008-01-30 Core PCE QoQ

Core PCE QoQ (4Q A)

Survey 2.5%
Actual 2.7%
Prior 2.0%
Revised n/a

Very troubling to the Fed. Mainstream theory says you can’t let core elevate. The cost to bring it down is much higher than any possible losses due to near term weakness caused by keeping rates high.


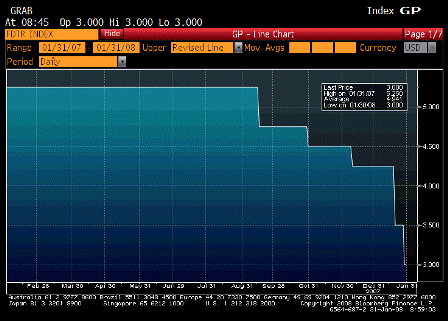
2008-01-30 FOMC Rate Decision

FOMC Rate Decision (Jan 30)

Survey 3.0%
Actual 3.0%
Prior 3.5%
Revised n/a

♥

U.K. mortgage approvals drop to least since 1999

U.K. Mortgage Approvals Drop to Least Since 1999

By Jennifer Ryan

(Bloomberg) U.K. mortgage approvals dropped in December to the lowest in at least nine years, and consumer credit fell, threatening the outlook for economic growth.

Lenders granted 73,000 loans for house purchase, down from 81,000 in November and the least since records began in January 1999, the Bank of England said in London today. The median forecast in a Bloomberg News survey of 24 economists was 79,000. Lending on personal loans and overdrafts fell to 265 million pounds ($530 million), the least in 15 years.

Banks are tightening credit standards after contagion from the U.S. subprime mortgage market collapse, the Financial Services Authority said yesterday. Less access to credit for Britons with record debt may further slow consumer spending and a weakening housing market, adding to the case for an interest rate reduction by the Bank of England as soon as next week.

“The household sector was clearly under some kind of pressure at the end of 2007,” James Shugg, an economist at Westpac Banking Corp. in London, said in an interview on Bloomberg Television. “The U.K. housing market is embarking on a much slower growth period.” He predicted further interest rate reductions after a quarter-point cut last month.

In a separate statement, Prime Minister Gordon Brown reappointed central bank Governor Mervyn King to serve another five-year term. King accepted the position, saying in a statement that he looks “forward to working hard with my bank and MPC colleagues on the economic and financial challenges that face us all.”

Consumer Credit
The central bank’s report today showed consumers borrowed less on unsecured credit as they faced repaying a record 1.4 trillion pounds in debt and banks curbed lending to them. Net consumer credit fell to 557 million pounds in December, less than half the previous month’s total.

“A significant minority of consumers could experience financial problems because of their high levels of borrowing,” the FSA, the U.K.’s financial regulator, said in its risk outlook report yesterday. “A growing number of consumers are likely to experience debt repayment problems in 2008.”

The average cost for a fixed-rate mortgage maturing in the next 12 months and switching to a variable rate will rise by about 210 pounds per month, creating a “serious impact on the affordability of the loan,” the FSA said. The increase will affect about 1.4 million home loans.

Subprime Losses
Britons face higher home loan costs after banks around the world posted at least $133 billion in losses from the collapse of the U.S. subprime mortgage market.

The average rate offered by lenders on a mortgage for 95 percent of the price of a property, fixed for 24 months, rose to 6.53 percent in December from 6.44 percent, the central bank said Jan. 10. The central bank’s credit conditions survey showed banks plan to limit access to all debt in the first quarter.

“There is a risk that some consumers could find it difficult to meet their credit commitments due to tighter lending standards for both secured and unsecured credit,” the FSA said.

All 30 economists in a Bloomberg News survey forecast the Bank of England will cut interest rates a quarter point to 5.25 percent on Feb. 7 as growth slows and the housing market stalls.

U.K. retail sales rose at the slowest pace in 14 months in January, the Confederation of British Industry said yesterday.

House prices fell for a fourth month in January, Hometrack Ltd. said Jan. 28. U.K. real estate professionals said December was the worst month for the housing market since the aftermath of Britain’s last recession in 1992, according to a Jan. 16. report by the Royal Institution of Chartered Surveyors.


♥

FOMC preview

My guess is the GDP forecast the Fed is now getting from it’s staff is not a downgrade from previous forecasts, and may even be an upgrade due to:

  • The blowout durable goods numbers
  • The drops in claims following the high unemployment number
  • The private forecasts on average show 65,000 new jobs and unemployment falling to 4.9 on Friday
  • Anecdotal reports from big cap old line corps show no recession in sight
  • But still data dependent with ADP, GDP, and deflator tomorrow am

Yes, it has been about domestic demand, but they now realize exports have taken up the slack and are holding up employment and real gdp, as well as contributing to inflation.

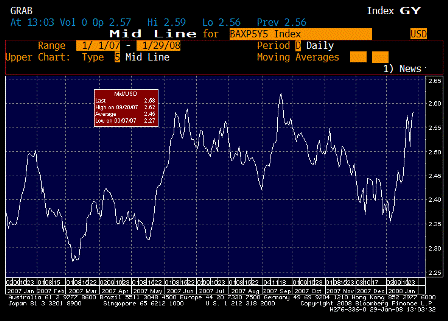
Staff inflation report will show deterioration of both headline CPI and core measures, along with tips fwd breakevens moving higher and survey info showing elevating prices paid and received. And food/fuel/import and export prices all trending higher, risking core converging to headline CPI.

Higher crude prices are now attributed to higher US demand by the markets and the Fed.

Many ‘financial conditions’ have eased:

  • LIBOR has come down over 150 bp since the Dec 18 meeting even as FF are down only 75. mtg rates way down as well, and at very low levels.
  • Commercial mortgage rates somewhat higher, but from very low levels previously
  • Equities have firmed up since the soc gen liquidations (and look very cheap to me)

The last bit of system risk is from a downgrade of the monolines and that risk seems to be diminishing.

The ratings agencies have been reviewing them intensely for 6 months, and both the capital of the monolines and the credit quality of the insured bonds must still be adequate for the AAA rating. And in any case the risk is to go to AA, not to junk, meaning that credit per se isn’t the issue at all. The issue is forced selling by those who can’t legally hold insured bonds if the rating drops. That’s a very different issue.

Wouldn’t surprise me that if tomorrows numbers are as expected, and the fed cuts 50, markets start to look at that as possibly the last move, and reprice accordingly, with FF futures trading closer to a 3% trough than a 2% trough.

An unchanged decision may also result in a near 3% FF futures trough, with a couple of 25 cuts priced in.


♥

ISM revised upward

Seems most of Q4 was revised up, and Q3 as well.

TABLE-U.S. ISM non-manufacturing index revised to 54.4 in Dec

(Reuters) The Institute for Supply Management on Tuesday released annual seasonal adjustments to some of its monthly non-manufacturing indexes.

REVISIONS
Dec Nov Oct Sept Aug July June May Apr Mar Feb Jan
Bus Activity 54.4 54.6 55.5 55.7 56.3 55.9 59.7 58.4 56 53 54.9 57.9
New Orders 53.9 52 55.4 53.9 55.8 53.1 56.7 56.7 54.7 54.2 55.2 55.6
Employment 51.8 51.4 52.4 52.5 48.6 51.9 53.5 53.5 51.9 51.3 52.1 52.9
Prices Index 71.5 73.7 66.1 65 60.1 63.1 65.6 64.3 63.2 62.9 53.9 56.1
PRIOR FIGURES
Dec Nov Oct Sept Aug July June May Apr Mar Feb Jan
Bus Activity 53.9 54.1 55.8 54.8 55.8 55.8 60.7 59.7 56 52.4 54.3 59
New Orders 53.5 51.1 55.7 53.4 57 52.8 56.9 57.4 55.5 53.8 54.8 55.4
Employment 52.1 50.8 51.8 52.7 47.9 51.7 55 54.9 51.9 50.8 52.2 51.7
Prices Index 72.7 76.5 63.5 66.1 58.6 61.3 65.5 66.4 63.5 63.3 53.8 55.2

♥

2008-01-29 US Economic Releases

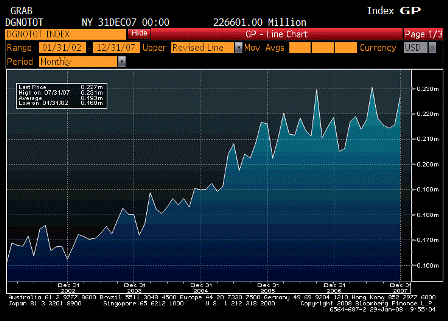
2008-01-29 Durable Goods Orders Total

Durable Goods Orders Total (Dec)

Survey n/a
Actual 226,601
Prior 215,433
Revised n/a

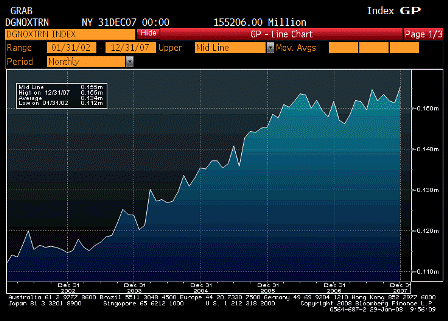
2008-01-29 Durables Ex Transporation Total

Durables Ex Transportation Total (Dec)

Survey n/a
Actual 155,206
Prior 151,303
Revised n/a

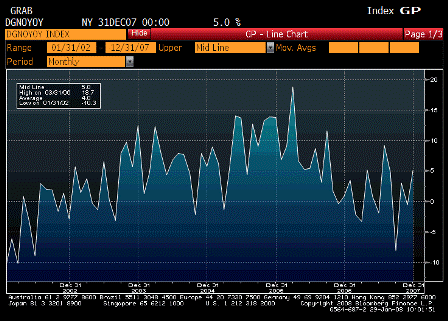
2008-01-29 Durable Goods YoY % Change

Durable Goods YoY % Change

Survey n/a
Actual 5.0%
Prior -0.6%
Revised n/a

Doesn’t look much like recession to me. November revised up to where last month’s number might have changed impressions as well.

This also increases the chances that the December employment number gets revised up this Friday, along with a lower unemployment number for January.

From Karim:

The 5.2% rise in DGO is a bit of a mixed bag
–81% rise in aircraft orders (likely to help exports)
–ex-aircraft and defense still up 4.4%;

Yes, that’s what an export economy looks like.

but looks like making up for lost ground as 3mth trend (annualized) falls from -1.2% to -2.8%
–more troubling is shown in chart attached; inventory/shipments ratio threatening multi-year highs (inverted on chart); suggests more downside for industrial production in period ahead

Or it could mean larger shipments being readied.

Unfilled orders up 2.5% month over month; up 18.5% year over year,

Johnson-Redbook and ICSC chain store sales reflect weak January; sales about flat to December.

Yes, that’s what an export economy looks like. Decent employment but weaker domestic real consumption, as more of the output gets shipped abroad rather than getting consumed domestically.

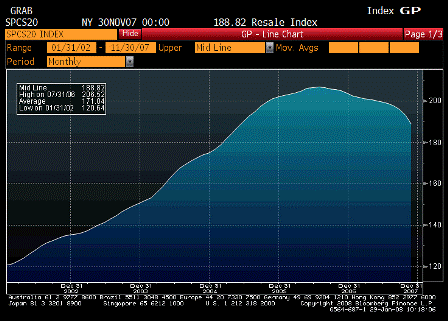
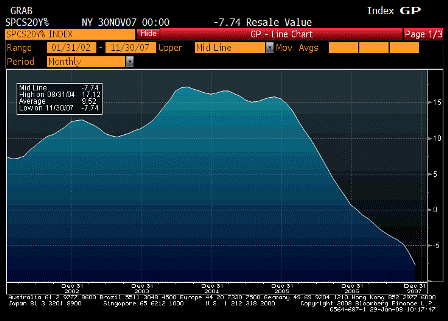
Case-Shiller Index falls from -6.07% y/y to -7.74% y/y. 10 largest metro-areas fall from -6.67% to -8.42% y/y.

Yes, a November number. Real estate in largest areas was still falling back then.

2008-01-29 S&P/CS Composite-20 YoY

S&P/CS Composite-20 YoY (Nov)

Survey -7.1%
Actual -7.7%
Prior -6.1%
Revised n/a

2008-01-29 S&P/CS Home Price Index

S&P/CS Home Price Index (Nov)

Survey n/a
Actual 188.8
Prior 192.9
Revised 192.9

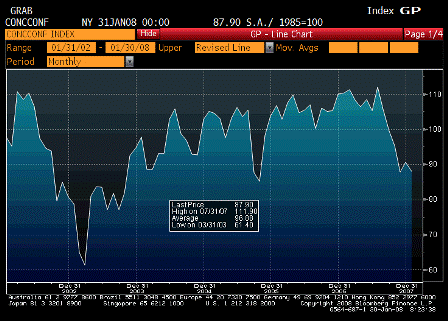
2008-01-29 Consumer Confidence

Consumer Confidence (Jan)

Survey 87.0
Actual 87.9
Prior 88.6
Revised 90.6

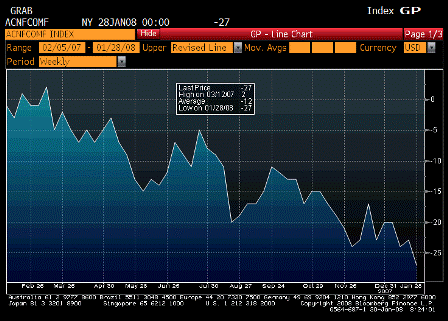
2008-01-29 ABC Consumer Confidence

ABC Consumer Confidence (Jan)

Survey -24
Actual -27
Prior -23
Revised n/a

Still looking weak. But with CNBC turning more positive on the economy, this might turn up soon.