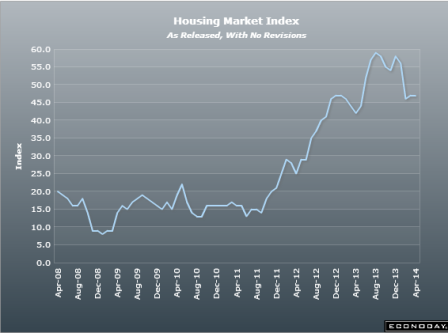
Recalls my suspicion of the Bernanke legacy- “just as the recovery was gaining traction he let mtg rates rise and cratered the housing market, etc.”
Full size image
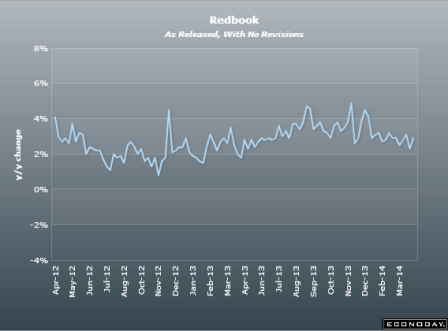
Y/Y:
Full size image
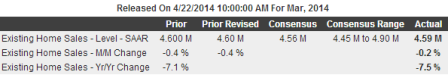
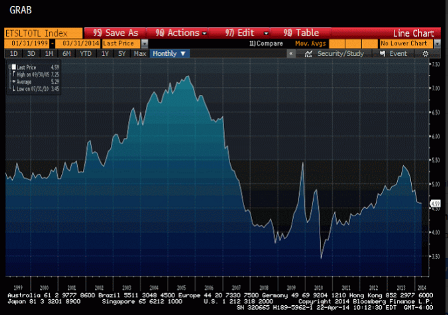
Existing Home Sales
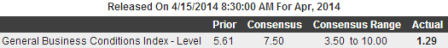
Highlights
Sales of existing homes have yet to recover from the Federal Reserve’s decision, way back last year, to begin withdrawing stimulus. For the seventh time in eight month, sales of existing homes contracted, at minus -0.2 percent in March to a slightly lower-than-expected annual rate of 4.59 million. Year-on-year, sales are down 7.5 percent which is the steepest rate of contraction since May 2011.Unattractive mortgage rates are only one reason for the sales weakness. Another is high prices which, in stark contrast to the contraction in sales, are up, not down, 7.9 percent year-on-year. The median price soared in March, up 5.4 percent to $198,000.
Low supply is another reason for the sales trouble, though the weakness in sales during March did lift supply relative to sales slightly, at 5.2 months vs 5.0 months in February.
Regional data show March weakness in the South and West and monthly strength in the Northeast and Midwest. Year-on-year, all four regions show declines.
The housing sector remains the weak link in the economy and the weather isn’t to blame, at least not in March. The Dow is showing little initial reaction to today’s results.