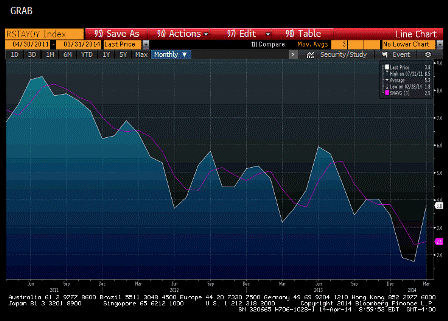
Headline retail sales y/y with 3 mma:

Full size image
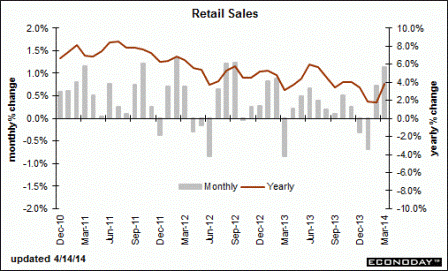
3 month moving average nudged up to 2.5% which is a relished move as sales catch up from losses due to weather. But it’s going to take more months like this one to reverse what looks like a longer term trend towards lower levels.
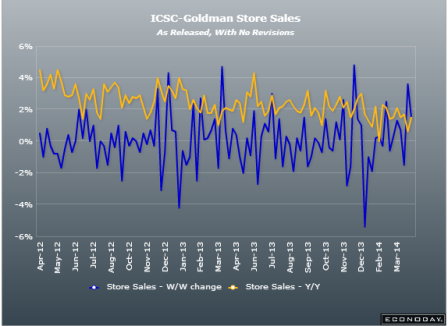
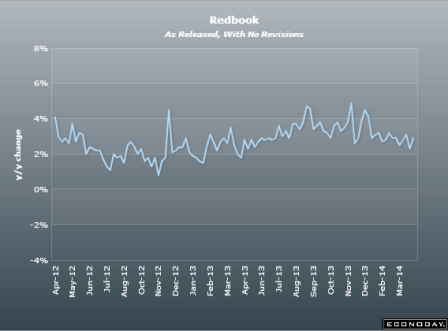
Note however that Red Book and Goldman retail sales reports, though ‘minor’ indicators, haven’t shown much strength.
You can see the dip and recovery of the monthly prints on this graph:


