charts and comments GDP, durables, mtg apps, etc.

>   
>   On Wed, Jun 25, 2014 at 8:52 AM, Sheraz wrote:
>   
>   Very weak US numbers
>   

And not one ‘nice call’ email!!!

And yesterday’s stock market action suggests a possible data leak???
:(

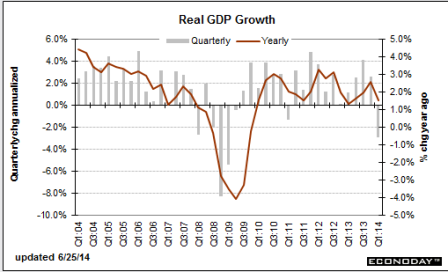
US 1Q GDP has been revised lower by far than expected. After having initially been reported as a 0.1% rise, then a 1% contraction, the third release shows that GDP growth is now reported as -2.9 QoQ% annualised, which leaves annual growth at just 1.5%YoY.


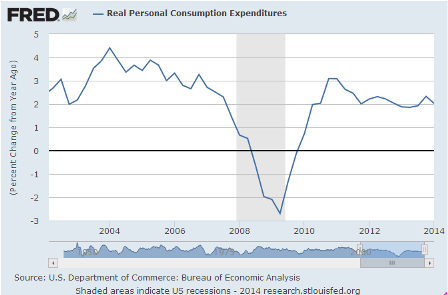
The consensus expectation was for a -1.8% reading. The damage was largely done through the private consumption component, which is now reported as rising just 1% versus 3.1% previously.

Also ‘smoothing’ from numbers that looked high to me in H2 and an adjustment to ACA related healthcare expenses previously booked as PCE:


Full size image

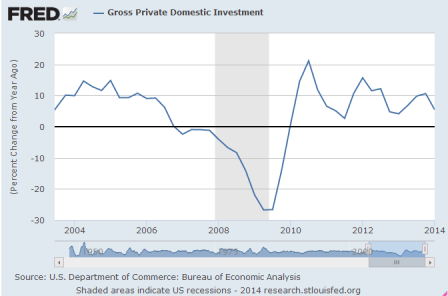
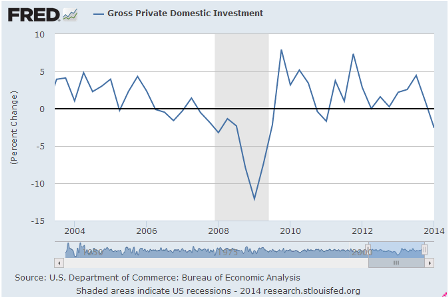
Gross private investment remained an 11.7% contraction

Maybe after a Q4 surge due to expiring tax credits?


Full size image


Full size image

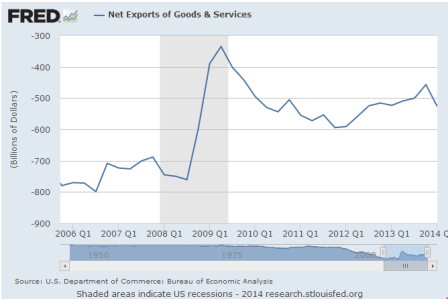
while government consumption was left at -0.8%. However, exports were revised down and imports revised up meaning that the contribution from net trade is to subtract 1.5% from GDP growth rather than 0.95% as previously announced.

Reversing a similar, prior blip up, as previously discussed:


Full size image

Nonetheless, reaction should be fairly muted given widespread expectations of a sharp bounceback in 2Q14 and the fact that the weather had such a damaging impact on 1Q activity. Indeed, we suspect that we could see GDP rise by more than 5% annualised in 2Q.

And if so, H1 would be +1% :(

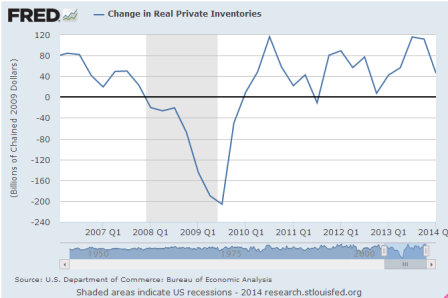
High frequency numbers for the quarter have looked good while inventories should also make a significantly positive contribution after having been run down sharply.

After having been run up in H2. We’ll see where they go from here.

And, as previously discussed after the jump up in Q3, inventory accumulation seldom leads a boom:


Full size image

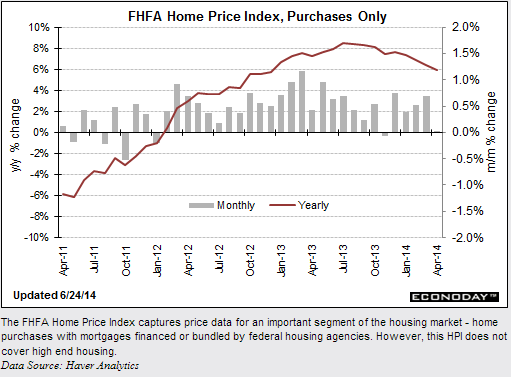
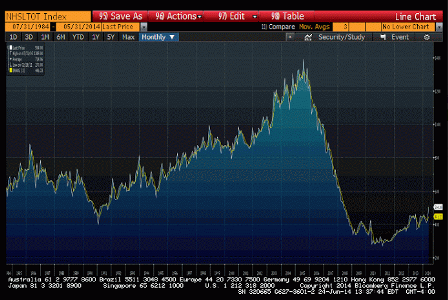
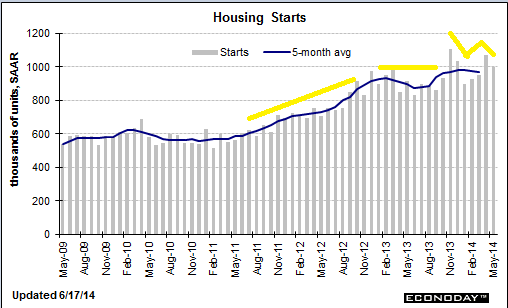
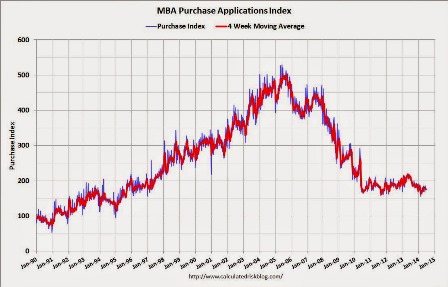
Mortgage purchase apps still dismal:

According to the MBA, the unadjusted purchase index is down about 18% from a year ago.


Full size image

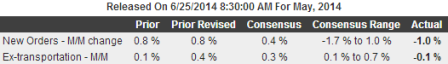
And May durables not so good either:

Highlights
Durables orders were much weaker than expected for May. Durables orders fell 1.0 percent in May after rising 0.8 percent in April. Analysts forecast 0.4 percent. Excluding transportation, orders slipped 0.1 percent, following a 0.4 percent gain in April. Market expectations were for 0.3 percent.

Transportation fell 3.0 percent after a 1.7 percent rise in April. The latest dip was from weakness in nondefense aircraft. Motor vehicles and defense aircraft orders rose.

Outside of transportation, gains were seen in primary metals, fabricated metals, and “other.” Declines were posted for machinery, computers & electronics, and electrical equipment.

On a positive note, there was improvement in equipment investment. Nondefense capital goods orders excluding aircraft rebounded 0.7 percent in May after decreasing 1.1 percent the month before. Shipments of this series rebounded 0.4 percent after a 0.4 percent dip in April.

The good news is this series is muddling along ok:
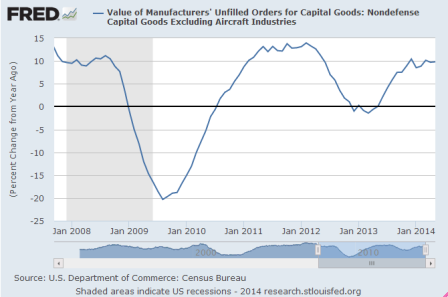

Full size image

The latest durables report is in contrast to recently positive regional manufacturing surveys and also the sharp jump in manufacturing production worker hours of 0.8 percent for May. But durables data are very volatile and we likely need a couple of more months of data before taking a negative tone on this sector.

The next leg to fall may be employment, as the 1.2 million people who lost long term benefits at year end may have been taking menial jobs at the rate of maybe 75,000/month or more for 6 months or so, which may have front loaded the monthly jobs numbers. If so, monthly job gains may fall into the 100,000 range soon.

So in general it was down for the winter, back up some, and we’ll see what happens next.

The ‘survey’ numbers and professional forecasts look promising, however it still looks to me like we are under the macro constraint of a too low govt deficit that’s struggling to keep up with the unspent income/demand leakages, with scant evidence of help from growth in private credit expansion.

And I tend to agree with Fed Chair Yellen here, which would tend to keep rates lower/longer if she gets her way. However I don’t agree that low rates somehow support aggregate demand, so I don’t see the likelihood of any call from the Fed or other forecasters for the fiscal relaxation I’ve been proposing.

Yellen may be poised to rewrite Fed’s rule book on wages, inflation

June 25 (Reuters) — “My own expectation is that, as the labor market begins to tighten, we will see wage growth pick up some to the point where … nominal wages are rising more rapidly than inflation, so households are getting a real increase in their take home pay,” Federal Reserve Chair Janet Yellen said last week, adding: “If we were to fail to see that, frankly, I would worry about downside risk to consumer spending.” Over the last year Fed staff changed their main model for forecasting wage and price inflation to reflect evidence that companies were adjusting prices more slowly than in prior years.

My immediate proposals remain 1) A full FICA suspension, which raises take home pay by 7.6%, and, for businesses that are competitive, lowers prices as well, restoring sales/output/employment in short order 2) A $10/hr federally funded transition job for anyone willing and able to work to promote the transition from unemployment to private sector employment 3) A permanent 0 rate policy with Tsy issuance limited to 3 mo bills. 4) Unrestricted campaign contributions, however, say, 40% of any contribution goes to the opposition…

May business borrowing and confidence drops, and other charts from recent releases

U.S. business borrowing for equipment falls 8 percent in May: ELFA

By Abinaya Vijayaraghavan

June 23 (Reuters) — U.S. companies’ borrowing to spend on capital investment fell in May, the Equipment Leasing and Finance Association (ELFA) said.

Companies signed up for $6.9 billion in new loans, leases and lines of credit last month, down 8 percent from a year earlier. Their borrowing fell 14 percent from April.

“The small decline in new business volume makes the case for a slow recovery in certain sectors of the economy in which equipment financing plays an important role,” ELFA Chief Executive William Sutton said in a statement.

Washington-based ELFA, a trade association that reports economic activity for the $827 billion equipment finance sector, said credit approvals totaled 76.1 percent in May, down from 77.4 percent in April.

ELFA’s leasing and finance index measures the volume of commercial equipment financed in the United States. It is designed to complement the U.S. Commerce Department’s durable goods orders report, which it typically precedes by a day.

ELFA’s index is based on a survey of 25 members that include Bank of America Corp(BAC.N), BB&T Corp (BBT.N), CIT Group Inc (CIT.N) and the financing affiliates or subsidiaries of Caterpillar Inc (CAT.N), Deere & Co (DE.N), Verizon Communications Inc(VZ.N), Siemens AG (SIEGn.DE), Canon Inc (7751.T) and Volvo AB (VOLVb.ST).

The Equipment Leasing & Finance Foundation, ELFA’s non-profit affiliate, said its confidence index fell to 61.4 in June from 65.4 in May.

A reading of above 50 indicates a positive outlook.

More evidence home price increases have slowed, as ‘liquidation supply shock’ that began in 2009 winds down:


Full size image

Also this morning the Census Bureau reported that new home sales were at a seasonally adjusted annual rate (SAAR) of 504 thousand in May. That is the highest level since May 2008. As usual, I don’t read too much into any one report. In fact, through May this year, sales were 196,000, Not seasonally adjusted (NSA) – only up 2% compared to the same period in 2013 – not much of an increase.

Richmond Fed Manufacturing Index

Highlights
Activity may be slowing this month in the Richmond Fed’s manufacturing district but not new orders. The headline index slowed 4 points to a reading of 3 with shipments and employment both slowing significantly. But the pace of new orders actually improved slightly, up 1 point to 4. The Richmond Fed has been showing less of a post-winter bounce than other regional reports, especially Empire State and Philly Fed.

New home sales up more than expected, but the 3 month average looks tame and in any case if they continue to drift higher at this the pace of the last couple of years it will only take another 15 or 20 years or so to get back to prior cycle levels. When we had a lot fewer people. And, like last month, revised down, it will be revised next month:


Full size image


Full size image

Redbook Sales monthly Y/Y:


Full size image

credit boom?

For what it’s worth- disputes latest ‘credit boom’ narrative

Evidence Shows Media Reports of Credit Card Spending Growth are Overhyped and Wrong

Consumer revolving credit has been in the news recently as the Fed’s data on consumer credit for April reportedly showed a record surge. However, we have more current data and it clearly shows that these reports are another case of hysterical media over reaction.

housing starts and other charts

Same pattern- down some for the winter, up some, then backing off some.

If this is in fact what’s happening, Q2 GDP could be up less than 3%, and 2014 sub 2%, or even sub 0, if the demand leakages are allowed to keep the upper hand and a fiscal adjustment isn’t made.

“The Business Roundtable survey showed chief executives forecast GDP growth of 2.3 percent in 2014, down from last quarter’s estimate of 2.4 percent for the year.”

“Federal Reserve Chair Janet Yellen said last month there was a risk a protracted housing slowdown could undermine the economy.”

Housing Starts

Highlights
Housing took a step back in May. Starts fell a monthly 6.5 percent but followed a strong 12.7 percent spike in April. The 1.001 million unit pace was up 9.4 percent on a year-ago basis and fell short of expected 1.036 million units.

Single-family starts dropped 5.9 percent after a 4.6 percent rise. Multifamily starts declined 7.6 percent, following a 29.2 percent spike in April.

Building permits followed a similar pattern, suggesting some moderation in construction. Permits fell 6.4 percent after a 5.9 percent rise in April. Permits posted at 0.991 million units and were down 1.9 percent on a year-ago basis. Analysts forecast 1.062 million units.

Builder was up some, but has remained below 50 for 5 months, and by historical standards remains dismal:


Full size image

Industrial production/manufacturing was up some yesterday, but it’s a relatively small part of the economy and seems to chug along at 3-4% annual growth rates.

“The core CPI was lifted by a 0.3 percent rise in rent. There were also increases in medical care costs, apparel, new cars prices and airline fares.”

This doesn’t read to me like an ‘excessive demand problem’ that higher rates would reverse. But that’s just me. I agree the Fed may think otherwise!

Size of income tax drop surprises U.S. states

This could be technical or a sign of trouble for the macro economy:

Size of income tax drop surprises U.S. states

June 12 (Reuters) — Personal income tax revenues in April were 15.8 percent, or $7.9 billion, below the same month in 2013, according to preliminary estimates from Rockefeller, a public policy research group at the State University of New York. From January through April income tax collections fell 7.1 percent from the same period in 2013, Rockefeller found. Out of the 38 states for which data is available 33 registered declines. Altogether 41 states collect personal income taxes. “While many states tried to be cautious in their forecasts, early figures indicate that income tax collections are below the forecasts in many states,” Rockefeller found.