NFIB

Nothing happening here.

Note from the chart that it’s still near the lows of prior cycles.

From the National Federation of Independent Business (NFIB): NFIB SBET Sees Slight Bump in August

August’s Optimism Index rose 0.4 points to 96.1 making it the second highest reading since October, 2007. …

NFIB owners increased employment by an average of 0.02 workers per firm in August (seasonally adjusted), the eleventh positive month in a row but basically a “zero” net gain. emphasis added

Hiring plans decreased to 10.


Full size image

Consumer credit up some due to 7 year car loans

Consumer Credit


Highlights
Retail sales may have been soft in July but consumers were definitely drawing on credit lines including a rare and very strong rise in credit card usage. Consumer credit jumped an outsized $26.0 billion in July on top of an upward revised $18.8 billion jump in June. But it’s revolving credit, the component where credit cards are tracked, that especially stands out in the report, up $5.4 billion vs a $1.8 billion gain in June. This component has been stubbornly flat throughout the recovery and further gains in future reports would mark a long-awaited upturn in consumer spirits.

The non-revolving component, as usual, is very strong, up $20.6 billion in July vs a $17.0 billion gain in June. But July’s gain, unlike prior gains, is centered entirely in vehicle financing, not the government’s acquisition of student loans from private lenders which contracted in the month.

This report offers a very strong positive signal for the consumer sector, a sector that has not been at the forefront of the economy. The Dow is moving slightly higher following today’s report.

Note how debt to income ratios jumped immediately after the FICA hike that kicked in Jan 2014:


And note how the growth rate is creeping up just like it did prior to the last recession, as the smaller deficit puts the squeeze on struggling consumers:

Student loan growth:

Fed’s consumer survey, employment slips as suspected

This implies we need a larger deficit than otherwise to close the output gap/sustain full employment, has higher income earners tend to generate more unspent income/more savings than lower income earners.

Looks to me like the “1.2 million who lost benefits at year and took menial jobs” narrative has run its course, and consequently H2 employment gains will be that much weaker than H1, as suggested earlier…
;)

ADP, productivity, trade, PMI services, Toll Bros. report

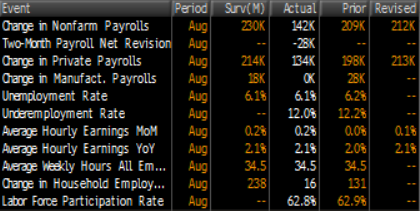
Maybe some evidence the 1.2 million who lost benefits at year end and took menial jobs phenomenon has run its course, and H2 will show substantially lower employment growth than H1?

When it was going up it was ‘accelerating’, so now it must be ‘decelerating’, right?

Hardly!

Mark Zandi, chief economist of Moody’s Analytics, said, “Steady as she goes in the job market. Businesses continue to hire at a solid pace. Job gains are broad based across industries and company sizes. At the current pace of job growth the economy will return to full employment by the end of 2016.”

Productivity and unit labor cost also figure into employment.

Higher unit labor costs and lower productivity can be a sign sales are falling and headcount is too high:

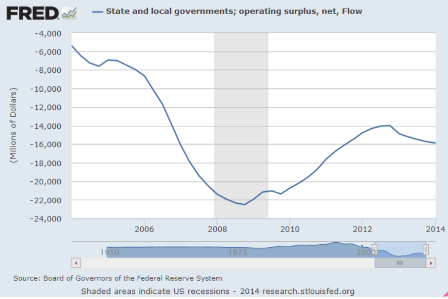
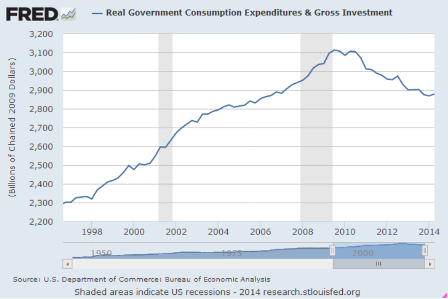
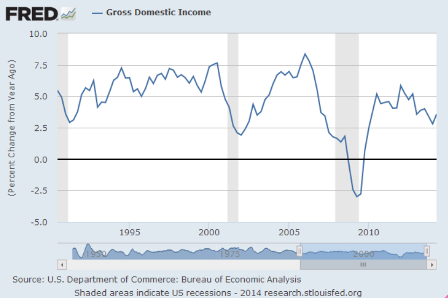
The current account continues to modestly narrow as a % of GDP, which supports GDP some but not a lot.

Not withstanding that it represents a reduction in real terms of trade/standard of living, of course.

International Trade


The trade deficit in July shrank marginally to $40.5 billion from $40.8 billion in June,

Exports rose 0.9 percent in July after no change the month before. Imports gained 0.7 percent, following a 1.1 percent drop in June.
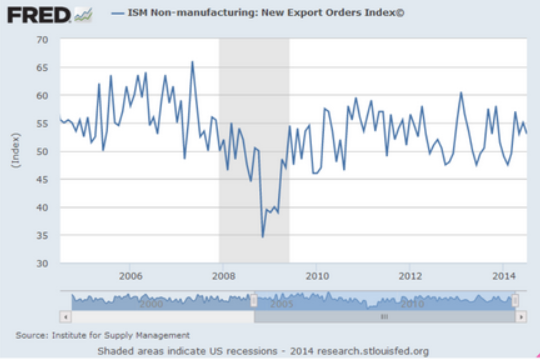
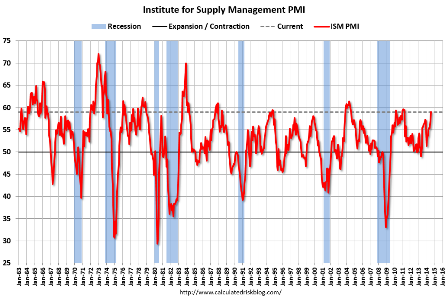
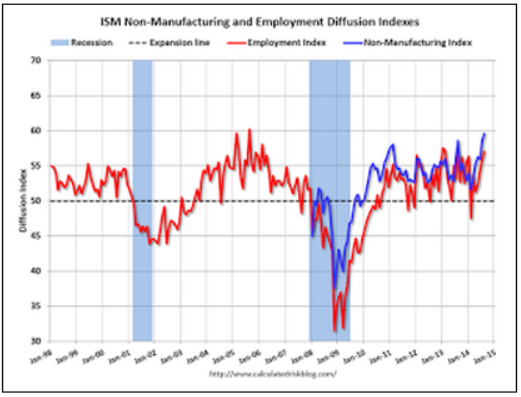
ISM Non-Mfg Index


Highlights
The ISM’s non-manufacturing sample is reporting extending acceleration in composite activity with the index rising 0.9 points to 59.6 from an already very strong 58.7 in July. The August reading is near the top end of the Econoday consensus.

The gain is led by the business index which rose 2.6 points to 65.0 in a reading that indicates exceptionally strong output. Employment is also a big plus, up 1.1 points to 57.1. This gain may offset to a small degree this morning’s weakness in ADP’s estimate for Friday’s jobs report.

One reading is not so positive and that’s new orders. Though coming in at 63.8, the rate of growth is down 1.1 points from July’s 64.9. Other readings include a slowing for supplier deliveries which is in line with the general rise in activity. Pressures on input prices slowed 3.2 points to 57.7 which is moderate for this reading.


Full size image

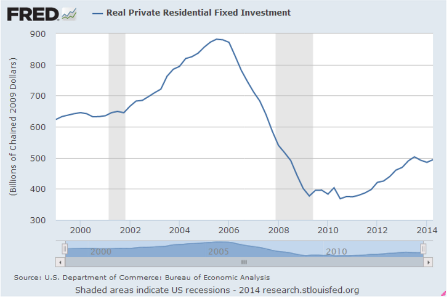
And this housing report:

Lawler on Toll Brothers: Net Home Orders Down, Price Gains Slow; Some “Lessening” in Pricing Power

From housing economist Tom Lawler: Toll Brothers: Net Home Orders Down, Price Gains on Orders Slows; Some “Lessening” in Pricing Power but No “Need” to Increase Incentives Much — Yet

Toll Brothers, the self-described “nation’s leading builder of luxury homes,” reported that net home orders in the quarter ended July 31, 2014 totaled 1,324, down 5.8% from the comparable quarter of 2013. Net orders per community last quarter were down 15.9% from the comparable quarter of 2013. The company average net order price last quarter was $717,000, up 1.4% from a year ago. Toll’s sales cancellation rate, expressed as a % of gross orders, was 6.6% last quarter, up from 4.6% in the comparable quarter of 2013. Home deliveries last quarter totaled 1,364, up 36.8% from the comparable quarter of 2013, at an average sales price of $732,000, up 12.4% from a year ago. The company’s order backlog at the end of July was 4,204, up 5.1% from last July, at an average order price of $737,300, up 4.1% from a year ago. The company controlled 49,037 home sites at the end of July, up 3.9% from last July and up 25.1% from two years ago.

For its “traditional” home building business (i.e., ex city living), net home orders totaled 1,281 last quarter, down 5.0% from the comparable quarter of 2014, at an average net order price of $700,500, up 3.4% from a year ago.

September govt rush to spend

I got this emailed to me. Makes sense.

Did US Macro Just Jump The Shark?


As in past years, this spike in activity is extrapolated by the smartest people in the room, leaving the reality to miss expectations for the rest of the year. A glance at the chart above might suggest, we just jumped the shark once more in US macro data for 2014…

* * *

As we concluded previously,

This begs the question: is the only reason why the economy tends to pick up momentum dramatically as the summer ends just a function of a surge in government spending permeating the broader economy as agencies scramble to spend all the money they have before the end of the September 30 Fiscal Year End (just so they get allocated the same or greater budget in the coming fiscal year), which subsequently plunges or is outright halted as the case may be right now?

If so, it would explain so much, and certainly why year after year, the US economy seems to pick up in the mid-to-late Q3 period, only to dramatically fade away in the coming months, as government spending goes from a waterfall to a trickle.


It would also put the government’s role in generating transitory periodic spikes in economic output under a microscope, especially since it is so clearly staggered to recur every September as one after another government agency spends like a drunken sailor. And if that is the case, how long until the BLS or some other agency (upon reopening of course) is taken to task to normalize not only for hedonic indicators and climate-related seasonal factors, but also for what is now clearly an annual aberration of economic output trends?

Car sales strong! Beige book soft

U.S. Light Vehicle Sales increase to 17.45 million annual rate in August, Highest since Jan 2006

By Bill McBride

Based on an WardsAuto estimate, light vehicle sales were at a 17.45 million SAAR in August. That is up 10% from August 2013, and up 6.4% from the 16.4 million annual sales rate last month.

This was well above the consensus forecast of 16.5 million SAAR (seasonally adjusted annual rate).


Full size image

Fed’s Beige book soft:

Fed’s Beige Book: Economic Activity Expanded, No “distinct shift in the overall pace of growth”

Posted in Fed

Today’s factory order charts

This doesn’t look like much of a recovery?

The export game is getting tougher as well:

Tech not so hot either:

Here’s the report:


Highlights
Skewed by Boeing orders at the Farnborough Airshow, factory orders surged 10.5 percent in July. Excluding transportation equipment, which includes both aircraft and vehicles, factory orders actually slipped, down 0.8 percent in the month.

But there are important positives in the report including a sharp 1.2 percent rise for shipments and a 1.4 percent rise for shipments of nondefense capital goods excluding aircraft. Unfilled orders show an unusually outsized gain of 5.4 percent while inventories, up only 0.1 percent, will need to be refilled. Another positive is an upward revision to June orders, now at a very strong 1.5 percent vs a prior reading of plus 1.1 percent.

Aircraft orders are the standout star of the July report and mustn’t be dismissed. These orders are long term but will eventually boost factory shipments and employment. Though orders outside aircraft were soft in July, the trend is still positive. Today’s report, together with yesterday’s exceptionally strong ISM report for August, point to third-quarter strength for the manufacturing sector.

Construction, gasoline prices, manufacturing, state and local contribution to gdp, restaurant performance index, saudi output, sun spots

Headlines sound a lot better than the charts look.

Absolute levels and growth rates continue to fall short of prior cycles:

Construction Spending


Highlights
Construction outlays saw a broad-based gain in July. Construction spending rebounded 1.8 percent after a 0.9 percent dip in June. While all broad categories advanced, July’s increase was led by the public sector-up 3.0 percent, following a 1.8 percent decrease in June. Private nonresidential spending rebounded 2.1 percent in July after slipping 0.8 percent the month before. Private residential outlays gained 0.7 percent, following a 0.4 percent dip in June.

On a year-ago basis, total outlays were up 8.2 percent in July, compared to 7.0 percent the month before.

Overall, the latest construction data add to third quarter momentum. Third quarter GDP estimates will likely be nudged up. There is a lot of recent volatility in construction data but the residential gain is encouraging.

Unadjusted Construction Spending – Three Month Rolling Average Compared to the Rolling Average One Year Ago


Full size image


Full size image


Full size image

This helps consumers some and also puts downward pressure on ‘inflation’:


Full size image

Manufacturing continues to do reasonably well, chugging along about the way it always does until the cycle ends:


Full size image

Don’t be misled by the talk of state and local govt contributing to GDP. The spending side is only half the story- they also tax. So you need to look at state and local govt deficits to get an idea of their net contribution:

This is the spending side:


Full size image

It’s a bit tricky as you don’t want to double count federal $ spent by the states:

Sure enough, tax receipts which tend to be highly cyclical, going up when the economy does better, seem to have stalled, and state and local deficits have gone up. So is that an indicator of growth?

And it looks like state and local deficits did go up a tad, but not a lot:

And this just came out:


Full size image

The call on Saudi oil shows no signs of diminishing which they remain as ‘swing producer/price setter’, setting price and letting quantity adjust with demand:


Full size image

And this:
;)


Full size image

today’s observations

Not much sign of any move towards higher deficits today. Just talk of more bank liquidity, which doesn’t matter, and more to weaken the euro, which doesn’t work either.

Hard to say why the euro has been going down, but it’s not ECB policy per se which, while meant to weaken the euro, instead continues to be ‘strong euro’ biased. So must be portfolios selling euro, maybe in response to Russia’s actions.

“French Prime Minister Manuel Valls called for more action from the ECB to lower the value of the euro.Mr Valls said: “the monetary policy has started to change”. While he called the ECB’s package of measures taken in June a “strong signal,” he also said that “one will have to go even further.”

German Finance Minister Mr Schaeuble said deficit-fueled growth leads to economic decline, signalling discord with Italy and France as euro-area policy makers seek ways to avoid deflation and spur growth. Euro-area countries that pursued austerity policies in return for sovereign bailouts are “doing much better than all the others in Europe,” Schaeuble.

ECB’s Coeure says ready to adjust monetary policy if needed: In an article published in Greek daily Ta Nea, ECB’s Coeure said that ECB’s measures so far, have contributed to stability in the euro zone while its recent decisions have ensured a particularly accommodative direction in monetary policy in the single-currency bloc. “The ECB will provide additional liquidity to banks on the condition that they increase credit directed to the real economy, and it is ready to further adjust the direction of its monetary policy, if needed,” Coeure said (Ta Nea, Reuters) ”

Charts and data from the last few days

Down for the cold winter then back up some, and a very weak first half of the year, and Q3 fading from Q2:

GDP


Highlights
The second estimate for second quarter GDP growth came in a little stronger than expected, rising 4.2 percent annualized versus a 4.0 percent forecast and coming off a 2.1 percent weather related drop in the first quarter. With this second estimate for the second quarter, the general picture of economic growth remains the same; the increase in nonresidential fixed investment was larger than previously estimated, while the increase in private inventory investment was smaller than previously estimated.

Real final sales of domestic product-GDP less change in private inventories-increased 2.8 percent in the second quarter, in contrast to a decrease of 1.0 percent in the first. Real final sales to domestic purchasers gained 3.1 percent versus 0.7 in the first quarter.

Chain-weighted prices gained 2.1 percent annualized, compared to the consensus for 2.0 percent and the first quarter number of 1.3 percent.

Overall, the weather-related rebound in the second quarter was stronger than expected. Personal spending made a comeback and inventories were rebuilt. The economy is gradually regaining momentum-emphasis on gradually.

Corporate Profits

Again, for growth this year to exceed last year, all the components on average have to grow more than they did last year:

NAR: Pending Home Sales Index increased 3.3% in July, down 2.1% year-over-year

By Bill McBride

From the NAR: Pending Home Sales Pick Up in July

The Pending Home Sales Index, a forward-looking indicator based on contract signings, climbed 3.3 percent to 105.9 in July from 102.5 in June, but is still 2.1 percent below July 2013 (108.2). The index is at its highest level since August 2013 (107.1) and is above 100 – considered an average level of contract activity – for the third consecutive month.

With purchase apps down 11% year over year and cash purchases down it’s hard to see how total sales can grow?

MBA Purchase Applications

Highlights
Demand for purchase applications picked up in the August 22 week, rising 3.0 percent. But the trend remains stubbornly flat, down 11.0 percent year-on-year. The index for refinancing applications also rose 3.0 percent in the week. Mortgage rates were little changed in the week with the average for conforming loans ($417,000 or less) down 1 basis point to 4.28 percent.

Falling home prices are not a good sign:

S&P Case-Shiller HPI


Highlights
Home price appreciation continues to unwind as S&P Case-Shiller 20-city adjusted data show a 0.2 percent decline in June following a 0.3 percent in May. Year-on-year, the adjusted rate is plus 8.1 percent vs 9.3 percent in May. Monthly declines swept 13 of the 20 cities with Minneapolis, Detroit, Atlanta and Chicago showing special weakness.

Unadjusted data, which are followed in this report, show a monthly gain of 1.0 percent that reflects the relative strength of summer months for sales. But the year-on-year rate, where this effect is offset, tells exactly the same story as the adjusted data, at 8.1 percent vs 9.3 percent in the prior month.

Home prices are weakening, based not only on this report but also on FHFA data, also released this morning, and on yesterday’s new home sales report as well as last week’s existing home sales report. Easing home prices are a plus for sales but a negative of course for homeowner wealth.

Durable Goods Orders


Highlights
Durables orders soared in July due aircraft orders but otherwise came off a moderately strong core number in June. New factory orders for durables soared a monthly 22.6 percent in July, following a 2.7 percent boost in June. Econoday’s consensus called for a 5.1 percent gain in July. The high end of forecasts was 24.5 percent.

Excluding transportation, durables orders slipped 0.8 percent, following a 3.0 boost in June. Analysts forecast a 0.4 percent rise for July. But June earlier had been estimated to be up “only” 1.9 percent from the full factory orders report.

Transportation spiked a monthly 74.2 percent after rising 2.1 percent in June. Nondefense aircraft (Boeing) surged 318.0 percent (that is not a typo) after gaining 11.1 percent in June. Another but more moderate positive was motor vehicle orders which gained 10.2 percent, following a 1.3 percent dip in June. Defense aircraft fell 28.8 percent in July, following a rise of 9.2 percent the month before.

Outside of transportation, gains were limited with “other” gaining. Other categories slipped but followed upward revisions to June.

Orders for equipment investment edged down in July but followed a strong June. Nondefense capital goods orders excluding aircraft declined 0.5 percent, following a spike of 5.4 percent the month before. Shipments of this series, however, were positive, gaining 1.5 percent in July, following an increase of 0.9 percent in June. The latest shipments numbers suggest a favorable number for business equipment in third quarter GDP.

The Boeing order gets filled over approximately the next 10 years: