It’s the net exports, paid for by non residents selling their currency to buy euro to spend, that drives up the euro until the net exports cease and trade goes negative. And with the rigidities/J curve/etc. the move up could be extreme, with the ECB unable to dampen it due to ideological restrictions on fx purchases.
March 24 (Markit) — German private sector output increases at strongest rate in eight months () Germany Composite Output Index at 55.3 (53.8 in February), Services Activity Index at 55.3 (54.7 in February), Manufacturing PMI at 52.4 (51.1 in February), and Manufacturing Output Index at 55.4 (52.2 in February). Survey participants noted that a positive economic environment combined with strengthening demand from both domestic and foreign markets accounted for much of the rise in new orders. Manufacturers reported the sharpest rise in new export business for eight months in March. Panel members partly attributed this to a weaker euro.
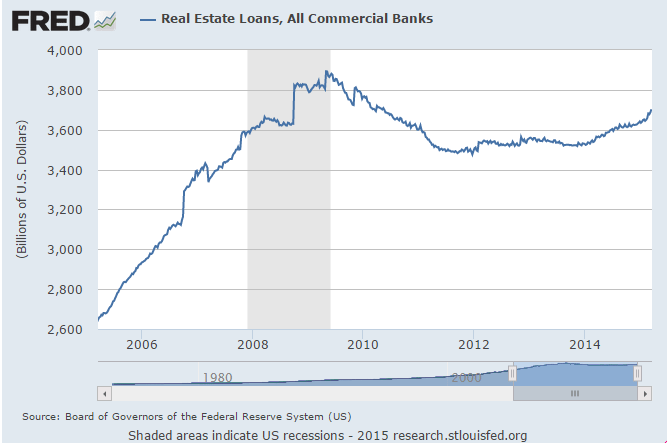
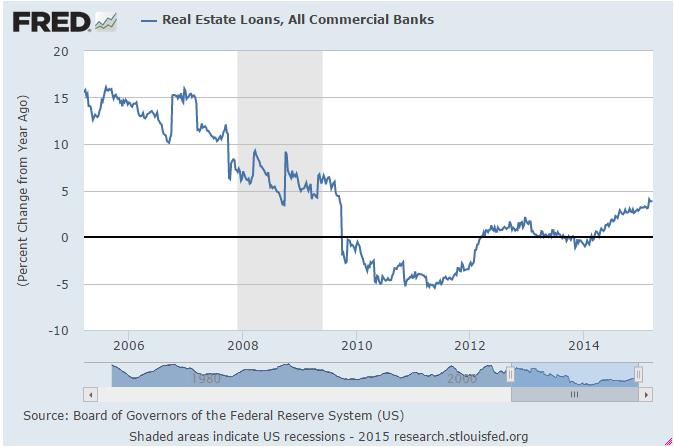
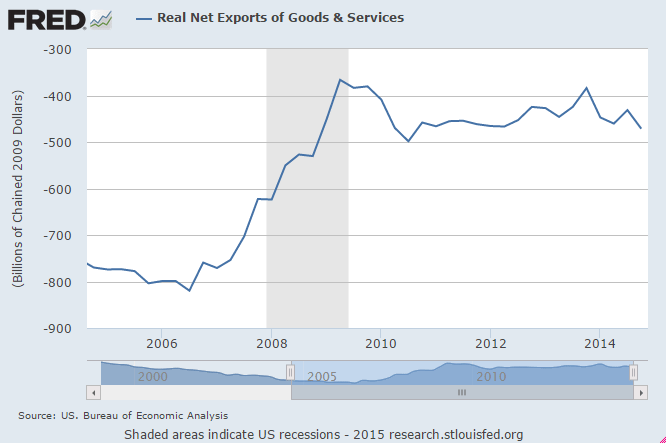
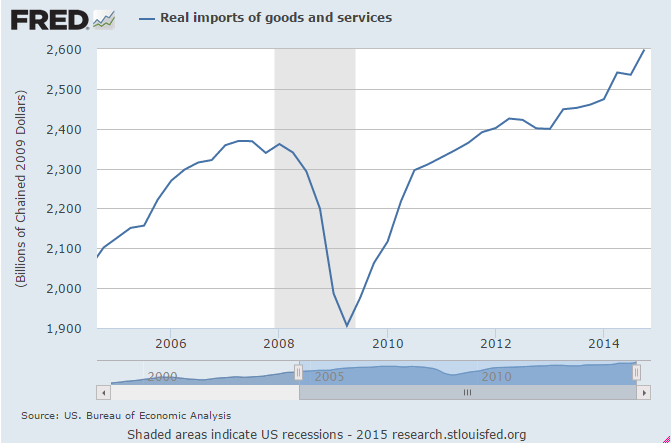
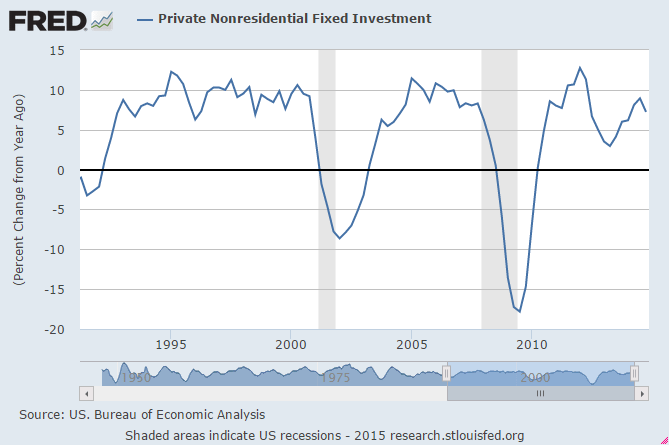
And the market of consequence for net exports is the US, where non petro imports continue their strong growth, with the strong dollar demand from portfolio shifting and speculators likewise having driven it to current levels that give the euro zone a cost advantage:
By Joseph Szczesny
March 23 (AFP) — US off-roaders seeking to rev up the four-wheel drive of a Jeep might soon find out that their American icon is made in Italy.
In a sign of what comes with the takeover of Chrysler by Italian giant Fiat, US auto dealers have begun selling the Italian-made Jeep Renegade.
March 24 (Nikkei) — Brisk exports a plus, but consumption key to full-blown recovery (Nikkei) “Production and exports are picking up,” State Minister for Economic and Fiscal Policy Akira Amari told a press conference. The index for transport equipment — including automobiles — rose 4% on the month, helped by increased shipments to the U.S. and Europe. The index for electronic parts and devices climbed 1.7% amid brisk exports to Asia. The ministry projects that the index for production machinery will drop 0.3% in February and 7.3% in March, and that the index for transport equipment will fall 1.6% and 0.5%.
As expected, still below Fed’s targets:
Consumer Price Index
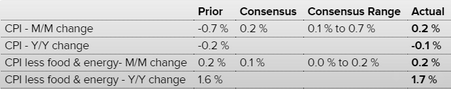
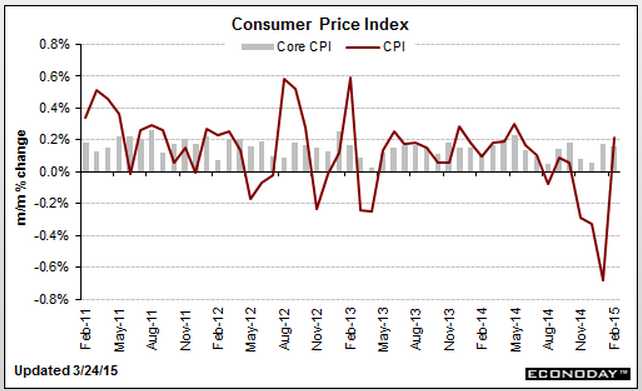
Less than expected and looks to still be softening to me:
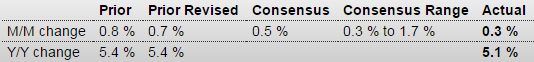
FHFA House Price Index
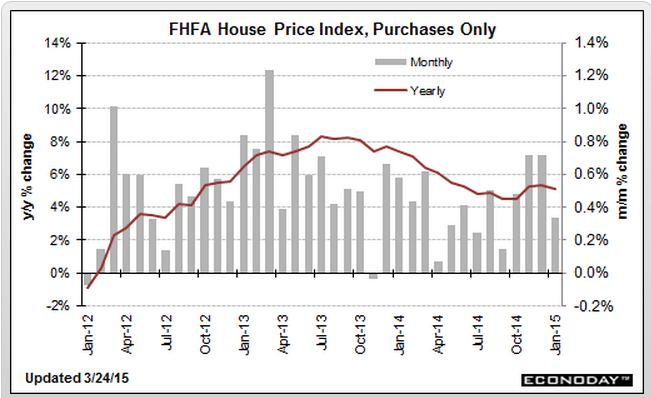
Highlights
House prices continue to rise in January but at a slower pace. FHFA house prices advanced 0.3 percent, following a gain of 0.7 percent in December. Analysts projected a 0.5 percent gain for January. The year-ago rate came in at 5.1 percent, compared to 5.4 percent in December.
Regionally, six Census regions reported gains in January while three declined.
Better than expected, and only slightly suspect, and still severely depressed vs prior cycles even as the population has grown:
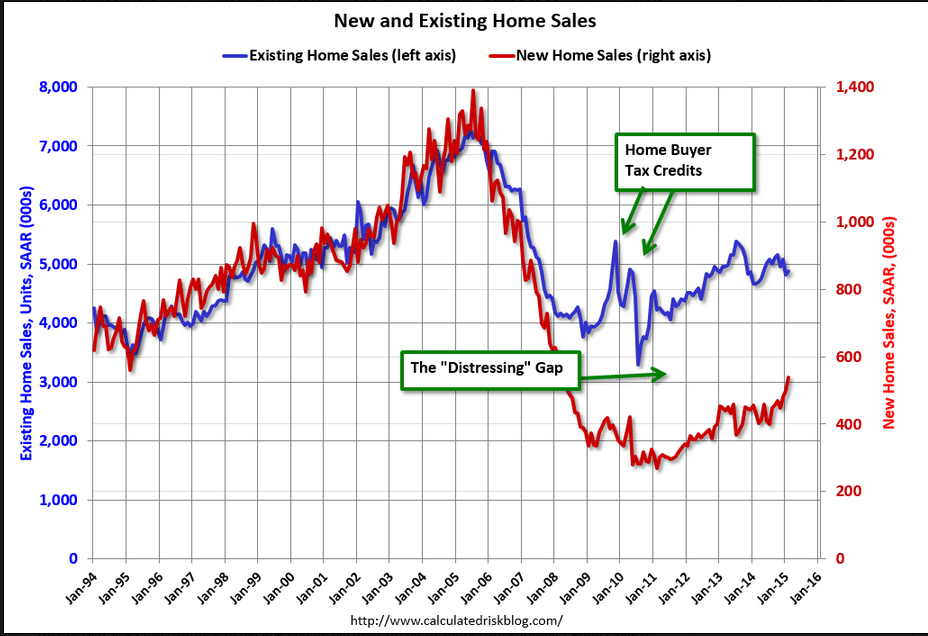
New Home Sales

Highlights
In a positive jolt out of the housing sector, new home sales picked up sharply in February to a 539,000 annual rate. Adding to the good news is a big upward revision to January, to 500,000 from 481,000. These are the first two 500,000 readings going all the way back to April and May of 2008.
The gain drew down what was already thin supply on the market, to 4.7 months at the current sales rate vs 5.1 and 5.3 months in the prior two reports. The current reading is the lowest since June 2013 and will undoubtedly encourage builders to expand construction. The lack of supply, however, did not lift prices where the median fell a sharp 4.8 percent in the month to $275,500. Sellers, in fact, seem to be giving price concessions with the year-on-year price up only 2.6 percent.
Looking at sales by region shows a big surge in the Northeast where, however, sales levels compared to other regions are very low. Sales in the Midwest, which is also a small region for new home sales, fell sharply in the month as they did in the West, a large region for sales that represents 23 percent of all sales. Sales, however, were very strong in the South, a region that makes up a whopping 59 percent of all sales and where sales are back to where they were in February 2008.
Lower than expected and not good:
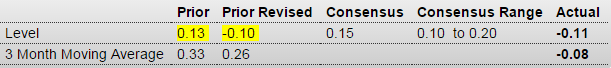
Richmond Fed Manufacturing Index
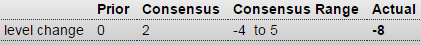
Highlights
March has not been a good month for the Richmond manufacturing sector where the index fell into contraction, to minus 8 vs zero in February. Order readings, both for new orders and backlogs, are down substantially as are shipments and the workweek. Hiring, however, remains respectable, at least for now. Price readings show only the most marginal pressure.
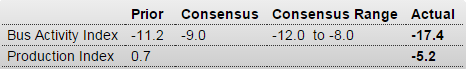
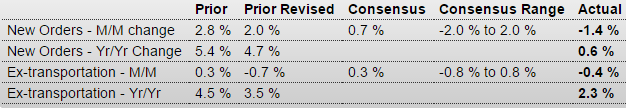
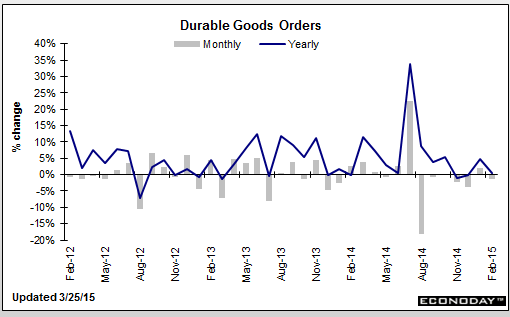
The early signals from the regional manufacturing reports (that is this report together with last week’s Philly Fed and Empire State reports) are all showing weakness in orders, a trend also highlighted by this morning’s PMI flash where weakness in export orders is specifically cited. Just last week, the FOMC underscored weak exports as a major factor holding back economic growth.
PMI Manufacturing Index Flash
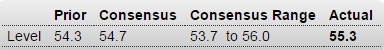
Highlights
The manufacturing sector has gotten off to slow start this year but may have picked up slightly in March, based at least on the PMI flash which is at 55.3, a 5-month high and vs 55.1 in final February and 54.3 in mid-month February. New orders are also at a 5-month high as rising domestic sales offset declining export sales and weak sales out of the oil sector. Output is at a 6-month high and employment at a 4-month high. Input costs are down for a 3rd straight month and output prices are rising at their slowest pace in 3-1/2 years.
The decline in export sales is of special note in this report which cites concerns among respondents that the dollar’s strength against the euro is hurting demand. Last week’s FOMC statement pointed to weak exports as a major factor holding down growth. This report in general has been running noticeably hotter than hard data from the government which have been no better than flat, if that, and which would correspond to a roughly 50 level for the PMI.