wage growth and business investment

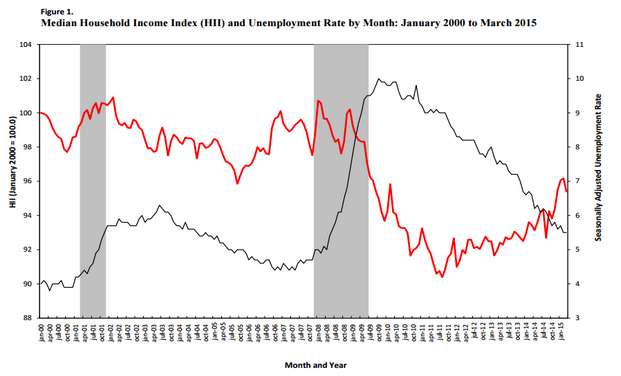
Interesting how these two reports relate to each other.

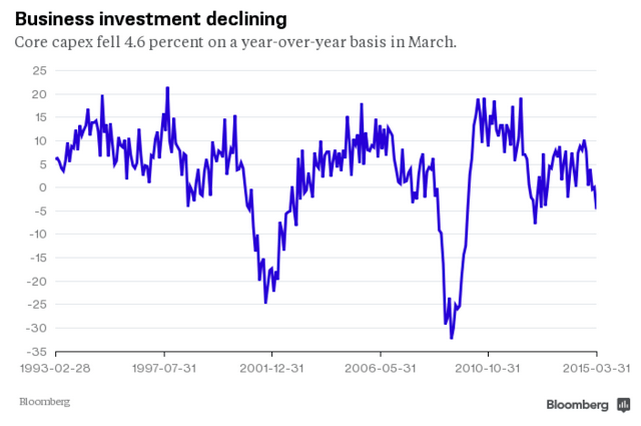
And the circled section is the last time the street was screaming about ‘wage inflation’ saying that every time in the past it went up as it had to that point it kept going up for the next 4 years. But it does track somewhat with investment, below:
ahe

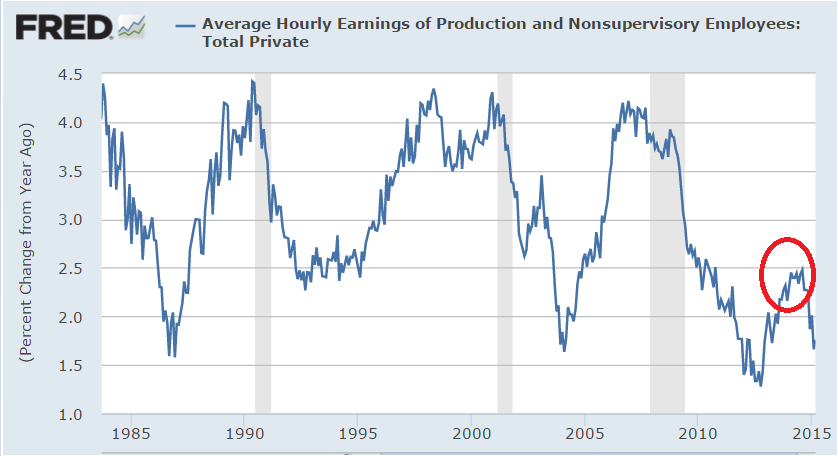
Wage Growth Is Poised to Accelerate

By Gene Epstein

April 24 (Barrons) — Jason Benderly of Applied Global Macro Research has built an explanatory model that accounts for fluctuations in labor compensation with a far closer fit than a single-variable model that consists solely of the change in the unemployment rate. These four key variables (the change in the jobless rate, the jobless rate, the change in labor productivity, and after-tax profit margins), along with two other, minor ones relating to prices, explain real hourly compensation, which includes all benefits, going back to 1960. With no trouble explaining the recent period, the model predicts an acceleration in wage growth.

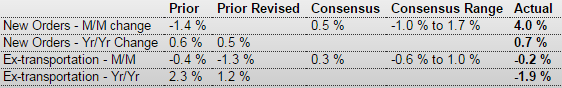
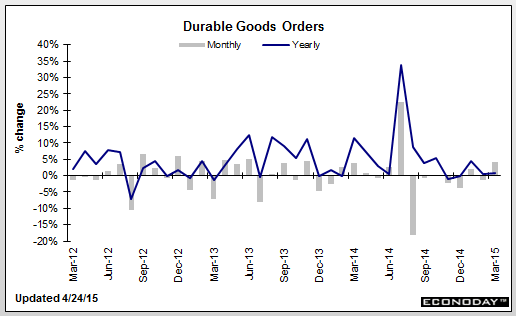
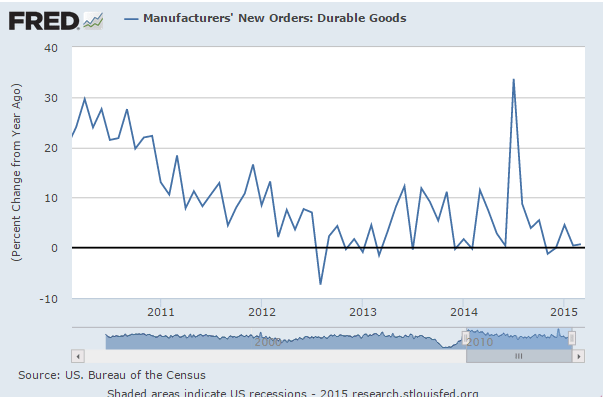
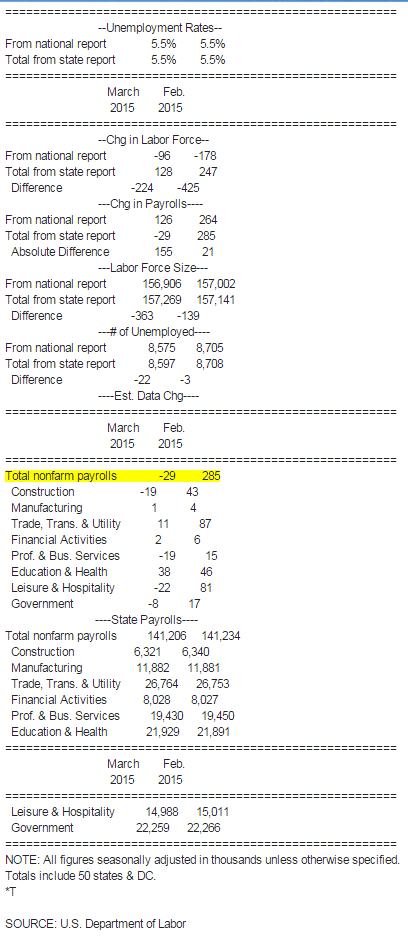
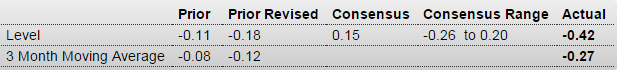
Weak U.S. business spending data hints at sluggish growth rebound

By Lucia Mutikani

April 24 (Reuters) — U.S. business investment spending plans fell for a seventh straight month in March. Non-defense capital goods orders excluding aircraft declined 0.5 percent last month after a revised 2.2 percent drop in February, which was the biggest decline since July 2013. In March, shipments of core capital goods fell 0.4 percent after a downwardly revised 0.1 percent gain in February.Shipments in February were previously reported to have risen 0.3 percent. That downward revision together with March’s weak reading could see economists trim their first-quarter GDP growth estimates.

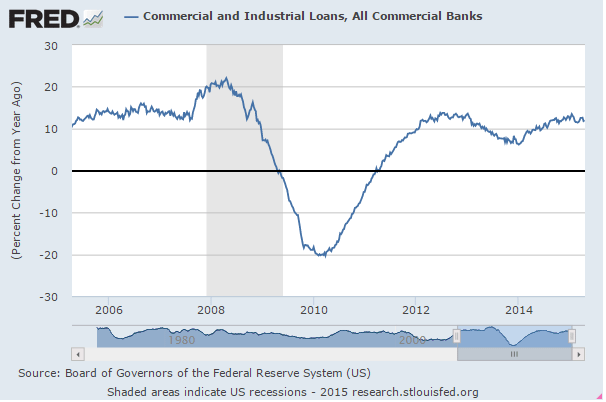
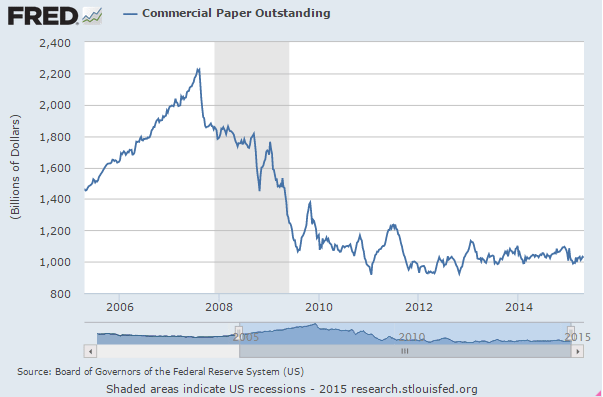
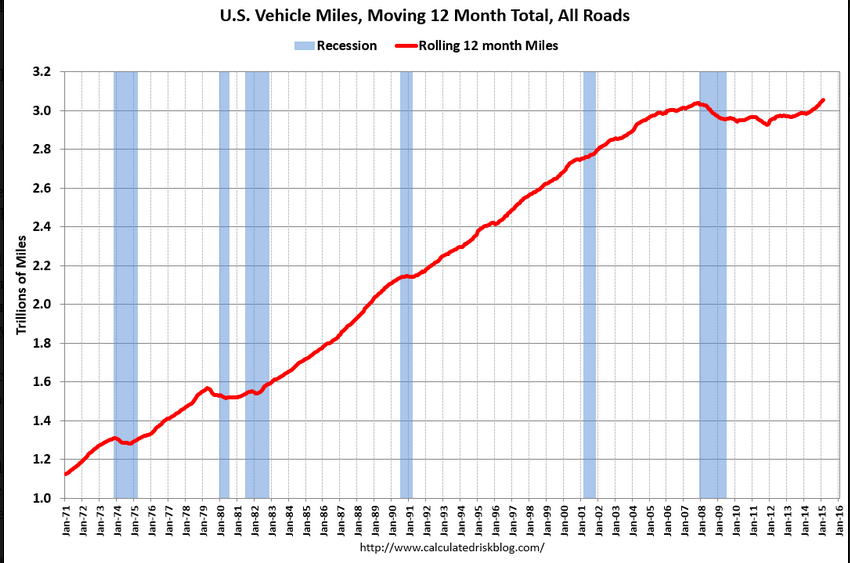
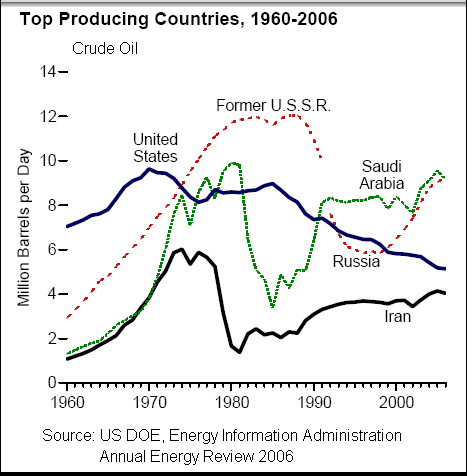
Looks like this is coincident to recession, unless rescued by another fracking boom…
capex
Sure looks to me like there’s a high probability this cycle is over. And could have been over last year if not rescued by the fracking boom.

Fracksional reserve banking???
:( sorry!!!

durable goods orders, miles driven

All the important indicators still heading south, and Atlanta Fed again reduces it’s GDP forecast

Durable Goods Orders
er-4-24-1
Highlights
Manufacturing is on a dual track-transportation up and non-transportation soft. Durables orders rebounded 4.0 percent in March after falling 1.4 percent in February. Analysts called for a 0.5 percent increase. Excluding transportation, the core dipped 0.2 percent, following a decline of 1.3 percent in February. Expectations were for a 0.3 percent boost in March. Transportation spiked 13.5 percent after a 1.8 percent dip in February. All major transportation subcomponents gained. But the core was soft.

Within the core, orders were almost all down. The only major industry that gained was computers & electronics. Declines were seen in primary metals, fabricated metals, machinery, electrical equipment, and “other.”

Nondefense capital goods orders excluding aircraft were down 0.5 percent, following a 2.2 percent dip in February. This suggests that businesses are being reluctant to invest in equipment and that business equipment investment will be soft in coming quarters. Shipments of this series declined 0.4 percent in March after slipping 0.1 percent the month before. This likely will cut into first quarter GDP growth estimates.

The manufacturing sector continues to be weak outside of transportation. This is another indicator that points to a soft first quarter and continued Fed ease. The Fed likely will continue to see the manufacturing sector as soft and not be in a hurry to raise rates.
er-4-24-2
er-4-24-3
er-4-24-4
er-4-24-5
er-4-24-6

Yes, this estimate of the 12 month total hit an all time high, but the chart shows how weak it remains, and the general weakness of this recovery (not that driving more is a ‘good thing’) and it’s not population adjusted. And Feb did print lower than Jan:

DOT: Vehicle Miles Driven increased 2.8% year-over-year in February, Rolling 12 Months at All Time High

By Bill McBride

The Department of Transportation (DOT) reported:

Travel on all roads and streets changed by 2.8% (6.1 billion vehicle miles) for February 2015 as compared with February 2014.

Travel for the month is estimated to be 221.1 billion vehicle miles

The seasonally adjusted vehicle miles traveled for February 2015 is 254.1 billion miles, a 2.6% (6.4 billion vehicle miles) increase over February 2014. It also represents a -1.2% change (-3.2 billion vehicle miles) compared with January 2015.
er-4-24-7

Posted in GDP

new home sales, median household income, greek fin min comments, rail data, kc fed

Another weak number but no surprise as last month’s was suspect on the high side.

nhs-mar
Highlights
One day up, one day down is a fit description for recent housing data. Last week’s declines in housing starts & permits were a surprising blow to the outlook, reversed in part by yesterday’s very strong report on existing home sales. But today it’s bad news again as new home sales fell a very steep 11.4 percent to a 481,000 annual rate.

The bulk of the decline came in the largest region, the South, where sales fell 15.8 percent. The drop here does follow a 9.3 percent gain in the prior month but the latest result is not good news for the region’s builders. Also contributing to the decline was the Northeast, but sales in this region are very small, as well as the West, a much larger region where sales were down 3.4 percent. Sales in the Midwest rose 5.9 percent in the month.

More new homes actually came onto the market in March, up 4,000 to 213,000 nationwide, but supply relative to sales rose sharply because of the drop in sales, to 5.3 months from 4.6 months. This reading, however, is still pretty thin and won’t scale back builder plans.

Softness in sales is confirmed by price data where the median price fell 1.5 percent to $277,400. Year-on-year, the median price is down 1.7 percent while sales are up 19.4 percent, a discrepancy that points to price discounting by builders.

March 2015 New Home Sales Are Having a Rough Ride. Four Month Decline in New Home Prices.

By John Lounsbury and Steven Hansen

The headlines say new home sales significantly declined from last month. This whole data series is suspect because of the significant backward revisions, a roller coaster of good months and bad months, and obvious seasonality issues. HOWEVER, the rolling averages smooth out much of the garbage produced in this series – and there was an insignificant improvement in the rolling averages. There is a continuing decline in new home prices.

Median Household Income Lower in March 2015

(Sentier Research) — According to new data derived from the monthly Current Population Survey (CPS), median annual household income in March 2015 was $54,203, about 0.8 percent lower than the February 2015 median of $54,639. The Sentier Household Income Index for March 2015 was 95.4 (January 2000 = 100).
median-hhi

From the Greek finance minister- reads like they accept the austerity in general so will likely get funded by the EU and move on to more of same:

None of this means that common ground cannot be achieved immediately. The Greek government wants a fiscal-consolidation path that makes sense, and we want reforms that all sides believe are important. Our task is to convince our partners that our undertakings are strategic, rather than tactical, and that our logic is sound. Their task is to let go of an approach that has failed.

rail-apr-18
kc-fed-mar2
comp-ind-v-ma

PMI’s, Housing sales data, Yellon on oil

A few more PMI’s showing weakness:

Japan : PMI Manufacturing Index Flash
jn-apr-pmi

Highlights
Manufacturing weakened for a third consecutive month. The flash April manufacturing PMI reading was 49.7, down from 50.3 in March. A reading below 50 indicates contraction. The output index also slipped below 50 to a reading of 49.7, down from 52 the month before. New orders decreased at a faster rate as did the quantity of purchases. New export orders increased, but at a slower pace as did input prices. Employment changed direction and increased. Output prices increased.

China : PMI Flash Mfg Index
ch-apr-pmi
Highlights
April’s flash manufacturing index reading was a twelve month low of 49.2, down from the March final of 49.6. The output index remained above the 50 breakeven point with a reading of 50.4, down from 51.3 in March.

European Union : PMI Composite FLASH
eu-apr-pmi

This article shows the drops in ‘all cash’ purchases’ which must be replaced with mortgages for sales to be sustained. That means it takes an increase in the mortgage funding just to sustain current levels of sales.

It also shows the decline in short sales and foreclosure sales that tend to be the lowest priced sales, depressing the average and median prices reported. That means that even if the sales prices of the remaining homes sold stay the same the median and average prices reported will increase:
cash-buyers

This is a Dec 17 video of the Fed Chairman expressing the Fed’s view that the fall in oil prices is expected to be a net positive for the economy. Note that there is no mention whatsoever of the ‘identity’ of income, meaning that for every ‘consumer’ saving $1 another ‘consumer’ has lost that $ of income. This conspicuously absent income loss is in addition to the capex reductions she discusses, and includes income lost by the foreign sector due to the lower price of oil which can translate into reduced US exports. So it still looks to me like the oil price cut was an unambiguous negative for the US economy, as now evidenced by most all of the subsequent economic releases, with the capex reductions both domestically and globally more than offsetting any gains due to the US being a net importer of oil.

“From the standpoint of the U.S. and U.S. outlook, the decline we’ve seen in oil prices is likely to be, on net, a positive,” said Yellen at a press conference on Wednesday. “It’s good for families, for households. It’s putting more money in their pockets,” she said. Thanks to the oil price decline, drivers in at least 13 states around the country can now find gas forcheaper than $2 a gallon. Cheaper energy also translates to lower expenses for many U.S. businesses, especially ones in the transportation industry like airlines.

No mention whatsoever of those seeing an equal reduction of income.

Yellen acknowledged that the plunge in oil prices may cause cutbacks in the drilling industry, which is likely to slow capital spending for wells that aren’t profitable in the current environment. However, the Fed chief noted that despite the shale boom, the U.S. is still a net importer of oil. That means cheaper prices are good for the overall economy.

Only if that net savings exceeds the cutbacks in capex and the reduction of US exports, which the subsequent data says it has not.

sea container counts, state labor force stats, mtg purchase apps, existing home sales, FHA home prices, Japan headline

March 2015 Sea Container Counts Are Not Strong Even Though the Labor Troubles Are Over

By Steve Hansen

The West Coast Ports labor dispute is over, and appears the backlog has been eliminated causing a spike in exports. However, not only is year-to-date volumes contracting for both imports and exports – but March exports are contracting month-over-month and year-over-year. This is indicating weak economic conditions domestically and globally.

U.S. March Labor Force Comparison Statistics (Table)

By Chris Middleton

April 21 (Bloomberg) — Following is a comparison of U.S. labor force figures as reported in the national employment situation release and the monthly regional and state employment report. Total state figures are calculated by Bloomberg News.

Each state series is subject to larger sampling and nonsampling errors than the national series. Summing them compounds the state level errors and can cause significant distortions at the aggregate level. Due to these statistical limitations, the Bureau of Labor Statistics does not compile a “sum-of-states” employment series and cautions users that such a series is subject to a relatively large and volatile error structure.
er-4-22-1

Oil States See Slumping Employment as Texas Loses 25,000 Jobs in March

April 21 (WSJ) — While the U.S. economy continued to add jobs last month, states that rely heavily on the oil industry experienced significant cuts. Job losses hit particularly hard in Texas (down 25,400 jobs) and Oklahoma (down 12,900), leading the nation in losses. North Dakota lost 3,000 jobs, a significant cut in such a small state. All told, 31 states and Washington, D.C., saw a drop in employment in March, and only 18 states saw employment rising. The broad deterioration was a reversal from February, a month in which only 13 states saw decreases and 36 states and D.C. saw an increase.

Purchase apps up some from still very depressed levels, but cash sales have been falling so total sales not necessarily higher.

And year over year up but last year’s sales were even more depressed by the exceptionally cold winter.

MBA Mortgage Applications
er-4-22-2
Highlights
Mortgage applications for home purchases have definitely been showing life this spring, up 5.0 percent in the April 17 week. This is the 4th increase in 5 weeks. Helping purchase demand are low rates, down 4 basis points in the week to an average 3.83 percent for conforming loan balances ($417,000 or less). Low rates, however, aren’t doing much to stimulate refinancing demand with this index up only 1.0 percent in the week. Watch for existing home sales later this morning at 10:00 a.m. ET.
er-4-22-3

Up a bit more than expected, but still depressed as well. And few distressed sales raise the median price so a ‘quality adjusted’ price would be more informative. And with the last slowdown coincident with a rate spike maybe the Fed isn’t ready to risk that again?

Existing Home Sales
er-4-22-4
Highlights
This winter’s heavy weather may very well have held down the housing market which appears to be heading into the spring with new momentum. Existing home sales surged 6.1 percent in March to a 5.190 million annual rate. This is near high-end expectations and the best rate since September 2013. In percentage terms, the 6.1 percent gain is the strongest since December 2010 and among the very highest in the 16-year history of the series.

Sales of single-family homes jumped 5.5 percent in the month to a 4.590 million rate while condos really jumped, up 11.1 percent to a 600,000 rate. All regions show solid gains in total sales led by the Midwest at 10.1 percent with the South at the rear, though still up a solid 3.8 percent.

Price data all show strength with the median price up a very strong 5.1 percent to $212,100. Year-on-year, the median is up 7.8 percent for the best reading since February last year. This is a bit below the year-on-year sales rate of 10.4 percent which hints at further pricing power ahead.
er-4-22-5
er-4-22-6

Again, I’d like to see what this looks like excluding distressed sales:

er-4-22-7

Bank of Japan to cut fiscal 2015 inflation forecast

April 1 (Nikkei) — The Bank of Japan is considering lowering its 1% inflation forecast for fiscal 2015 amid the continued slump in oil prices and a slow recovery in domestic consumption.

Redbook retail sales, Greece comment

Hopefully it bounces back:

Redbook
redbook-4-18-table
Highlights
This year’s Easter shift, from late in April last year to early in April this year, is greatly distorting store sale comparisons. Redbook’s same-store year-on-year tally is up only 0.8 percent in the April 18 week following the prior week’s 1.1 percent rate which was also distorted by the calendar effect. When these distortions pass, store sales will likely return to their 3.0 to 3.5 percent pace.

This chart is for a full month last year vs this year. Remember, lower gas prices are supposed to increase sales:
redbook-monthly-yoy

ECB’s Constancio: default no reason to quit euro as Greece cash pinch worsens

By John O’Donnell and Jonathan Gould

April 19 (Reuters) — “If a default will happen … the legislation does not allow that a country that has a default … can be expelled from the euro,” ECB VP Vitor Constancio told the European Parliament, saying that Greek banks had been told not to increase their exposure to the state to avoid “a possible credit event regarding the state”. “Capital controls can only be introduced if the Greek government requests,” he said, adding that they should be temporary and exceptional. “As you saw in the case of Cyprus, capital controls did not imply getting out of the euro.”

So Cal home sales, Carter and the inflation of the 70’s

Up a bit vs March last year so no boom yet:

CoreLogic (formerly DataQuick data): SoCal sales up 5.0% Year-over-year

By Bill McBride

April 20 (Calculated Risk) — CoreLogic released the Southern California report today for March (CoreLogic acquired DataQuick).

The data shows 18,156 new and resale houses and condos sold in Los Angeles, Riverside, San Diego, Ventura, San Bernardino and Orange counties in March.

That was up 35.6% from 13,650 sales in February, and up 5.0% from 17,638 sales in March last year.

A narrative about how Carter’s deregulation of natural gas in 1978 (not ‘monetary policy’)is what broke the ‘great inflation’ that was likewise caused by the prior rise in the price of oil. The report may be ‘over friendly’ to Carter, but it was the substitution of natural gas for oil in public utilities and other businesses that dislodged OPEC’s pricing power. Note the supply cuts as Saudia Arabia and Iran, shown here, attempted to set hold prices at over $30 as substitution reduced demand:
oil-production

Miller Center – Jimmy Carter

Energy Policy Success

Carter’s main achievement involved energy policy, though he would receive little credit for it during his term. Despite the lip service paid by American presidents to reducing energy dependence, U.S. oil imports had shot up 65 percent annually since 1973. In 1976 the nation was consuming one-quarter of all Organization of Petroleum Exporting Countries (OPEC) production. The U.S. remained wasteful in energy use, with consumption per capita 2.3 times the average for nations in the European Economic Community and 2.6 times Japan’s. Carter set out to reduce this dependence.

The president got Congress to pass the Emergency Natural Gas Act, which would authorize the national government to allocate interstate natural gas. He created a Department of Energy to regulate existing energy suppliers and fund research on new sources of energy, particularly sustainable (wind and solar power) and ecologically sound sources. His Energy Security Act created the U.S. Synthetic Fuels Corporation, which would provide $20 billion in joint ventures with private industry. Carter signed his first energy package into law on November 9, 1978. The deregulation of oil and natural gas prices that resulted would lead to a vast increase in the supply of energy in the 1980s, and consequently a lowering of prices.

During Carter’s term, however, the actions of the OPEC oil cartel (foreign oil producers) resulted in an increase in oil prices, from $13 a barrel to over $34. With America so dependent on oil, this huge price increase resulted in a run-up in inflation. Carter asked Congress to accelerate stockpiling 500 million barrels of crude oil in a national security reserve, setting target date by end of 1980 instead of 1982 (the deadline set by the Ford administration). The administration also developed new conservation measures that would sharply reduce industry’s use of fuels, as well as automobile mileage standards. Strip mining would now be regulated by the Surface Mining Control and Reclamation Act, a victory for environmentalists.

Carter had other successes in energy policy, particularly in nuclear energy policy, in which he was an expert. He got Congress to abolish the powerful Joint Committee on Atomic Energy, a step that would make it easier to block breeder reactors and move toward light-water reactors of the kind favored by the administration. Carter won his route for a soon to be constructed oil pipeline in Alaska. He killed funding for the Clinch River Breeder Reactor, because the plutonium reactor technology would increase the risk of nuclear proliferation if adopted elsewhere in the world. Instead, Congress authorized and funded a shutdown of the reactor.

By April 1980, he had gotten much of his second energy package through, including a Crude Oil Windfall Profits Tax (with revenues designated for the general Treasury but not for specific energy projects), which would expire in 1993 or before, if the full amount of $227 billion had been collected. But there were two major defeats: Congress overrode a presidential veto of a bill that Congress had passed repealing a $4.62 per barrel oil import fee—the first time in twenty-eight years that a Congress had overridden a veto by a president from the majority party. It also defeated the Energy Mobilization Board that Carter had proposed to cut through “red tape” in developing new sources of energy.

While Americans had to endure long gas lines during the summer of 1979 and higher prices at the pump—effects of the Iranian revolution of that same year— Carter’s program by and large worked. Consumption of foreign oil did go down, from 48 percent when Carter took office to 40 percent in 1980, with a reduction of 1.8 million barrels a day. When Carter left office there were high inventories of oil and a surplus of natural gas, delivered by a more rational distribution system. There was greater oil exploration than before, leading eventually to an oil glut and a drop in prices-which Carter’s Department of Energy had not predicted. Between 1980 and 1985, domestic production would increased by almost 1 million barrels a day, while imports of crude oil and petroleum products declined from 8.2 to 4.5 million barrels a day. His goal of reducing U.S. dependency on foreign sources succeeded, at least temporarily.

Chicago Fed, EU CPI

Who would have thought?

Chicago Fed National Activity Index
chi-fed-mar
Highlights
March was not a good month for the economy, an assessment confirmed by the national activity index which fell steeply to minus 0.42 vs an already weak and downwardly revised minus 0.18 in February. And the first quarter as a whole was also weak, reflected in the 3-month average which came in at minus 0.09.

The production component, at minus 0.27, pulled down the index the most in March followed by personal consumption & housing at minus 0.13. Employment also pulled down the index, at minus 0.3 for a big swing downward vs February’s plus 0.11. The only component in positive ground in March, and only barely, was sales/orders/inventories at only plus 0.01.

Imagine what inflation would be without the years of 0 rates, the QE, and the weak euro!

;)

European Union Consumer Prices Fall for Fourth Month

April 17 (WSJ) — Eurostat on Friday said consumer prices in the 28-nation bloc fell 0.1% in March from a year earlier, and confirmed data that showed prices in the eurozone were also 0.1% lower. In February, prices fell 0.3% in the EU as a whole, a figure that was revised from an earlier estimate of 0.2%. Twelve EU members experienced an annual decline in consumer prices in March, down from 20 in February. The decline in prices in the 12 months to March was largely due to a drop in energy costs, although that eased markedly. In the eurozone, energy prices rose 1.7% from February.