So at current prices Saudis aren’t making much progress towards their goal of higher sales:
er-2-29-6

First a move up on the inventory thing, followed by a move down on the inventory thing.

And looks to me like there’s a lot more downside coming from that inventory thing, etc.:
er-2-29-7
Pretty lame bounce so far from an index that zig zags so much:
er-2-29-8

Chicago PMI, Pending home sales, EU inflation, G20 statement, Virginia jobless claims

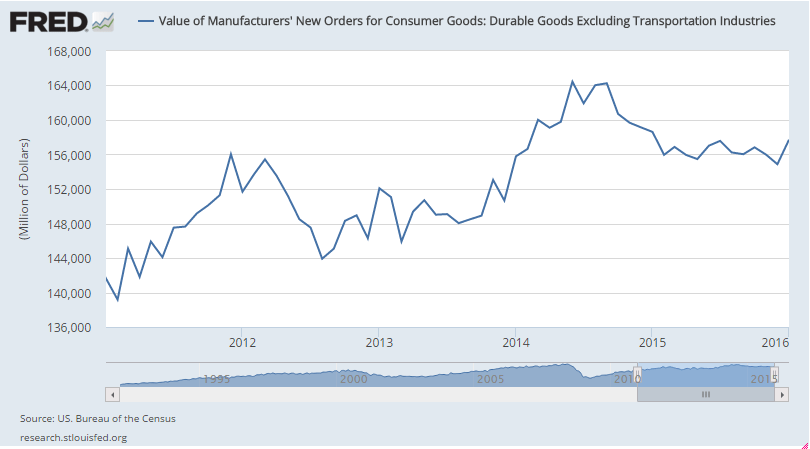
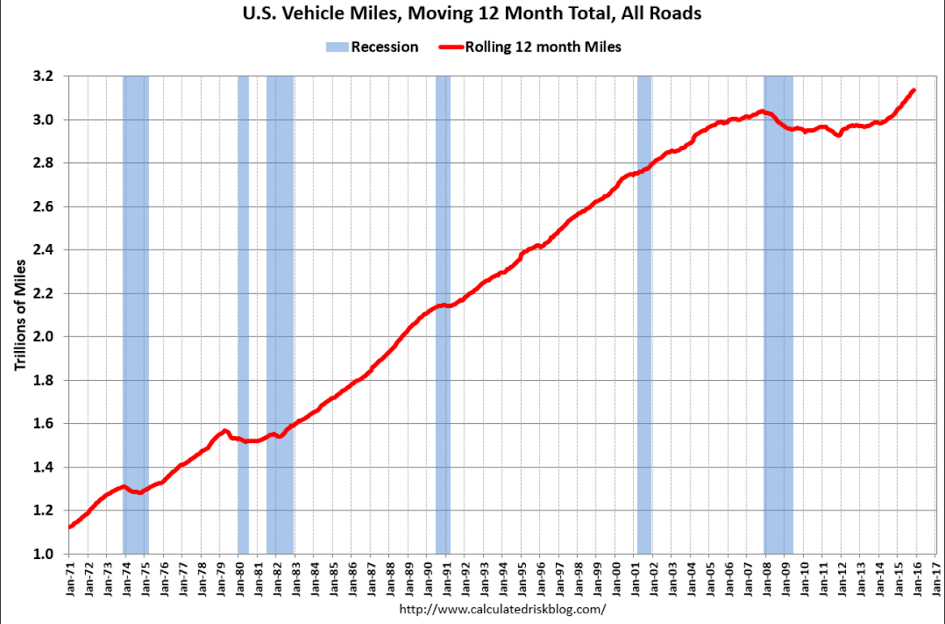
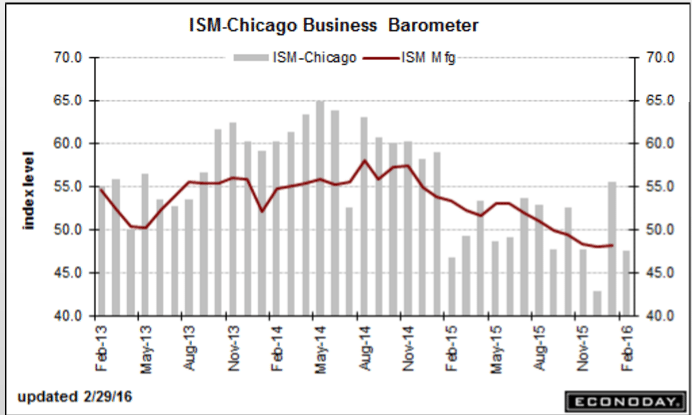
As previously suspected, last month’s higher print was just a bit of volatility on the way down, as per the chart:

Chicago PMI
er-2-29-1
Highlights
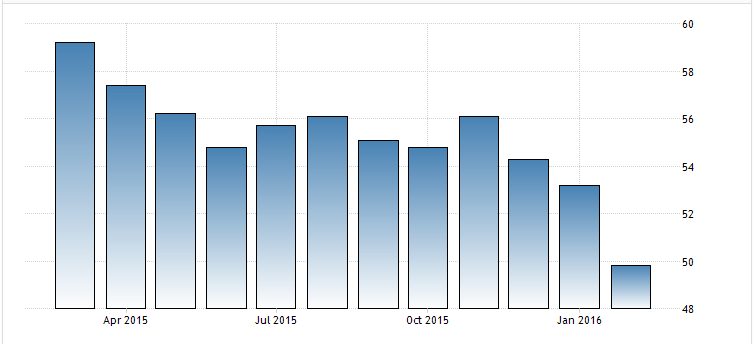
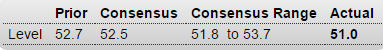
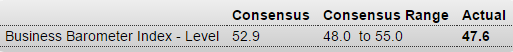
Another month and another month of wild volatility for the Chicago PMI which lurched from solid expansion in January to noticeable contraction in February. At a headline 47.6, Chicago’s PMI has fallen outside Econoday’s consensus range for a third month in a row! Still, this report is closely watched and confirms other early indications of February softness, not only for manufacturing but for services as well since this report tracks both sectors. The good news in the report is that new orders have held over breakeven 50 which hints at better readings in next month’s report. Now the bad news. Production is down sharply, backlogs are in a 13th month of straight contraction, employment is down and in a fifth month of contraction, and prices paid are contracting at the fastest pace since 2009. The resilience in new orders limits the signal of damage from this report, but production and other activity look to have slowed in February following respectable strength in January.

er-2-29-2
Another bad one, as the weakness that began with oil capex continues to dampen the rest:

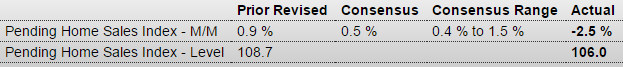
Pending Home Sales Index
er-2-29-3
Highlights
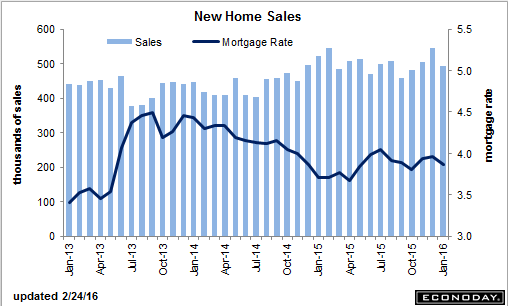
Pending sales of existing homes slowed in January, down an unexpected 2.5 percent to an index level of 106.0 in a decline offset but only in part by an 8-tenths upward revision to December to plus 0.9 percent. Econoday forecasters were expecting a much better reading, at a consensus plus 0.5 percent for January sales. Sales in the month fell in three of the four regions with only the South in the plus column. Year-on-year, pending sales are up only 1.4 percent. Today’s report is yet another disappointment for a sector that, despite high employment and low mortgage rates, is getting off to a flat start for 2016.

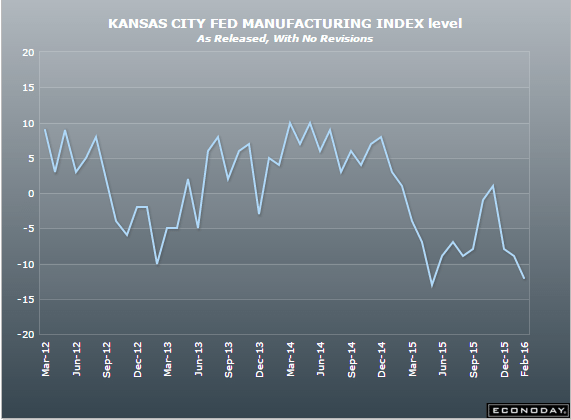
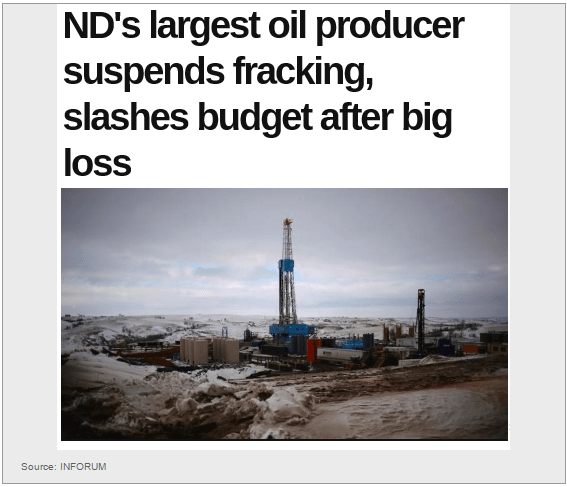
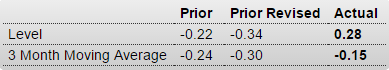
The oil patch is where the recession started and it keeps getting worse which means the rest of the economy will continue to deteriorate as well:

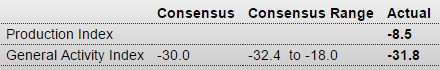
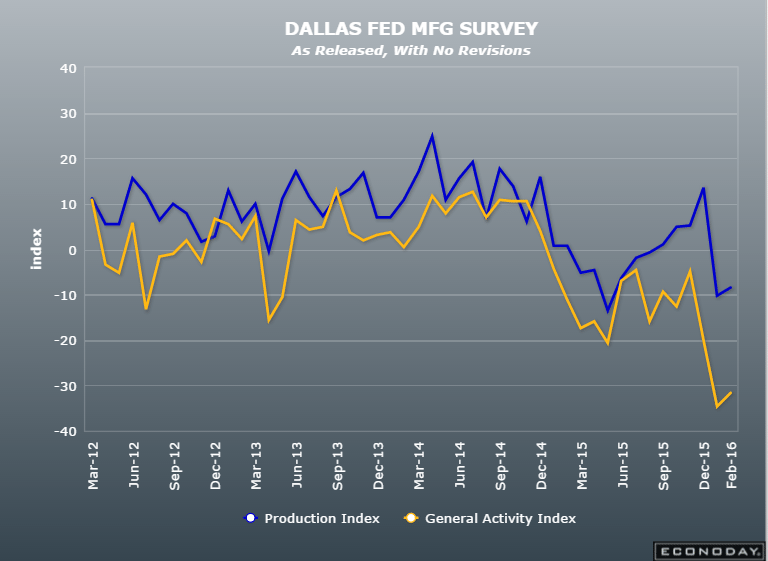
Dallas Fed Mfg Survey
er-2-29-4
Highlights
Dallas, together with Kansas City, are two Fed districts that are being hit hardest by the collapse in oil prices. The Dallas Fed’s general activity index came in at a deeply minus 31.8 in February vs minus 34.6 in January. New orders contracted a further 8.4 points in the month to minus 17.6 for their lowest reading since 2009 in what is a very ominous signal for the months ahead. Unfilled orders are also in contraction as are production and shipments. Price contraction deepened for both raw materials and selling prices. Inventories are down as is employment. In fact, in a rare sweep of weakness, all 17 current components are in contraction! The company outlook index is at minus 17.4 with a quarter of the sample saying their outlook has worsened during February. The latter is a telling reading and suggests very strongly, in line with all other anecdotal readings this month, that the factory sector, hit by weak exports and a weak energy sector, fell back in February.

er-2-29-5
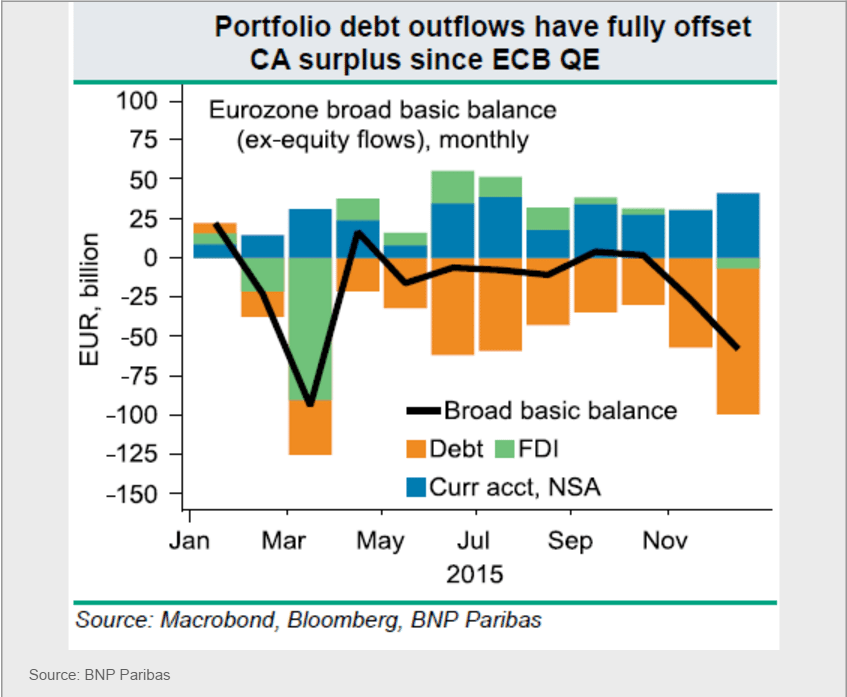
Fundamentally high inflation = weaker currency as higher prices means the same amount of currency buys less,etc. and deflation = a fundamentally stronger currency. However, the euro has been falling on news of deflation, as portfolio mangers, traders, etc. sell what euro they still have (or get outright short), their logic/fears being that deflation will trigger more inflationary policy from the ECB, which has yet to ‘trigger’ inflation. Meanwhile, the lower euro, driven down by selling and not ‘fundamentals’, continues to support the large and growing trade surplus that removes net euro financial assets from global markets. This has been going on for maybe a couple of years now leaving the euro more and more ‘undervalued’ and in ever shorter supply:

Euro-Area Prices Decline Most in Year as ECB Mulls Easing

By Alessandro Speciale

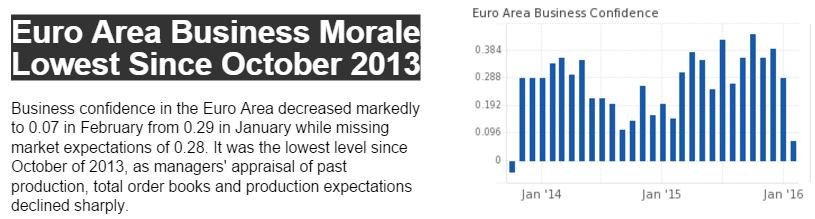
Feb 29 (Bloomberg) — The inflation rate in the 19-nation bloc declined to minus 0.2 from a positive reading of 0.3 percent in January,. Core inflation, which strips out volatile elements such as food and energy, was at 0.7 percent, down from 1 percent in the prior month. In Germany, the European Union- harmonized inflation rate dropped to minus 0.2 percent from 0.4 percent. The rate in France fell to minus 0.1 percent, while Spanish prices slid 0.9 percent. The ECB has already cut its deposit rate to minus 0.3 percent and is pumping 60 billion euros ($66 billion) a month into the economy via asset purchases.

Nothing good here:

The world’s top economies are set to declare on Saturday that they need to look beyond ultra-low interest rates and printing money if the global economy is to shake off its torpor, while promising a new focus on structural reform to spark activity.

A draft of the communique to be issued by the Group of 20 (G-20) finance ministers and central bankers at the end of a two-day meeting in Shanghai reflected myriad concerns and policy frictions that have been exacerbated by economic uncertainty and market turbulence in recent months.

“The global recovery continues, but it remains uneven and falls short of our ambition for strong, sustainable and balanced growth,” the leaders said in a draft seen by Reuters.

“Monetary policies will continue to support economic activity and ensure price stability … but monetary policy alone cannot lead to balanced growth.”

Geopolitics figured prominently, with the draft noting risks and vulnerabilities had risen against a backdrop that includes the shock of a potential British exit from the European Union, which will be decided in a June 23 referendum, rising numbers of refugees and migrants, and downgraded global growth prospects.

But there was no sign of coordinated stimulus spending to spark activity, as some investors had been hoping after the market turmoil that began 2016.

Germany had made it clear it was not keen on new stimulus, with Finance Minister Wolfgang Schaeuble saying on Friday the debt-financed growth model had reached its limits.

“It is even causing new problems, raising debt, causing bubbles and excessive risk taking, zombifying the economy,” he said.

This is from a story about Virginia’s claims for unemployment which are down even as the economy has weakened:

Colonna said the dip to 1974 levels in new unemployment claims is baffling since economic growth has been so sluggish in Virginia recently.

The state’s economy didn’t grow at all last year, U.S. Bureau of Economic Analysis data show.

And for the 12 months ended in July, the number of Virginians working rose by just 12,200, or 0.3 percent, the Virginia Employment Commission reports. The number who were unemployed declined by 33,000 – a figure that’s larger because it includes people who have stopped looking.

Part-time workers can’t always qualify for benefits when they are laid off, since to receive the minimum $60 a week unemployment benefit in Virginia, a person must have earned at least $3,000 during two of the previous five quarters.

And if income from any part-time job exceeds a laid-off person’s unemployment benefit, the state won’t pay the unemployment benefit. The maximum unemployment benefit in Virginia is $378, and the maximum time it is paid is 26 weeks. You can’t get the benefit if you are fired or quit your job.

GDP, Trade, Personal income and outlays, Consumer sentiment, China deficit spending, 7DIF, US surveys, German business morale

Revised up but for the worst reasons possible- unsold inventories were higher. Also, consumption expenditures were a bit lower, and note the deceleration of GDP growth on the chart. And in all likelihood Q1 GDP is now being reduced by inventory liquidation substituting for production:

GDP
er-2-26-1
Highlights
An upward revision to inventory growth made for an upward revision to the second estimate of fourth-quarter GDP, to an annualized plus 1.0 percent rate for a 3 tenths increase from the initial estimate. But, given slowing in demand during the quarter, the gain for inventories, at $81.7 billion vs an initial estimate of $68.6 billion, very likely reflects a build in unwanted inventories.

A clear negative in today’s report is a downgrade for personal consumption expenditures, to an annualized plus 2.0 percent in the quarter vs an initial estimate of 2.2 percent. Otherwise, revised readings are steady to unchanged with non-residential investment, hit by the mining and energy sectors, down at a 1.9 percent rate and exports down at an even steeper 2.7 percent rate. Residential investment remains the big plus, rising at an 8.0 percent rate. But final sales were slow in the quarter, up only 1.2 percent.

The economy, held down by weak exports and weak business investment, fumbled into year-end 2015, but the early outlook for the first quarter calls for a turn higher to trend growth, perhaps as much as 3 percent. Key data for the first quarter will be posted later this morning with the January personal income and expenditures report.

er-2-26-2
Worse than expected which means GDP is running that much less then expected:

International Trade in Goods
er-2-26-3
Highlights
In a report pointing to economic weakness, the nation’s trade gap in goods widened 1.2 percent in January to $62.2 billion as exports fell 2.9 percent to offset a 1.5 percent fall in imports (imports are a subtraction in the national accounts). Exports fell across the board including industrial supplies at minus 3.0 percent in the month and capital goods down 2.3 percent. The decline in imports included a steep 6.8 percent drop in industrial supplies and a 2.4 percent decline for capital goods. The declines in industrial supplies are tied in part to low prices for oil and petroleum products while the declines in capital goods points to lack of global confidence in the business climate and lack of business investment in global productivity. This report represents the goods portion of the monthly international trade report which will be posted next Friday.

Better than expected, as spending was up from a very low December and a weak q4 that was today further revised down. And note that these number as well are subject to revisions over the coming months, with the spending numbers somewhat at odds with sales reports.

Personal Income and Outlays
er-2-26-4
Highlights
There’s plenty of life in the consumer. Personal income jumped 0.5 percent in January as did consumer spending, both readings higher than expected. Also higher than expected are the report’s inflation readings especially the core PCE which rose 0.3 percent for a year-on-year plus 1.7 percent.

Details are solidly positive with components on the income side led by wages & salaries, up a very strong 0.6 percent for the third large gain of the last four months. And consumers didn’t draw from savings on their January shopping spree, with the savings rate unchanged at a very solid 5.2 percent.

Components on the spending side are led by durable goods which jumped 1.2 percent and reflect strong vehicle sales in the month. Spending on services rose 0.6 percent in the month.

But the big story of the report is the core PCE, especially the year-on-year rate which is up from 1.4 percent to 1.7 percent and is pointing confidently toward the Fed’s 2 percent line. Total prices, which include food and energy, rose only 1 percent but the year-on-year rate for this reading has been on a tear, moving from about zero late last year to plus 1.3 percent in January.

Economic news outside of the consumer has been soft but today’s report is a reminder that the nation’s most important supporter is alert and in the driver’s seat. A strong consumer, who is benefitting from a strong labor market, together with the upward pivot for inflation will not make policy makers comfortable at next month’s FOMC where a rate hike, though long dismissed, may be a serious topic of discussion.

er-2-26-5
er-2-26-6

China considers itself bound by that treaty too??? Good luck to them. 4% isn’t near high enough to replace the lost private sector credit growth needed to sustain output and employment:

China could raise budget deficit to 4% of GDP:central bank official

Feb 25 (China Daily) — China could raise its budget deficit to 4 percent of GDP or even higher to offsetthe impact of reduced fiscal revenue and to support broader reforms, a central bank official said. In an article published by “The Economic Daily,” director of the central bank’s surveys andstatistics department Sheng Songcheng said the deficit increase would not incur biginsolvency risks for the government. China raised its budget deficit to 2.3 percent of GDP in 2015, up from 2.1 percent in 2014. A3-percent deficit ratio, as stated in the 1992 Maastricht Treaty, is normally considered a redline not to be crossed.

My book intro talk in Germany:


er-2-26-7
er-2-26-8

Durable goods orders, KC fed, Mtg growth, GDP forecasts, ND cutback, Distillate demand

Nice headline, but charts looking like it’s just a ‘volatility’ in a down trend:

Durable Goods Orders
er-2-25-1
Highlights
The factory sector bounced back strongly in January, indicated first by last week’s industrial production report and now by durable goods orders which are up a very strong 4.9 percent. Aircraft did add to the gain but when excluding transportation equipment, durable orders still rose 1.8 percent. And core capital goods orders, which had been weakening, bounced back strongly with a 3.9 percent gain.

Machinery posted big gains in the month especially for new orders as did computers and fabricated metals. Motor vehicles showed strength in both orders and shipments.

Total shipments jumped 1.9 percent in the month, though shipments of core capital goods, held down by prior weakness in orders, fell 0.4 percent to open the first quarter on a down note. But a positive in the report is a 0.1 percent dip in inventories which, together with the rise in shipments, pulls down the inventory-to-shipments ratio to a leaner 1.64 from 1.67. And unfilled orders, after contracting sharply in December, inched 0.1 percent ahead in January.

This report is healthy but January’s strength may prove to be a one-hit wonder for a sector that is getting hurt by weak exports and perhaps by slowing domestic demand. Early indications on February’s factory conditions have been uniformly disappointing including Monday’s manufacturing PMI and Tuesday’s report from the Richmond Fed.

First, they aren’t even back to 2008 levels yet.

Second, the latest move up doesn’t even reverse the last move down.

Third, still looks to be trending down to me:
er-2-25-2
Again, absolute levels of orders for consumer goods remain depressed, even with the lower oil prices:
er-2-25-3
Not good:
er-2-25-4
er-2-25-5
Bad and worse than expected:

Kansas City Fed Manufacturing Index
er-2-25-6
er-2-25-7

Mortgage Growth Has Stalled And Homeowners Are To Blame

By John Carney

Feb 23 (WSJ) — Why isn’t mortgage debt growing? Lots of people would like to blame the banks for holding lending standards too tight. The banks often blame the regulators–for making them hold standards too tight. But it turns out that it may just be the fault of homeowners. They’re just paying down their mortgages far more than in the past. The latest report on household debt from the New York Fed shows that mortgage debt–the largest category of household debt– has been more or less flat since 2012. This is all the more surprising because home prices have been recovering at a brisk pace in recent years.

So it seems IMF (and Fed) forecasting hasn’t been so good…
er-2-25-8
er-2-25-9

The article above refers to Whiting Petroleum Corp whose shares are below $4 after exceeding $90 in the summer of 2014. The market cheered the firm’s decision to preserve capital rather than pump at a loss. Shares jumped 7% after hours.

er-2-25-10

New home sales, PMI services, Mtg purchase apps, Tsy yield

Challenging to put a good spin on this one, but they gave it their best shot, as the wheels are coming off at every turn:

New Home Sales
er-2-24-1
Highlights
A downturn out West helped pull new homes sales down a steep 9.2 percent in January to a lower-than-expected annualized rate of 494,000. The level, however, is still respectable given that there is no revision to December which stands at a very solid 544,000. Sales in the West, which is a key region for the new home market, fell 32 percent in the month which pulls down the region’s year-on-year rate to minus 24 percent. The South and Midwest show only marginal year-on-year contraction with the Northeast, the smallest new home region however, up sharply.

Price discounting seems to be at play as it was in yesterday’s existing home sales report. The median price fell 5.7 percent in the month to $278,000 for a year-on-year decline of 4.5 percent. Sales had been ahead of prices before this report but not anymore, with a nearly double-digit year-on-year pace now falling into contraction at minus 5.2 percent.

Supply has been very slow to enter the market, the result largely of constraints in the construction sector. But more new homes did enter the market in the month, up 2.1 percent to 238,000 and supply relative to sales, given the slowdown in sales, is up sharply, to 5.8 months vs 5.1 months.

The slope for the housing sector has been volatile but is trending upward. Price discounts will help boost sales but will also pull down home-price appreciation which has been a central area of strength for household wealth.

er-2-24-2
er-2-24-3
This is from the not so reliable survey organization that tends to overstate things. And it now has the service sector in contraction and the spin is bad as well:

PMI Services Flash
er-2-24-4
Highlights
In what could be a chilling indication of trouble ahead, the February flash for the service PMI slipped below breakeven 50 to 49.8 for the weakest reading since the government shutdown of October 2013.

New orders are still growing but at the slowest pace in nearly six years with contraction in backlog orders the most severe since early 2014. The 12-month outlook, though still positive, is the least positive in 5-1/2 years. Employment in the sample is still growing but for how long is a question. Price data are not favorable, with inputs down and growth in selling prices at a 5-month low.

The breakdown in the service sector, a breakdown however still isolated to this report, would leave the economy without a central point of strength. The declines here do suggest that domestic demand could be on the downswing and falling in line with sinking demand overseas.

er-2-24-5
These are up a bit this week but still depressed historically and the comps vs a year ago will soon get a lot tougher:
er-2-24-6
From the way the yield has been falling on the 10 year tsy seems market participants don’t see the same economic strength the Fed sees:
er-2-24-7

Richmond Fed, Existing home sales, Consumer confidence, Tsy statement, Tax receipts, Miles driven

Another worse than expected and details deteriorating as well:

Richmond Fed Manufacturing Index
er-2-23-1

er-2-23-2
A bit better than expected but not the price data, and as the chart shows it’s not going anywhere:

Existing Home Sales
er-2-23-3
Highlights
Existing home sales, up 0.4 percent in January to a 5.47 million annualized rate, held on to the bulk of December’s surge. Year-on-year sales growth is in the double digits, at 11.0 percent. In a sign of underlying household strength, the single-family component rose 1.0 percent to 4.86 million for a year-on-year 11.2 percent. Condos, which had been stronger of the two components, are now slowing, at 610,000 and down 4.7 percent for a year-on-year 8.9 percent.

Price data are soft which points to discounting. The median price fell 4.2 percent to $213,800 with the year-on-year rate at plus 8.2 percent. But supply, which has been very low and holding back sales, is coming into the market, up 3.4 percent in the month to 1.82 million. Supply relative to sales moved slightly higher, to 4.0 months which, however, is well below 4.5 months in January last year.

The housing market is sloping upward but not in bumpy away. Today’s report is moderate but constructive. Watch for new home sales on tomorrow’s calendar which are expected to fall back from prior strength.

er-2-23-4
Big drop here, which reflects consumer spending plans:

Consumer Confidence
er-2-23-5

So I’ve been told senior Tsy staffers have read my book. Hoping for the best!

US to push for greater fiscal spending at G20 -Treasury official

Feb 23 (Reuters) — The United States will call on G20 countries this week to use fiscal policy in order to boost global demand, a senior U.S. Treasury official said on Monday. “We will urge greater use of policy space, including fiscal space, to bolster global demand. That would lead to strengthened confidence and I would expect reduce volatility,” the Treasury official said in a preview call with reporters ahead of a G20 meeting later this week.

Two more signs a recession could be coming

By Jeff Cox

Feb 22 (CNBC) — The withholdings data show taxes taken out of worker paychecks and are considered by some economists to be a strong indicator of overall economic growth. Released daily by the Treasury Department, the count is a simple nonadjusted measure of how much wages are growing.

The latest numbers showed a 0.2 percent annualized decline over the past four weeks, compared to growth rates of 2 percent in December and 3 percent in January, according to market research firm TrimTabs.

The data show “the U.S. economy is already stalling out,” TrimTabs CEO David Santschi said.

Moving up:
er-2-23-6

Chicago Fed, Euro portfolio shifts, Startups, Jan mtg data, PMI manufacturing

This is volatile so best to go by the 3 mo moving average, as shown on the chart:

Chicago Fed National Activity Index
er-2-22-1
Highlights
Doubts over the outlook may be building but January was a solid month for the economy as the national activity index rose to plus 0.28 from a revised minus 0.34 in December. The gain lifts the 3-month average to minus 0.15 from minus 0.30. It was a jump in industrial production that led January’s charge, lifting the production component which contributed 0.27 to the headline after pulling it down by 0.38 in December. Gains in vehicle production were a highlight of the industrial production report which also got a boost from a weather-related swing higher for utility output. Employment also added to January’s headline but less so from December’s outstanding strength, to plus 0.12 from plus 0.16. Sales/orders/inventories were little changed at minus 0.03 with personal consumption & housing unchanged at minus 0.08. The readings in this report, though in general favorable, are mixed with the current month pointing to above-trend historical growth but not the 3-month average which points to below average growth.

er-2-22-2
So it reads like euro based portfolios have been shifting assets to other currencies etc. as previously discussed, even as their liabilities remain in euro:
er-2-22-3
Startups can be a meaningful source of ‘borrowing to spend’ which offsets ‘savings desires’ however most recently it’s going the wrong way:
er-2-22-4

Black Knight Financial Services’ First Look at January Mortgage Data: Delinquencies Up Sharply; Prepayment Rate Drops

– Delinquency rate up 6.6 percent in January; back above 5 percent nationally for the first time in 11 months

– Prepayment rate (historically a good indicator of refinance activity) dropped 29 percent to its lowest level since February 2014

– Foreclosure sales (completions) up nearly 16 percent following holiday moratoriums

– Active foreclosure inventory continues to decline; down 26 percent from last year

According to Black Knight’s First Look report for January, the percent of loans delinquent increased 6.6% in January compared to December, and declined 7.1% year-over-year.

Worse than expected again. And this is the one that’s be overstating things:

PMI Manufacturing Index Flash
er-2-22-5

Cash crunch, State taxes, Income and expendures

It’s all going the wrong way now, with fewer proactively spending more than their incomes to ‘offset’ those desiring to spend less than their incomes. That is, as previously discussed, the private sector tends to be highly pro cyclical:

Online lenders see cash crunch

By Jon Marino

Feb 19 (CNBC) — A cash crunch is impeding the online lending industry’s growth as the cost of borrowing grows, funds become increasingly scarce and ratings agencies maintain a cautious outlook toward the space.

Next, start-ups that have grown into unicorns originating billions of dollars’ worth of loans may find themselves doing less lending or, conversely, putting more of their loans onto their own books.

The asset-backed securities market is slowing and issued a meager $40 billion in January — the lowest total since at least 2012, according to Dealogic data — and generated a paltry $10 billion in ABS loans in February. In terms of deal volume, ABS deals in 2016 have also dropped to lows the market has not seen for years.

States not doing so well?
er-2-21-1
er-2-21-2
er-2-21-3
This is only through July:
er-2-21-4
It’s not wrong to think of expenditures as the source of income, as this chart seem to indicate:
er-2-21-5

Distillate demand, WRKO interview, CPI

Looks like the lower oil prices have not increased US demand:
er-2-19-1
Interview:

Warren Mosler (Federal Reserve And OECD)

First, CPI is historically very low.

Second, the deflationary influence of lower energy prices is still working its way through the economy.

Third, the chart looks to me like it’s still working it’s way lower

Fourth, core CPI is useful as a forecasting tool but the Fed’s mandate is headline inflation:

Y/Y:
er-2-19-2

Consumer Price Index
er-2-19-3
Highlights
Consumer prices are on the rise and the Fed’s December rate hike doesn’t look misplaced at all. Core price jumped 0.3 percent in January which beats Econoday’s top-end estimate with the year-on-year rate up 1 tenth to plus 2.2 percent. The Bureau of Labor Statistics notes a “lack of declines” across core readings. When including energy, however, and also food, total prices were unchanged in the month though the year-on-year rate literally surged, up 7 tenths to plus 1.4 percent.

Services are the center of the economy’s strength and prices are rising, led by medical care which jumped 0.5 percent in the month for a year-on-year plus 3.0 percent. The subcomponent for prescription drugs also rose 0.5 percent. Shelter rose 0.3 percent in the month as did rent while owner’s equivalent rent rose 0.2 percent. Away-from-home prices jumped 2.0 percent.

Goods prices are mixed with apparel jumping 0.6 percent in the month but with energy down 2.8 percent and gasoline down 4.8 percent. Food prices were unchanged. The only core reading showing any contraction was home furnishings and only at minus 0.1 percent. New vehicles rose 0.3 percent with used vehicles up 0.1 percent. Airfares were especially hot, up 1.2 percent in the month.

These results may prove to be a game changer for the FOMC, pointing to pressure for next week’s PCE price data and perhaps reviving chances for a March FOMC rate hike.

er-2-19-4

Architectural Billings, JPM chart, GDP forecasts

Down into contraction:

From the AIA: Slight Contraction in Architecture Billings Index

Following a generally positive performance in 2015, the Architecture Billings Index has begun this year modestly dipping back into negative terrain. As a leading economic indicator of construction activity, the ABI reflects the approximate nine to twelve month lead time between architecture billings and construction spending. The American Institute of Architects (AIA) reported the January ABI score was 49.6, down slightly from the mark of 51.3 in the previous month. This score reflects a minor decrease in design services (any score above 50 indicates an increase in billings). The new projects inquiry index was 55.3, down from a reading of 60.5 the previous month.

er-18-1
er-18-2
er-18-3

Posted in GDP