Empire State Manufacturing, China Power Usage, Stock Buy Backs

The recession continues:

Empire State Mfg Survey
er-11-17-1
Highlights
Negatives are beginning to run in Empire State with the index at minus 10.74 in November, right in line with the prior four readings and well below the Econoday consensus for minus 5.00. Several components are showing extended weakness including unfilled orders, at minus 18.18 for the lowest reading of the year, and also the workweek, at minus 14.55 for a fifth straight decline and the weakest run since mid 2013. With unfilled orders down and the workweek down, it’s no surprise that employment is down, at minus 7.27 for a third straight loss and the weakest streak since late 2009. And prices, even outside of energy and commodities, are not helped by weak demand with prices for final goods at minus 4.55 for a third straight decline and the longest run of contraction since early 2013.

Good news is hard to find but there is easing weakness in new orders, at minus 11.82 vs October’s minus 18.91, and in shipments as well, at minus 4.10 vs minus 13.61. Still, this is the sixth straight decline for new orders and the fourth straight for shipments. Manufacturers are keeping their inventories down while delivery times, reflecting the weakness in shipments, are speeding up.

This report is the first indication on November’s factory sector and it points to another run of weak regional reports, starting Thursday with the Philly Fed. The factory sector, hit by weak exports and in contraction for a full year, is becoming perhaps the economy’s Achilles heal — and also perhaps a dovish wildcard for the December FOMC.

er-11-17-2
er-11-17-3
Power usage has been a reasonable growth indicator:

China’s power use drops slightly in Oct.

Nov 16 (Xinhua) — China’s electricity consumption edged down 0.2 percent to 449.1 billion kilowatt hours (kwh) in October. In the first ten months, power use rose 0.7 percent from a year earlier to 4.58 trillion kwh. China’s value-added industrial output of the electricity, heating, gas and water sectors lost 0.3 percent in October, while September saw 0.7-percent growth. Electricity use in the service sector rose 7.1 percent in the first ten months, the agricultural sector posted a 3.0 percent increase, while use by the industrial sector dropped 1.1 percent from a year earlier, the NEA said.

So seems the new corporate debt is largely going towards stock buy backs, substituting debt for equity on the balance sheets, leaving corps more leveraged than otherwise:
er-11-17-4
er-11-17-5

Trucking Tonnage, Earnings Per Share

ATA Truck Tonnage Index Fell 0.9% in August

AAmerican Trucking Associations’ advanced seasonally adjusted For-Hire Truck Tonnage Index declined 0.9% in August, following a revised increase of 3.1% during July. In August, the index equaled 134.2 (2000=100), down from 135.3 in July. The all-time high of 135.8 was reached in January 2015.

Compared with August 2014, the SA index increased 2.1%, which was below the 4% gain in July. Year-to-date through August, compared with the same period last year, tonnage was up 3.3%.

After such a robust July, it is not too surprising that tonnage took a breather in August,” said ATA Chief Economist Bob Costello. “The dip after a strong gain goes with the up and down pattern we’ve seen this year.”

Costello said a few factors hurt August’s reading, including soft housing starts and falling factory output.

“As I said last month, I remain concerned about the high level of inventories throughout the supply chain. This could have a negative impact on truck freight volumes over the next few months,” he said.

eps-gdp-trends

Spain, QE chart, Wholesale trade, UK and France industrial production, Import and export prices

Fyi, we will be in Spain next week.

Here are some of the details:

There is a newly formed MMT Group in Spain called APEEP which stands for “Asociación para el Pleno Empleo y la Estabilidad de Precios”.

In an effort to bring MMT into the political debate in Spain, they will be hosting me for a presentation of the Spanish translation of “The Seven Deadly Innocent Frauds of Economic Policy”, starting with a presentation in Madrid on the 14th of September, Valencia on the 15th of September, and Vila-real on the 17th of September.

Here are links for the events, including time/date/location

14th September Madrid
15th September Valencia
17th September VilaReal

And this is the press release for the events containing more details.

Also:

Asociación Para el Pleno Empleo y la Estabilidad de Precios (APEEP) (Association for Full Employment and Price Stability), is a non-profit organization devoted to raising awareness and disseminating Modern Monetary Theory amongst the Spanish public. APEEP believes that full employment and price stability are compatible if public policy is conducted within an MMT framework. The current economic crisis within the Eurozone highlights the need for a Post Keynesian and MMT approach to public policy.

You’d think by now word would be out it’s just a placebo, but ancient beliefs tend to linger on…
er-9-10-1
Not good- sales down and inventories remain elevated:

United States : Wholesale Trade
er-9-10-2

Highlights
Factory inventories held stable in July as did wholesale inventories, down 0.1 percent against a 0.3 percent decline in sales that leaves the stock-to-sales ratio unchanged at 1.30. Wholesale inventories look light for machinery and apparel but heavy for farm products and metals.

The nation’s inventories are heavier than they were last year which may limit future production and hiring. Next data on inventories will be the business inventories report on Tuesday.

MONTHLY WHOLESALE TRADE: SALES AND INVENTORIES July 2015 Sales. The U.S. Census Bureau announced today that July 2015 sales of merchant wholesalers, except manufacturers’ sales branches and offices, after adjustment for seasonal variations and trading-day differences but not for price changes, were $449.5 billion, down 0.3 percent (+/-0.5)* from the revised June level and were down 4.2 percent (+/-1.4%) from the July 2014 level. The June preliminary estimate was revised upward $1.0 billion or 0.2 percent.

This chart is now looking a lot like prior recessions:
er-9-10-3

Inventories/Sales Ratio. The July inventories/sales ratio for merchant wholesalers, except manufacturers’ sales branches and offices, based on seasonally adjusted data, was 1.30. The July 2014 ratio was 1.19.
er-9-10-4

Great Britain : Industrial Production
er-9-10-5
France : Industrial Production
er-9-10-6
United States : Import and Export Prices
er-9-10-7

None of this is considered the ‘some improvement’ Chairman Yellen was looking for going into the Fed meeting next week…

Mortgage Purchase Apps, EU Retail Sales, Payroll Tax, ADP, Trade, Equity Comment

While still historically very low, purchase apps are now way up over last year’s particularly depressed levels. Some are replacing all cash buyers, but the increase is also in line with increased existing home sales.

While new home sales were soft, turnover of existing homes has been increasing, and while not directly increasing GDP, existing home sales are generally associated with purchases of furniture, appliances, and other home improvements, and of course real estate commissions.

MBA Mortgage Applications
er-8-5-1

Highlights
A drop in rates helped boost mortgage activity in the July 31 week both for home purchases, up 3.0 percent in the week, and for refinancing which rose 6.0 percent. The strength in purchase applications, which are up 23 percent vs this time last year, is a positive indication for home sales. The average 30-year fixed mortgage for conforming loans ($417,000 or less) fell 4 basis points in the week to 4.13 percent.

er-8-5-2

EU retail sales

European Union : Retail Sales
er-8-5-3

Highlights
Retail sales were surprisingly weak in June. A 0.6 percent monthly fall was the first decline since March and followed a slightly smaller revised 0.1 percent rise in May. Annual workday adjusted growth of purchases was 1.2 percent, down from 2.6 percent in both mid-quarter and April.

June’s setback was primarily attributable to a 0.8 percent monthly drop in sales of food, drink and tobacco. Non-food products, excluding auto fuel, were off only 0.2 percent, although even this was enough to wipe out May’s entire rise. Fuel purchases were flat on the month after a 0.2 percent dip last time.

Regionally, headline weakness was dominated by a 2.3 percent monthly slump in Germany although Spain (minus 0.4 percent) also struggled. More promisingly, France (0.1 percent) saw sales increase for a third consecutive period and there were decent gains in Austria (1.3 percent), Belgium, Latvia and Lithuania (all 0.8 percent) and Estonia (0.7 percent).

The June data make for a second quarter increase in Eurozone retail sales of only 0.3 percent, less than a third of the rate achieved in the previous period and just half of the fourth quarter pace. This does not bode well for real GDP growth. Moreover, the EU Commission’s economic sentiment survey found consumer sentiment falling in July so it may be that the third quarter got off to a less than robust start too. That said, Greek developments are clearly having some impact and a more concrete resolution of the crisis there might be enough to get households happy to spend again.

Big drop in Federal withholding:

er-8-5-4

Lower than expected, and June revised down a bit as well, all in line with many recent surveys:

ADP Employment Report
er-8-5-5

Mark Zandi, chief economist of Moody’s Analytics, said, “Job growth is strong, but it has moderated since the beginning of the year. Layoffs in the energy industry and weaker job gains in manufacturing are behind the slowdown. Nonetheless, even at this slower pace of growth, the labor market is fast approaching full employment.”
Read more at Calculated Risk Blog

About as expected with last month’s revision:

United States : International Trade
er-8-5-6

Seems the drop in oil prices has been offset by non oil imports, as the trade deficit is looking somewhat wider:

er-8-5-7

Both exports and imports are down which indicates a weakening global economy:

er-8-5-8

The chart shows the trend of the non petroleum deficit has resumed it’s increase:

The blue line is the total deficit, and the black line is the petroleum deficit, and the red line is the trade deficit ex-petroleum products (wild swings earlier this year were due to West Coast port slowdown).
Read more at Calculated Risk Blog
er-8-5-9


Didn’t know we exported any consumer goods!
;)

Exports (Exhibits 3, 6, and 7) Exports of goods decreased $0.2 billion to $127.6 billion in June. Exports of goods on a Census basis decreased $0.5 billion. • Capital goods decreased $0.8 billion. o Telecommunications equipment decreased $0.3 billion. • Industrial supplies and materials decreased $0.6 billion. o Finished metal shapes decreased $0.3 billion. Consumer goods increased $0.8 billion.

Stocks up because jobs were weak and a fed spokesman thought the economy was too weak for a rate hike. ;)

Futures jump on ADP miss, Powell comments

By Jenny Cosgrave

August 5 (CNBC)

er-8-5-10

Railcar traffic, Draghi statement, NY manufacturing survey, Industrial production, Consumer confidence

Rail Week Ending 09 May 2015: Data Still Not Pretty. Rail Softness Continues.

(Econintersect) — Week 18 of 2015 shows same week total rail traffic (from same week one year ago) declined according to the Association of American Railroads (AAR) traffic data. Intermodal traffic improved, which accounts for half of movements – but weekly railcar counts goes deeper into contraction.

This analysis is looking for clues in the rail data to show the direction of economic activity – and is not necessarily looking for clues of profitability of the railroads. The weekly data is fairly noisy, and the best way to view it is to look at the rolling averages which generally are in a weak growth cycle.

er-5-15-1
er-5-15-2
A summary of the data from the AAR:

The Association of American Railroads (AAR) today reported U.S. rail traffic for the week ending May 9, 2015.

For this week, total U.S. weekly rail traffic was 551,034 carloads and intermodal units, down 2.3 percent compared with the same week last year.

Total carloads for the week ending May 9, 2015 were 273,433 carloads, down 7.9 percent compared with the same week in 2014, while U.S. weekly intermodal volume was 277,601 containers and trailers, up 3.8 percent compared to 2014.

Four of the 10 carload commodity groups posted increases compared with the same week in 2014. They include: motor vehicles and parts, up 8.9 percent to 18,997 carloads; petroleum and petroleum products, up 6.1 percent to 15,464 carloads; and miscellaneous carloads, up 3.6 percent to 9,220 carloads. Commodity groups that saw decreases during this one week included: coal, down 16.1 percent to 93,691 carloads; metallic ores and metals, down 12.1 percent to 23,572 carloads; and grain, down 11.2 percent to 17,959 carloads.

For the first 18 weeks of 2015, U.S. railroads reported cumulative volume of 5,043,559 carloads, down 1.8 percent from the same point last year; and 4,679,513 intermodal units, up 1.7 percent from last year. Total combined U.S. traffic for the first 18 weeks of 2015 was 9,723,072 carloads and intermodal units, a decrease of 0.1 percent compared to last year.

North American rail volume for the week ending May 9, 2015 on 13 reporting U.S., Canadian and Mexican railroads totaled 368,931 carloads, down 7.5 percent compared with the same week last year, and 350,845 intermodal units, up 3.2 percent compared with last year. Total combined weekly rail traffic in North America was 719,776 carloads and intermodal units, down 2.6 percent. North American rail volume for the first 18 weeks of 2015 was 12,681,610 carloads and intermodal units, up 1 percent compared with 2014.

Here we go. This kind of thing previously had caused the euro to fall vs the dollar. If it doesn’t happen this time there’s a serious problem brewing. And right now the euro is up on the day…

Draghi helps stocks

Aside from individual stocks, sentiment received a boost from the ECB on Friday. Draghi said Thursday that the central bank will “implement in full” its bond-buying program and it will stay in place “as long as needed.”

“While we have already seen a substantial effect of our measures on asset prices and economic confidence, what ultimately matters is that we see an equivalent effect on investment, consumption and inflation,” Draghi said, according to the text of a speech delivered in Washington.

“To that effect, we will implement in full our purchase program as announced and, in any case, until we see a sustained adjustment in the path of inflation.”
er-5-15-3
Empire State Mfg Survey
er-5-15-4
Highlights
The first indication on May conditions in the manufacturing sector is soft, as indications have been all year. The Empire State index came in at 3.09, below what were already weak Econoday expectations for 5.00. Shipments look respectable at 14.94 but are way ahead of new orders, at only 3.85, and even further ahead of backlog orders which are in deep contraction at minus 11.46. Employment growth is down as is the 6-month outlook, both pointing to a lack of optimism.

Price readings in this report stand out, pointing to even less pressure than in April with input cost inflation very subdued, down nearly 10 points to 9.38, and with virtually no price traction at all for finished goods, at only 1.04.

The manufacturing sector, hurt in part by weak exports, looks to be more and more of a drag at a time when economic growth is supposed to be on a springtime rebound. Next indication on the May manufacturing sector will be next Thursday with the Philly Fed report. Later this morning the industrial production report will offer the first definitive data on the April manufacturing sector.

er-5-15-5

This is bad too:

Industrial Production
er-5-15-6
Highlights
Industrial production is stalling, down 0.3 percent in April for a 5th straight monthly contraction. Factories are cutting back with capacity utilization down 4 tenths to 78.2 percent. And the manufacturing component, which has been flat to negative all year, is unchanged. All these readings are at or near the Econoday low-side forecasts.

Among manufacturing subcomponents, consumer goods output fell 0.3 percent with business goods down 0.4 percent. Construction supplies rose only fractionally but at 0.1 percent the reading is the best all year (this a reminder of how weak construction and housing has been). A positive is a second strong month for auto output, up 1.3 percent on top of March’s 4.3 percent surge, but whether output increases further will depend on auto sales which, in yesterday’s retail sales report, turned lower in April.

The two other main components in today’s report show even greater weakness with mining, hurt by oil & gas, at minus 0.8 percent for the 6th contraction in 7 months and utilities at minus 1.3 percent for a 2nd straight decline.

The industrial economy remains flat and is holding down what is supposed to be the economy’s springtime bounce. The news from the factory sector, including this morning’s Empire State report, won’t be pulling forward expectations for the Fed’s first rate hike.
er-5-15-7

Even this has suddenly broken:

Consumer Sentiment
er-5-15-8
Highlights
Consumer confidence had been holding, as the FOMC assured us just a couple of weeks ago, at high levels, but perhaps less so now with the consumer sentiment index at 88.6 which is nearly 5 points below Econoday’s low-side forecast. Both components show weakness with current conditions down 7.2 points to 99.8 and expectations down 7.3 points to 81.5. These are the lowest readings since October and November of last year.

At the same time that confidence is going down, inflation expectations, reflecting rising gasoline prices, are going up. Expectations 1-year out are up 3 tenths to 2.9 percent while expectations 5-years out are up 2 tenths to 2.8 percent. Despite the turn higher, however, these are still low levels.

The drop in current conditions hints at softness in this month’s jobs market while the drop in expectations is a downgrade for the outlook on jobs. The hawks at the Fed have been anticipating, perhaps over anticipating, that strong consumer confidence levels would eventually translate to gains for retail sales. Retail sales have been flat along and now consumer confidence, based at least on today’s consumer sentiment report, is moving backwards.
er-5-15-9
Of the nearly 1.6 million loan originations in Q1, 471,822 were purchase loan originations, down 25% from the prior quarter and up less than 1% from a year ago. There were 1,080,043 refinance originations in Q1, an increase of 6% from the prior quarter and 27% from a year ago.

mtg purchase apps down again, Earnings, Greece chart, gasoline demand

Not good. Purchase apps back down to depressed levels after a dip in front of govt mortgage fee cuts followed by a small blip up after the cuts, and up only 1% from last year’s cold winter depressed levels:

MBA Purchase Applications
mba-purch-2-6
Highlights
The purchase index fell 7.0 percent in the February 6 week for the 4th straight fall but still remains in the plus column on a year-on-year basis, but only by plus 1.0 percent. The refinance index, which unlike the purchase index has been showing life, fell back 10.0 percent in the week. Rates have been very low but did move higher in the week, up 5 basis points to an average 3.84 percent for conforming loans ($417,000 or less).

mba-purch-2-6-graph
Earnings note:

4Q14 earnings season is winding down and growth is slowing. After running close to +5% on a YoY basis, S&P operating earnings growth is now down to 3.5% and revenue growth is down to 1.3%
greece-gdp

Gasoline demand down this week but may be moving up slightly vs last year but hard to say underlying demand is higher given last year’s extra cold winter
gas-demand-52wma

NFIB, Mtg apps, retail sales, Empire State

Today’s releases are causing analysts to reduce their GDP forecasts for Q3, which ended Sept 30. Note the difficulty in forecasting the past when considering the difficulty in forecasting the future…

This was released yesterday, turned down from not so good levels:

NFIB Small Business Optimism Index


Full size image

Mtg purchase apps down and cash sales down as well, makes it problematic for total sales to rise?

MBA Purchase Applications


Highlights
The steep drop underway in mortgage rates is sharply stimulating demand for refinancing but isn’t yet doing much for home purchases. The refinancing index surged 11.0 percent in the October 10 week as the average rate for conforming loans ($417,000 or less) fell 10 basis points in the week to 4.20 percent which is the lowest average since June last year. But in contrast, the purchases index fell 1.0 percent in the week for a year-on-year decline of 4.0 percent.


Full size image

Bank mtg lending way down from a year ago, flattish this year:

At Wells Fargo and Chase, mortgage lending inches up

By Ruth Mantell

Oct 14 (MarketWatch) — Wells Fargo the country’s No. 1 mortgage originator, said it made $48 billion in new home loans in the third quarter, a hair up from the prior quarter, and down 40% from the year-earlier period. Meanwhile, J.P. Morgan Chase JPM the second-largest mortgage lender, said its third-quarter originations hit $21 billion, up from $17 billion in the second quarter, and down 48% from a year earlier. Some qualified borrowers can’t get a mortgage because of many lenders’ strict standards that aim to shield banks from the financial risks that come with the possibility of having to buy back a questionable loan, said John Stumpf, chairman and chief executive at Wells, on aTuesday conference call.

Recall last month when retail sales were up an unexpected .6% I wrote about how 13 state had tax holidays in August which may have moved sales forward from September, which just came out weaker than expected at -.3%, leaving the down trend intact:

Retail Sales


Highlights
As expected, auto sales and gasoline sales tugged down on retail sales in September. But core numbers were weaker than expected. Retail sales in September declined 0.3 percent after jumping 0.6 percent in August. Analysts forecast a 0.1 percent dip for September. Excluding autos, sales slipped 0.2 percent after gaining 0.3 percent in August. Expectations were for a 0.3 percent increase. Excluding both autos and gasoline sales dipped 0.1 percent, following a jump of 0.5 percent in August. Expectations were for 0.5 percent.

Within the core, softness was seen in declines furniture & home furnishings, building materials, nonstore retailers, clothing & accessories, and sporting goods & hobbies. Gains were posted for electronics & appliances (likely iPhones), health & personal care, general merchandise, and food services & drinking places.

Today’s report is very mixed. It was not surprising that a downswing in autos after a strong August pulled down sales. And the same was expected for gasoline prices pulling down sales. But core sales eased despite a surge in electronics sales. Core sales eased after a very strong August. On a very positive note, food services & drinking places gained a robust 0.6 percent, matching the pace for August.

I don’t put much stock in these as they seem to follow the stock market, as this exceptional drop seems to confirm. Or maybe the stock market leads weakness…

Another look at Q3 GDP

Third-Quarter Growth in U.S. Revised Higher on Services

By Victoria Stilwell

Decmeber 20 (Bloomberg) — The economy expanded in the third quarter at the fastest rate in almost two years as Americans stepped up spending on services such as health care and companies invested more in software.

Jump in healthcare??? And the software gain was the new ‘intellectual’ category.

Gross domestic product climbed at a revised 4.1 percent annualized rate, the strongest since the final three months of 2011 and up from a previous estimate of 3.6 percent, Commerce Department data showed today in Washington. The gain exceeded the most optimistic projection in a Bloomberg survey.

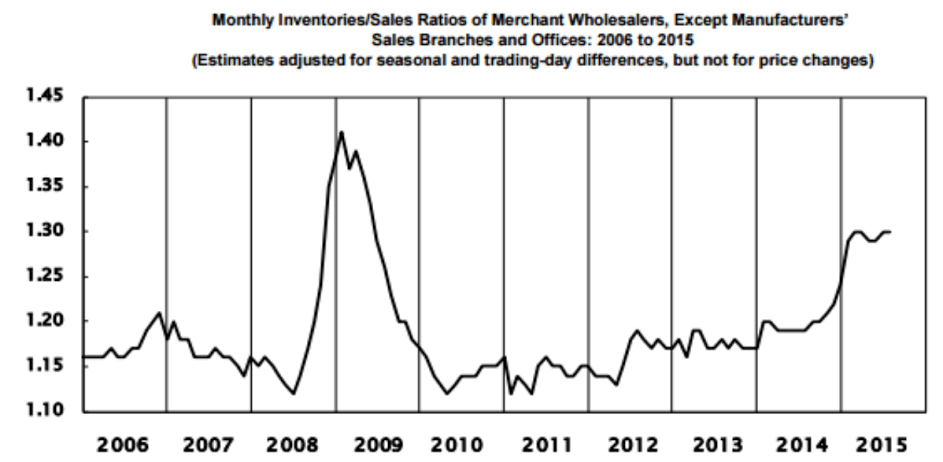
Inventories accounted for a third of the increase in GDP in the third quarter, showing companies were confident about the prospects for demand. Stronger retail sales in October and November underscore the Federal Reserves view that the worlds largest economy is improving.

Right, a boom in unsold inventories. Especially cars, where the inventory was on the high side even for the November spike in sales to 16.4 million (annual rate) from a shutdown depressed 15.2 million for October. And it looks like December total vehicle sales are back down below the two month average, which means the inventory to sales ratio is even worse. No surprise Jan auto production cutbacks have already been announced.

You have equity markets supporting household net worth, rising home values and also payroll gains and falling unemployment, so we do really look for consumption to start picking up, said Robert Rosener, associate economist at Credit Agricole CIB in New York, whose forecast for growth of 3.8 percent was the highest in the Bloomberg survey. This is a very good sign for momentum going into the fourth quarter.

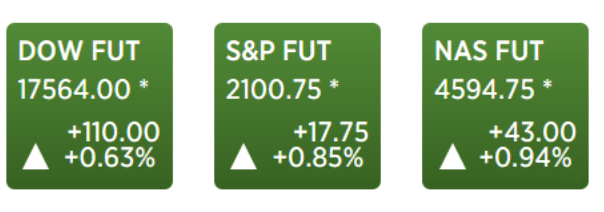
The median forecast of 72 economists surveyed by Bloomberg projected a 3.6 percent gain in GDP, the value of all goods and services produced in the U.S. Forecasts ranged from 3.3 percent to 3.8 percent. Stocks rose after the figures, with the Standard & Poors 500 Index advancing 0.6 percent to 1,820.78 at 11:46 a.m. in New York.

Services Spending

Consumer purchases, which account for almost 70 percent of the economy, increased 2 percent, more than the previously reported 1.4 percent, the revised data showed.

Better but still weak year over year, and, again, healthcare spending of some sort accounted for much of the upward revision.

Spending on services contributed 0.32 percentage point to third-quarter growth, up from a previously reported 0.02 percentage point. In addition to the pickup in outlays for health care, Americans spent more on recreational services.

Outlays for non-durable goods climbed at a 2.9 percent rate in the third quarter, led by more spending on gasoline.

Inventories increased at a $115.7 billion annualized pace in the third quarter, the most in three years, after a previously reported $116.5 billion annualized rate. In the second quarter, they rose at a $56.6 billion pace.

Stockpiles added 1.67 percentage points to GDP last quarter, little changed from the 1.68 percentage-point contribution in the previous reading.

More Optimistic

While economists grew more optimistic about demand in the fourth quarter, GDP will nonetheless be restrained as the pace of inventory growth cools.

JPMorgan Chase & Co. economists project the economy will grow 2 percent from October through December, up from the 1.5 percent rate they had penciled in prior to the Commerce Departments Dec. 12 retail sales report. Barclays Plc has raised its fourth-quarter tracking estimate to 2.3 percent from 2 percent before the retail figures.

Domestic final sales, which exclude inventories, increased 2.5 percent in the third quarter compared with a previously reported 1.9 percent increase.

Corporate spending on equipment rose 0.2 percent, compared with a previous reading of no change. Business investment in intellectual property was revised up to a 5.8 percent increase from 1.7 percent, reflecting more spending on software.

Further investment will depend on how much confidence companies have that the economy will accelerate.

Capital Spending

Honeywell International Inc., whose products range from cockpit controls to thermostats, expects capital expenditures in the range of $1.2 billion or more in 2014, up about 30 percent from this year.

Were very disciplined in terms of cap-ex, Chief Financial Officer David Anderson said on the companys 2014 guidance call on Dec. 17, referring to capital expenditures. We really have to see the whites of the eyes of the economic return characteristics to really commit.

Economic indicators are pointing to just a continued resilience, not exuberance, but resilience and expansion in the U.S. economy, Anderson added.

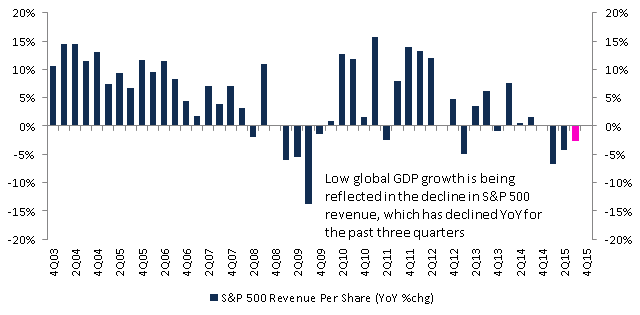
Todays report also included corporate profits. Before-tax earnings rose at a 1.9 percent rate after climbing at a 3.3 percent pace in the prior period. They increased 5.7 percent from the same time last year.

Profit growth continues to slow, even with the higher GDP.

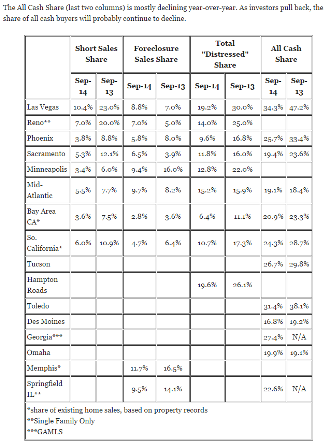
Residential real estate is underpinning the economy, as rising prices boost household wealth and growing demand helps the industry overcome rising mortgage rates.

Home Construction

Home construction increased at a 10.3 percent annualized rate in the third quarter. While slower than the 13 percent pace previously reported, the figure primarily reflected revisions to brokers commissions and other ownership transfer costs, todays report showed.

Data from the Commerce Department this week showed that housing starts jumped 22.7 percent to a 1.09 million annualized rate, the most since February 2008, while permits for future projects also held near a five-year high, indicating that the pickup will be sustained into next year.

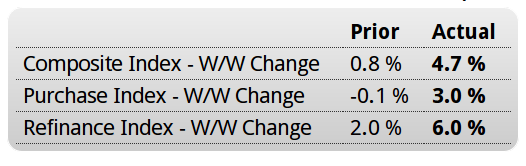
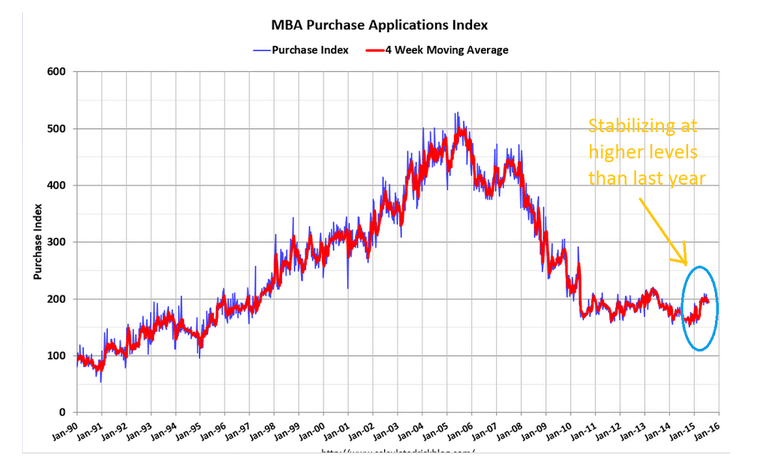
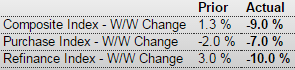
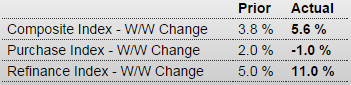
Slower growth in home construction and most homebuilders reporting flattish sales, especially after mortgage rates went up, and mortgage purchase apps continue to be down about 10% from last year as well. Let me suggest that 22% jump of the initial release of November housing starts seems suspect as there are no reports of a leap higher in home sales or construction from the housing companies or mortgage originators. And permits were in fact down.

Other signs show that fiscal drag, which weighed on growth during 2013, will start to ease. U.S. lawmakers this week passed the first bipartisan federal budget produced by a divided Congress in 27 years, easing $63 billion in automatic spending cuts and averting another government shutdown.

Yes, it could have been worse, but a variety of tax cuts do expire at year end, as do extended unemployment benefits. But the bottom line is the federal deficit (the ‘allowance’ the economy gets from Uncle Sam) is likely to fall to under $500 billion in 2014, after falling from just under $1 trillion in 2012 to just over 600 billion in 2013. And worse, the automatic stabilizers are extremely aggressive this time around, where 2% growth cuts the deficit maybe by as much as 4% growth cut it in past cycles.

Government outlays increased 0.4 percent in the third quarter, led by a 1.7 percent gain in state and local spending that was the same as the previous reading. Federal spending decreased 1.5 percent.

They fail to mention that state and local tax receipts also rose, so overall the closing of the state and local budget deficits from the recession means there is less fiscal support from the states.

Tighter fiscal policy has made stimulating the U.S. economy even more of an uphill battle for the Fed. The central bank this week announced it would scale back its bond-purchase program by $10 billion, to $75 billion a month, after seeing an improved outlook for the labor market.

This has been done in the face of a very tight, unusually tight fiscal policy for a recovery period, Chairman Ben S. Bernanke said Dec. 18 during a press conference at the conclusion of a meeting of the Federal Open Market Committee.

I’m hoping for a good economy as well, but with housing and cars- the main engines of domestic credit growth- coming off the boil, and Uncle Sam’s allowance payments to the economy (deficit spending) down to less than $50 billion/mo (3% of GDP%) and falling from closer to $80 billion/mo not long ago, seems to me the jury is still out.

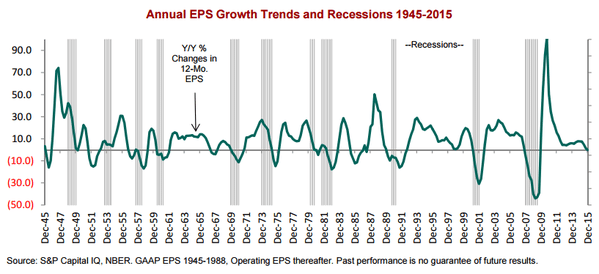
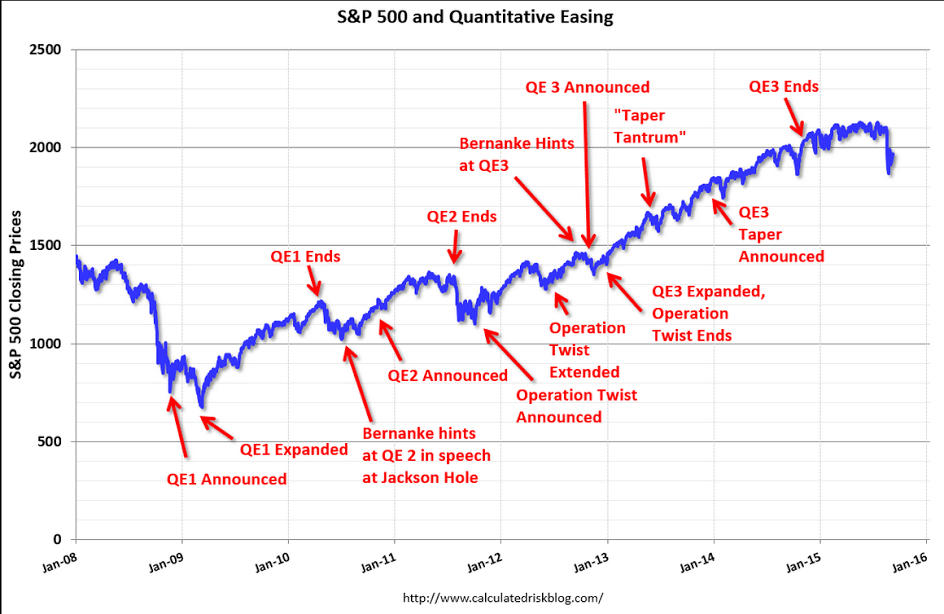
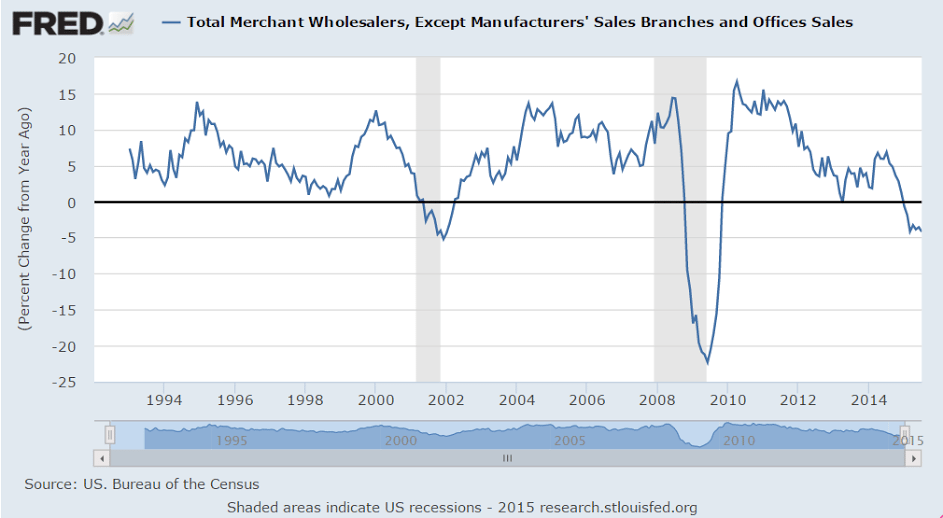
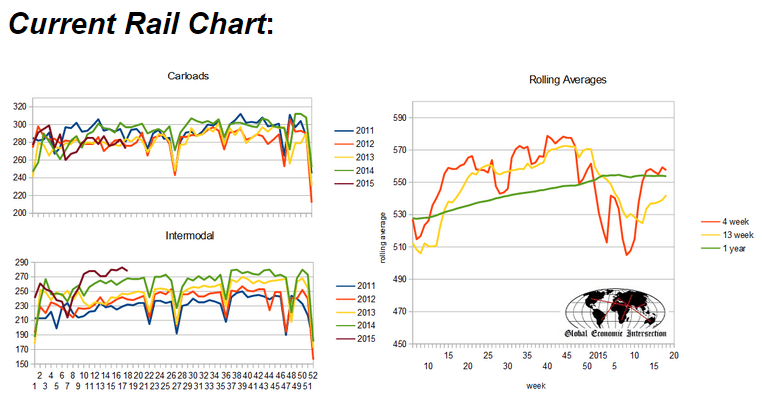
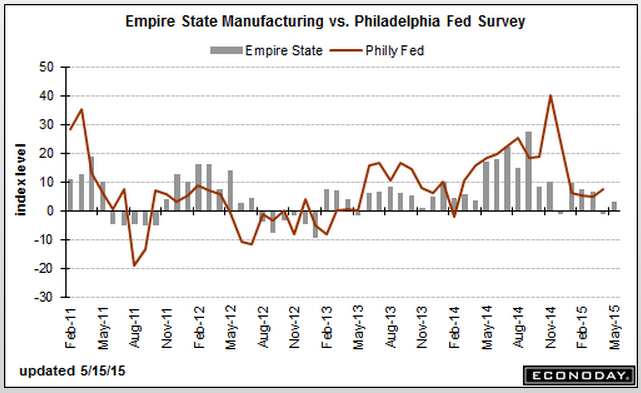
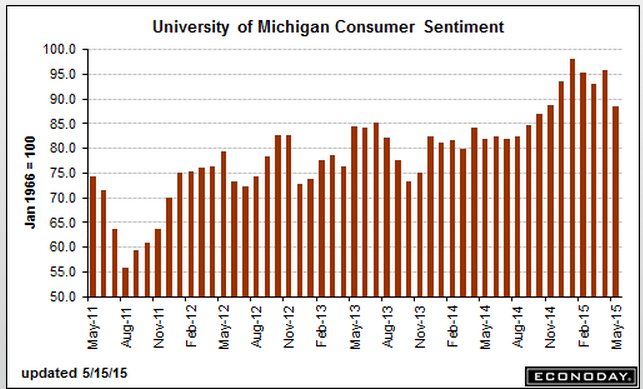
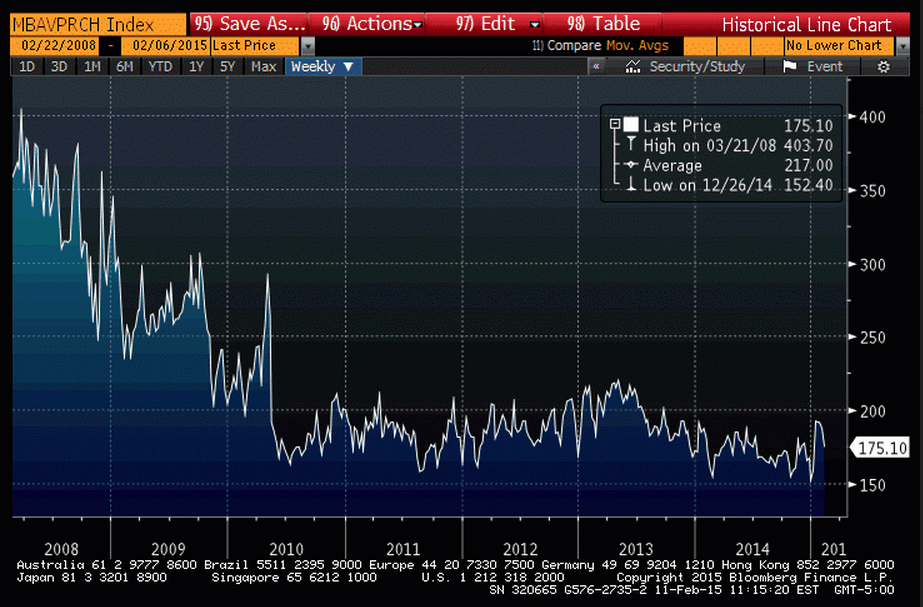
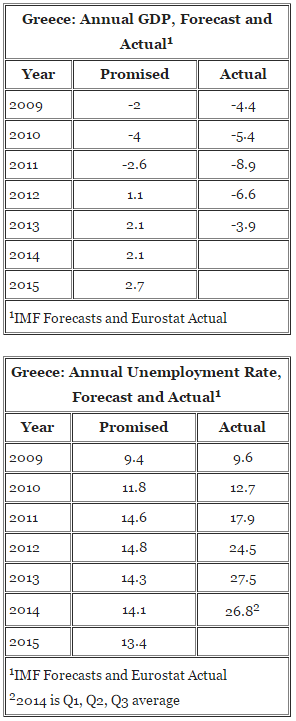
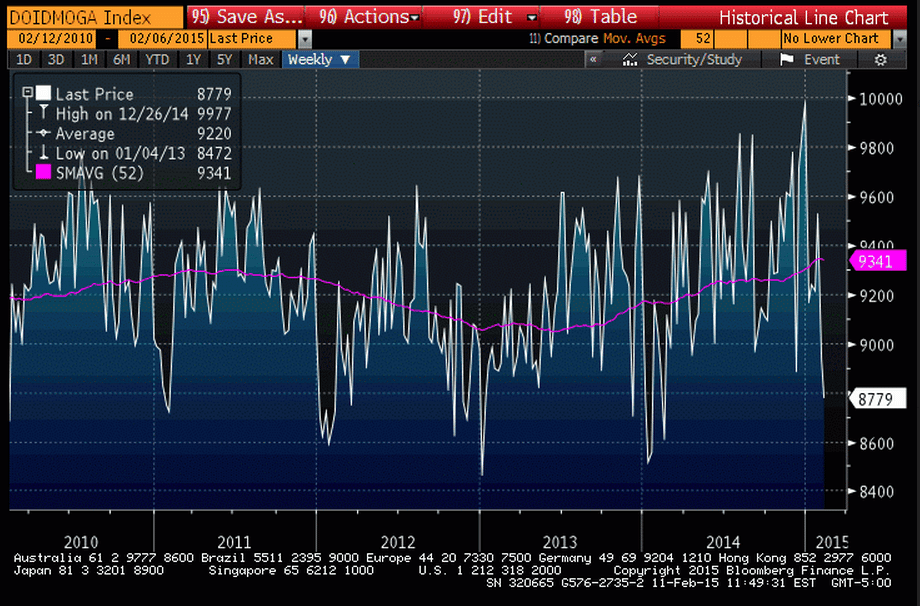
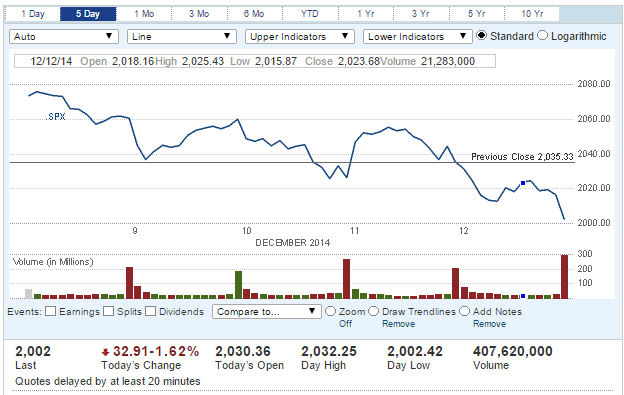
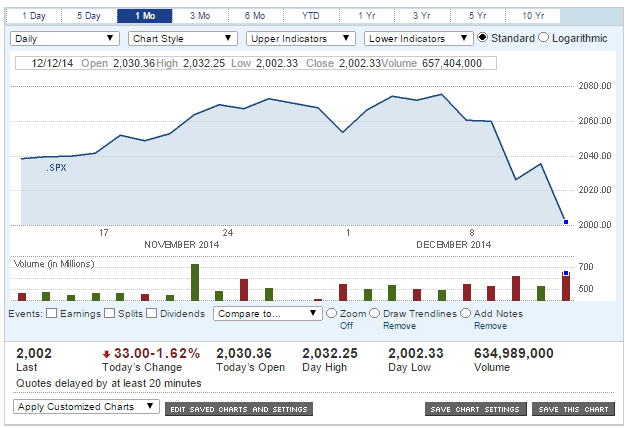
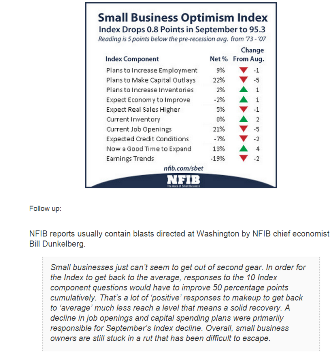
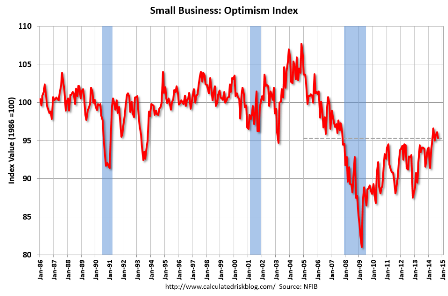
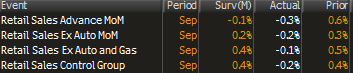
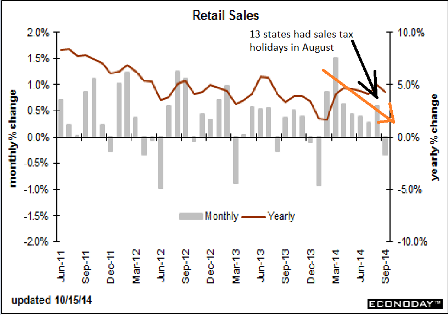
A few of last week’s charts: