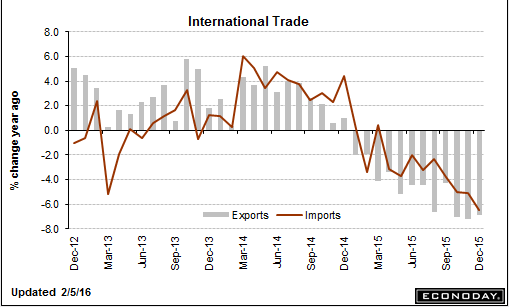


This component is going nowhere:

Still trying to catch up from the oil capex collapse of 2016 and covid collapse:

Not good:

This is an all time low as people scramble to get extra jobs to deal with higher prices,
like paying rent, for example:


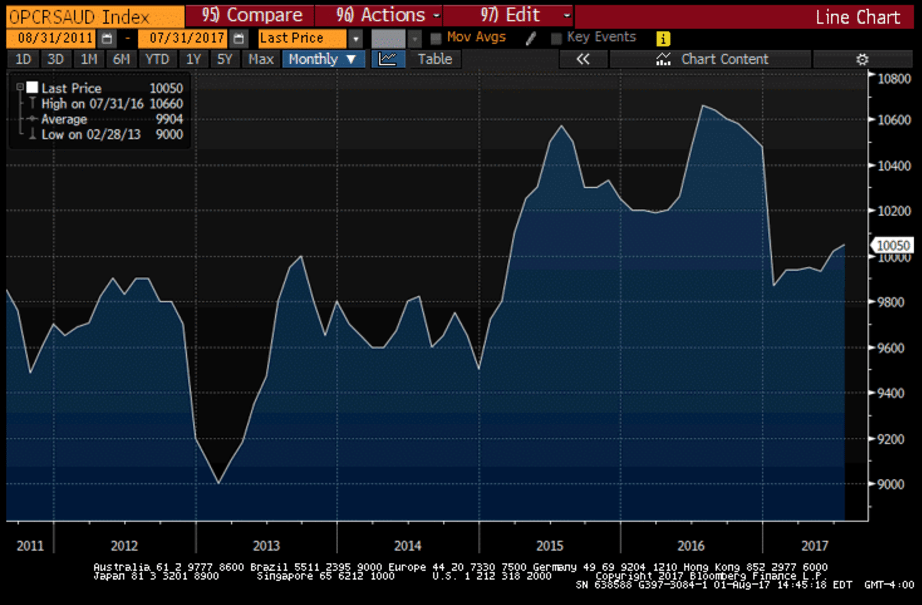
Oil prices taking a breather with the announcements of releases from strategic petroleum reserves.
Price direction, however, is instead set by Saudi OSP premiums to benchmarks which were just raised for the 3rd month and this time to record highs.
This puts a relentless upward bias to prices until Saudi pricing changes, and will propel what’s call inflation as well. And the higher prices can also trigger a sharp recession:


Highlights
ADP sees the private payroll reading in Friday’s employment report coming in at 178,000. But ADP has been wild lately, evident in its sharp 33,000 upward revision to June which is now at 191,000. Econoday expectations are calling for 175,000 in private payroll growth in Friday’s report and 178,000 in total nonfarm payroll growth.
ADP private falling off since year end:

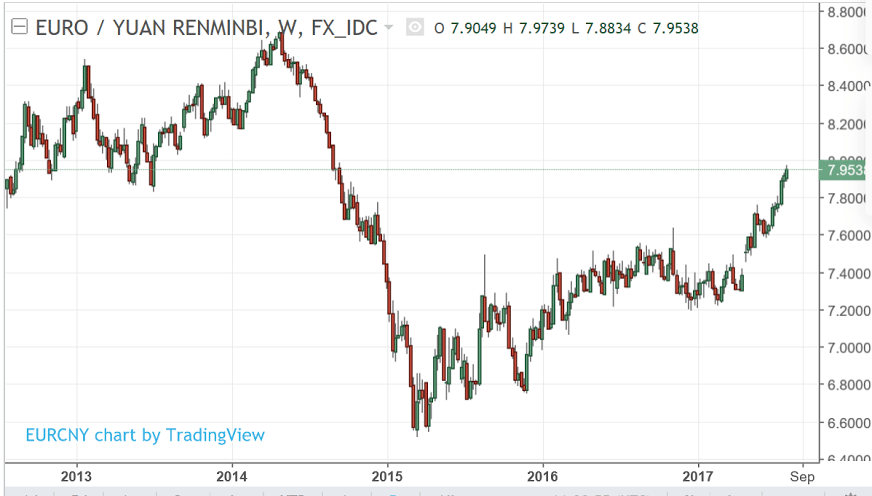
The now strong euro seems to be keeping a lid on prices via a drop in import prices. Looks to me like this time around the falling dollar is more likely to result in deflation abroad rather than inflation here at home. Also, with China keeping its currency relatively stable vs the dollar and weaker vs the euro, seem like China is targeting the euro area for exports:
Euro zone producer price inflation slows in June to lowest this year
By Lucia Mutikani
Aug 1 (Reuters) — Euro zone prices at factory gates grew in June at their slowest pace this year. Eurostat said industrial producer prices in the 19-country currency bloc increased 2.5 percent on the year in June, slowing from an upwardly revised 3.4 percent rise in May and a 4.3 percent surge in April. Headline inflation was stable at 1.3 percent in July, far from its 2.0 percent peak reached in February, according to preliminary estimates released by Eurostat this week. On the month, prices eased in June by 0.1 percent, in line with market expectations. In May industrial prices went down by 0.3 percent on the month, slightly less than the 0.4 percent fall previously estimated by Eurostat.
No rebound in mortgage purchase apps this week:
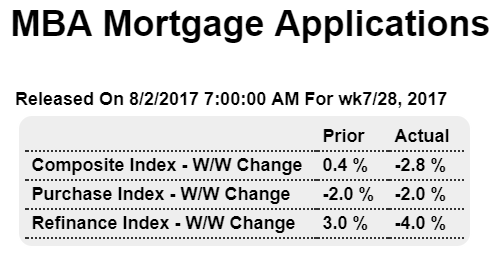
The seasonally adjusted Purchase Index decreased 2 percent from one week earlier to its lowest level since March 2017. The unadjusted Purchase Index decreased 2 percent compared with the previous week and was 9 percent higher than the same week one year ago. …
Read more at http://www.calculatedriskblog.com/#AA1sVKDFp3qYGrIX.99
Confirmation of weakening loan demand by domestic US banks, though some of the deceleration was due to foreign bank competition:
July 2017 Senior Loan Officer Opinion Survey Indicates Demand For Commercial And Industrial Loans Weakened
from the Federal Reserve
The July 2017 Senior Loan Officer Opinion Survey on Bank Lending Practices (SLOOS) addressed changes in the standards and terms on, and demand for, bank loans to businesses and households over the past three months. This summary discusses the responses from 76 domestic banks and 22 U.S. branches and agencies of foreign banks.
Regarding the demand for C&I loans, a moderate net share of domestic banks reported that demand from large and middle-market firms weakened, while a modest net share of banks reported that demand from small firms did so. The reported reasons for weakening loan demand were less concentrated than the reasons for having eased standards. Each of the following reasons for weaker demand was cited by at least half of the banks that reported weaker demand: shifts in customer borrowing to other bank or nonbank sources and decreases in customers’ needs to finance inventory, accounts receivable, investment in plant or equipment, and mergers or acquisitions.
Questions on commercial real estate lending. On net, domestic survey respondents indicated that their lending standards for all major categories of CRE loans tightened during the second quarter. In particular, a moderate net fraction of banks reported tightening standards for construction and land development loans and loans secured by multifamily residential properties, while a modest net share of banks reported tighter standards for loans secured by nonfarm nonresidential properties.
Banks also reported that demand for CRE loans weakened during the second quarter. A modest net fraction of banks reported weaker demand for construction and land development loans and loans secured by multifamily residential properties, while demand for nonfarm nonresidential loans remained basically unchanged on net.
Meanwhile, a modest net share of foreign banks reported tightening standards for CRE loans. Also, in contrast to the domestic respondents, a significant net share of foreign banks indicated that demand for CRE loans strengthened in the second quarter of 2017.
Not much happening here as Saudis continue to set price via their discounts to benchmarks, and let their output be demand determined:
Race to the bottom to see which party can make the stupidest proposals:
Down some, still depressed and going nowhere:
MBA Mortgage Applications
Highlights
Purchase applications for home mortgages fell back by 1 percent in the March 18 week, bringing down the year-on-year increase to a still very strong 25 percent, though some loss of momentum in this component is evident. Refinancing applications continued in the decline of recent weeks, dropping 5 percent in the latest week despite a 1 basis point slip to 3.93 percent in the average rate for 30-year conforming loans ($417,000 or less).
Been moving sideways for quite a while:
New Home Sales
Highlights
A burst of strength in the West supported a roughly as expected 2.0 percent rise in February new home sales to an annualized rate of 512,000. Sales in the West, which is a key region for the new home market, jumped 39 percent to reverse January’s 33 percent flop. The swings in this region are a reminder that new home sales, because of small samples, are subject to extreme month-to-month volatility.
February’s gain for sales didn’t come at the expense of discounting, based on the median price which jumped a monthly 6.2 percent to $301,400 but short of September’s record of $307,600. And the median price compared to sales does look high, up a very modest but possibly unsustainable 2.6 percent year-on-year vs a sharp decline of 6.1 percent for sales.
Lack of supply has been a problem for both existing home sales and also new home sales, with supply in the latter having been held down by a topping out in permits and also by supply constraints in the construction sector including for labor. Supply did edge 4,000 higher to a 7-year high of 240,000 units but supply relative to sales is unchanged at 5.6 months.
Looking at year-on-year sales rates for regions, the West, after its big showing in February, is back in front at plus 10.2 percent. The Midwest is up only 1.9 percent and the Northeast and South are both down, at 3.8 percent and 14.3 percent respectively. These declines, especially for the South which is a very large region, are a reminder of how soft new home sales have been.
Yet today’s report, which includes the gain for prices, is a plus for housing, a sector that has opened the year on a soft note.
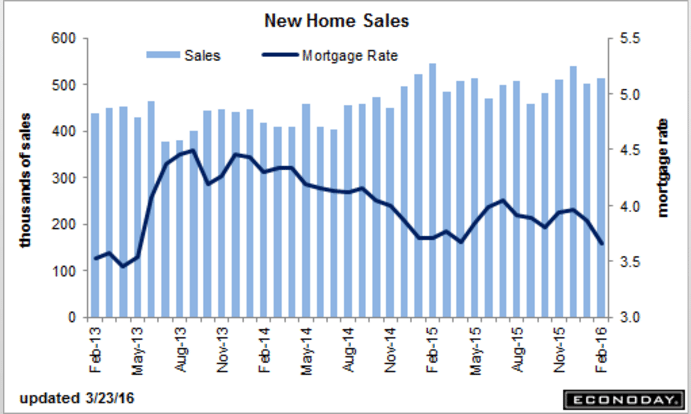
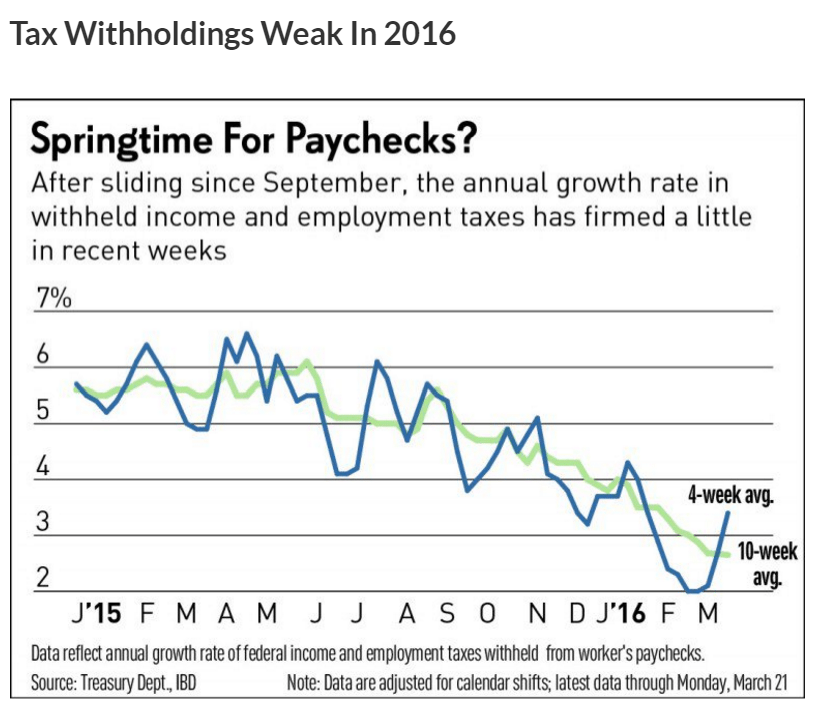
Just plain bad. Including last month’s downward revision.
And, again, sales = income, and lower income means less to spend in the next period:
Retail Sales
Highlights
Consumer spending did not get off to a good start after all in 2016 as big downward revisions to January retail sales badly upstage respectable strength in February. January retail sales are now at minus 0.4 percent vs an initial gain of 0.2 percent. The two major sub-readings also show major downward revisions with ex-auto sales now down 0.4 percent vs an initial gain of 0.1 percent and ex-auto ex-gas sales now at minus 0.1 percent from plus 0.4 percent. The latest for this latter core rate is really the main positive in today’s report, up a solid 0.3 percent in February. Total sales for February are weak at minus 0.1 percent as is the ex-auto reading, also at minus 0.1 percent.
But even in the core readings, details are not great with strength so far this year mixed across nearly all categories. Still, year-on-year strength is evident in two key discretionary components which are vehicles, up 6.8 percent, and restaurants which are up 6.4 percent. Non-store retailers, benefiting from growth in ecommerce, are up 6.3 percent. Sporting goods, a smaller discretionary category, are up 6.7 percent. And building materials & garden equipment, in a sign of strength for residential investment, are up 12.2 percent. The downside includes electronics & appliances which are at minus 3.2 percent and department stores down 2.2 percent. The weakest of all of course are gasoline stations, down 15.6 percent on the year as low fuel prices depress dollar sales.
Given the skewing effect of gasoline, the ex-gas total is important to look at it and it’s up 0.2 percent in the month for very respectable yearly growth of 4.8 percent. This reading underscores the silver lining in the report, that retail sales, despite all the negatives, are moving in the right direction. January and February are the lowest sales months of the year, a fact that magnifies adjustment effects and can cause volatility in the readings. But that aside, consumer spending, despite high employment, is struggling to break out of a flat run that included a very soft holiday season.
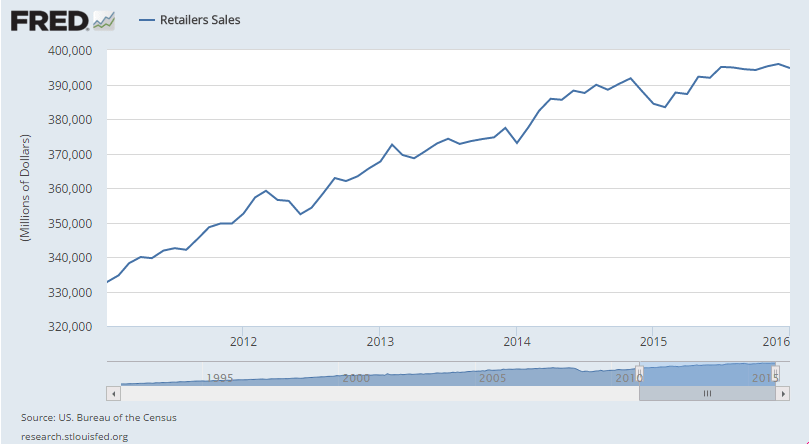
This is year over year change, adjusted for inflation:

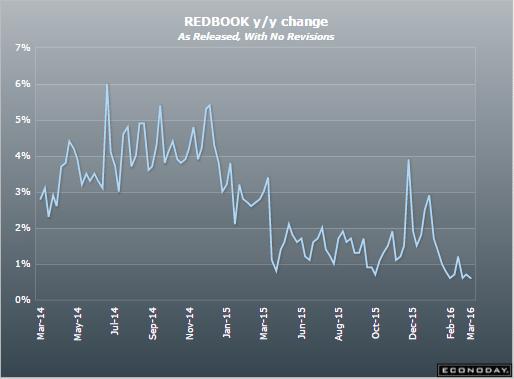
While U.S. retail sales fell less than expected in February, the sharp downward revision to January’s sales could be “devastating” for investors, CNBC’s Jim Cramer said Tuesday.
“I’m just kind of flummoxed. A number comes out that makes us feel great, and then that number is taken away,” Cramer said on “Squawk on the Street.”
;)
Another bad one:
Housing Market Index
Highlights
Demand for new homes is solid but lack of available lots and shortages in construction labor are holding back growth. The housing market index came in unchanged in March at a 58 level which however remains well above breakeven 50. Present sales, unchanged at a strong 65, lead the March report followed by future sales which are down 3 points to 61. A plus, however, is a 4 point gain to 43 for buyer traffic which has been weak this whole cycle.
The gain in traffic hints at the drawing power of low mortgage rates and speaks to the strength of the labor market. But there hasn’t been much acceleration in housing nor is any expected in tomorrow’s permits data. The housing sector, which was billed as a strength for 2016, has yet to build any momentum this year.
Also bad:
Business Inventories
Highlights
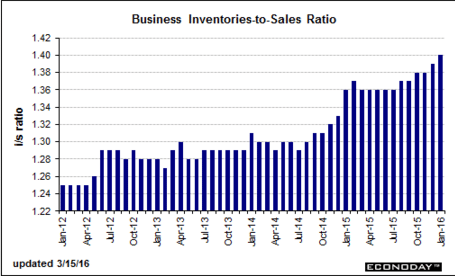
It’s been a weak morning for U.S. economic data and business inventories are no exception. Inventories rose an unwanted 0.1 percent in December against a 0.4 percent decline for sales in a mismatch that drives the stock-to-sales ratio from 1.39 to 1.40 for the fattest reading of the whole cycle, since May 2009. Inventories fell for factories but rose for wholesalers and also for retailers. Sales, however, fell for both retailers and especially for wholesalers. Heavy inventories are a negative for future production and future employment and today’s report points to slowing for both during the first quarter.
Better than expected but still weak:
Empire State Mfg Survey
Highlights
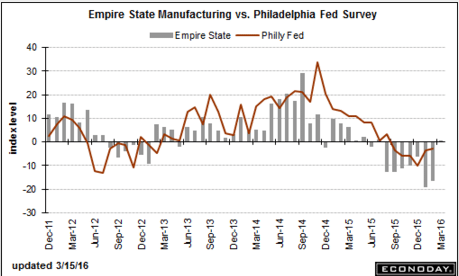
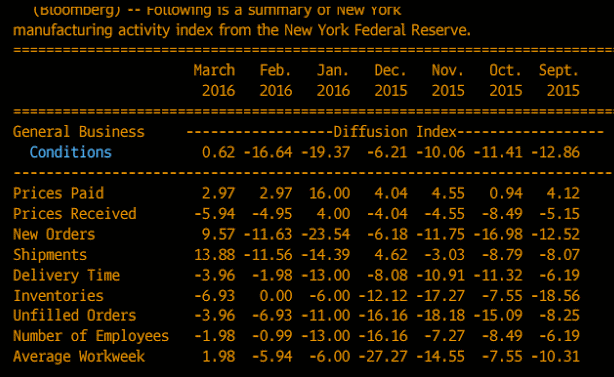
After seven straight months of contraction, the general conditions index of the Empire State report is back in the plus column, though just barely at 0.62 in a reading that signals fractional strength for factory activity during March. New orders are the report’s most convincing headline, at plus 9.57 to end nine straight months of contraction. Unfilled orders, however, remain in contraction, but only slightly at minus 3.96, as does employment at minus 1.98. Inventories are in contraction as are selling prices. Yet still, the 6-month outlook is picking up, to plus 25.53 for a more than 10 point gain. Shipments are also positive, at 13.88 in what points to strength for the manufacturing component of the March industrial production report, the February edition of which will be posted tomorrow and is expected to be flat. Flat is really the theme of this report which, compared to the deep contraction of prior reports, is relatively good news for a factory sector that has been getting hit by weakness in exports and energy equipment.
No sign of credit expansion here:
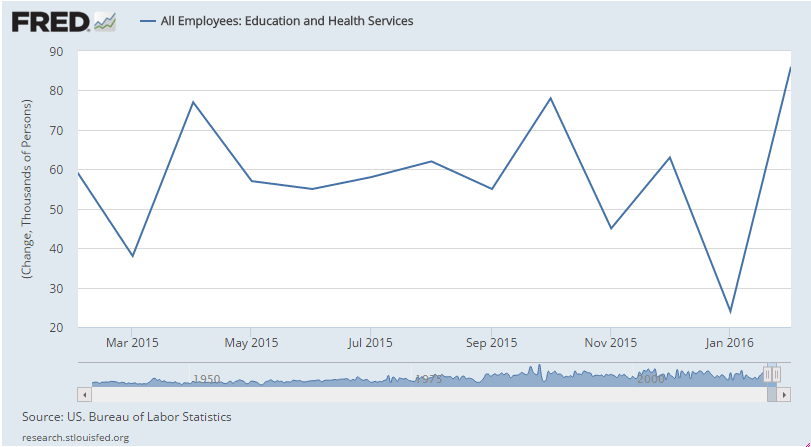
Education employment was mysteriously down big last month and up big this month, so best to average the two months, which would mean about 205,000 new jobs each month, which is about where it’s been.
However, in any case hours worded and average pay were both down, which means personal income and probably output is that much less, which is not good. Additionally, the downward revision in earnings for last month and the negative print this month tell me ‘the market’ is telling us there’s still substantial ‘slack’ in the ‘labor market’:
Employment Situation
Highlights
The labor market is adding jobs at a very strong rate. Nonfarm payrolls rose 242,000 in February vs the Econoday consensus for 190,000 and a high estimate of only 217,000. Adding to the punch are upward revisions to the two prior months totaling 30,000.
A negative in the report is a 0.1 percent decline in average hourly earnings that follows, however, January’s outsized 0.5 percent gain. Year-on-year, average hourly earnings are down 3 tenths to 2.2 percent. Another negative is a dip in the workweek to 34.4 hours which also, however, follows strength in the prior month when it rose to 34.6 hours.
The unemployment rate remains low at 4.9 percent while the labor participation rate continues to rebound, up 2 tenths in the month to 62.9 percent and boosted by new entrants and re-entrants into the labor market. The U-6 unemployment rate, which is cited frequently by Janet Yellen, is down a full 2 tenths to 9.7 percent.
Payroll strength by industries includes a second straight strong month for retail, up 55,000, and another strong month for trade & transportation, up 53,000. Professional & business services rose 23,000 but temporary help services fell for a second straight month, down 10,000 following a 22,000 decline in January. Government added 12,000 to payrolls while construction, where spending is solid, rose 19,000. Mining and manufacturing contracted, down 19,000 and 16,000 respectively.
The earnings numbers are setbacks but do follow prior strength. Payroll gains are unquestionably impressive and today’s report will very likely revive at least the chance for a rate hike at this month’s FOMC.
This is why using a two month average makes sense this month:
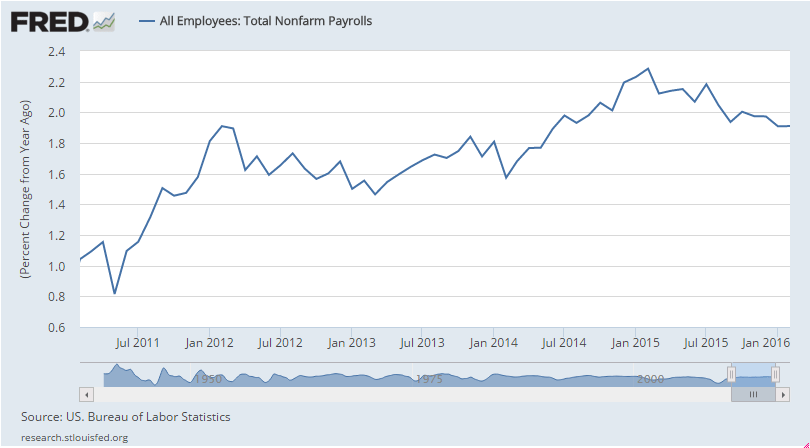
The chart shows the rate of growth continues the deceleration that began just over a year ago when oil capex collapsed:
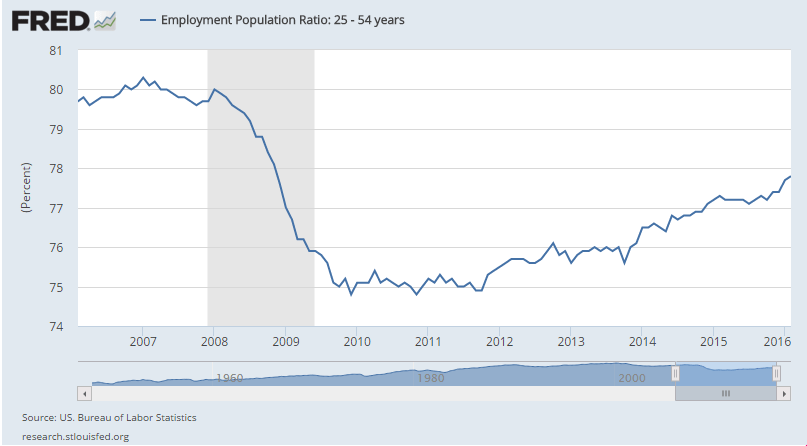
Still some serious ‘slack’ here:
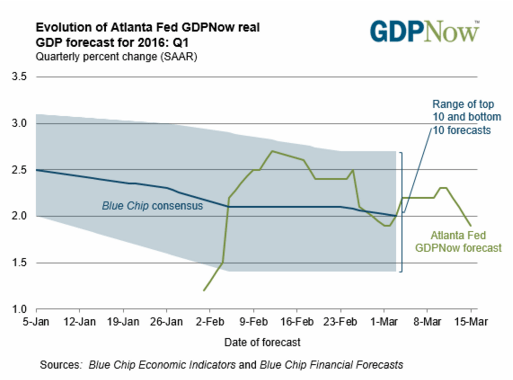
Worse than expected and so not good for GDP forecasts, and with vehicle sales down from last year’s highs rising auto imports mean even weaker domestic car sales:
International Trade
Highlights
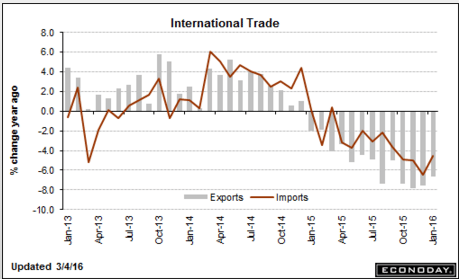
January was a weak month for cross-border trade with exports down a steep 2.1 percent and imports down 1.3 percent, making for a wider-than-expected trade imbalance of $45.7 billion. Exports of capital goods were especially weak as were imports of capital goods, both pointing to weakness in global business investment. Exports of industrial supplies were also down as were exports of consumer goods and also food products. Imports of industrial supplies were also down as were imports of consumer goods. Imports of autos, however, continue to rise to underscore the ongoing strength in vehicle sales.
The goods gap widened to $63.7 billion from $62.6 billion and when excluding petroleum where the gap narrowed, the goods gap widened to $57.8 billion from $55.5 billion. The nation continues to run a strong surplus on services, at $18.0 billion for a small gain in the month.
The gap with China widened in the month to $28.9 billion for a $1 billion increase while the gap with Europe narrowed sharply, to $8.8 billion from $13.7 billion. The gap with Japan narrowed to $4.9 billion from $6.6 billion while the gap with Canada widened to $2.4 billion from $2.2 billion.
Today’s report will lower early estimates for first-quarter GDP and no less importantly is the latest indication that global traffic is stalling, which is not a plus for global policy efforts to raise inflation.
In past cycles these declines in trade were indicative of recessions:
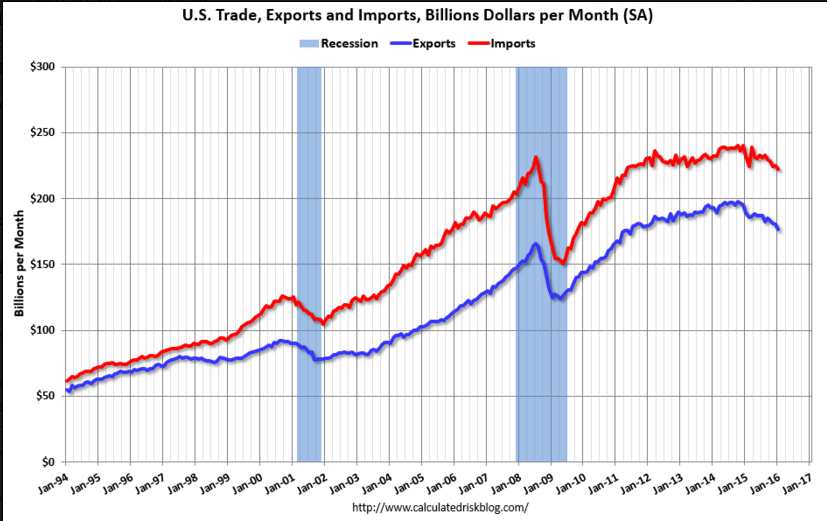
Trade also went bad as oil capex collapsed:
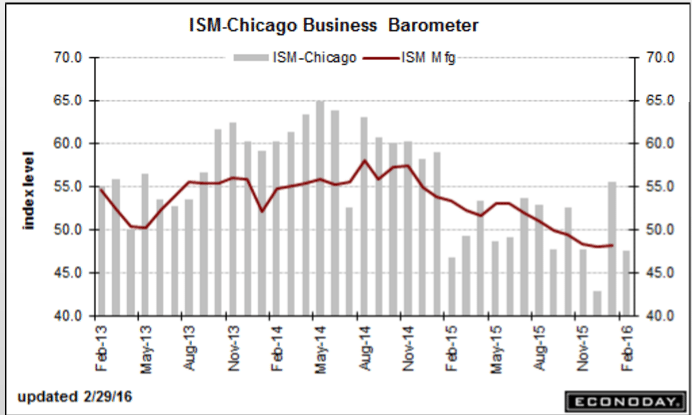
As previously suspected, last month’s higher print was just a bit of volatility on the way down, as per the chart:
Chicago PMI
Highlights
Another month and another month of wild volatility for the Chicago PMI which lurched from solid expansion in January to noticeable contraction in February. At a headline 47.6, Chicago’s PMI has fallen outside Econoday’s consensus range for a third month in a row! Still, this report is closely watched and confirms other early indications of February softness, not only for manufacturing but for services as well since this report tracks both sectors. The good news in the report is that new orders have held over breakeven 50 which hints at better readings in next month’s report. Now the bad news. Production is down sharply, backlogs are in a 13th month of straight contraction, employment is down and in a fifth month of contraction, and prices paid are contracting at the fastest pace since 2009. The resilience in new orders limits the signal of damage from this report, but production and other activity look to have slowed in February following respectable strength in January.
Another bad one, as the weakness that began with oil capex continues to dampen the rest:
Pending Home Sales Index
Highlights
Pending sales of existing homes slowed in January, down an unexpected 2.5 percent to an index level of 106.0 in a decline offset but only in part by an 8-tenths upward revision to December to plus 0.9 percent. Econoday forecasters were expecting a much better reading, at a consensus plus 0.5 percent for January sales. Sales in the month fell in three of the four regions with only the South in the plus column. Year-on-year, pending sales are up only 1.4 percent. Today’s report is yet another disappointment for a sector that, despite high employment and low mortgage rates, is getting off to a flat start for 2016.
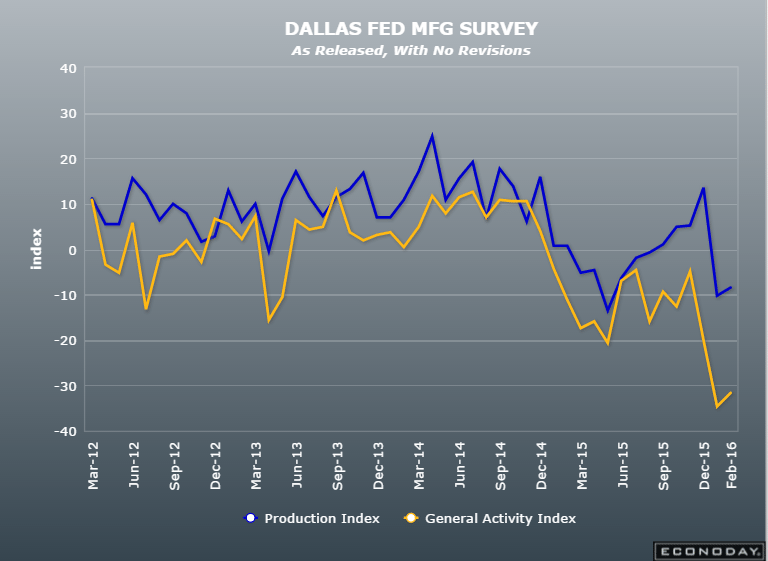
The oil patch is where the recession started and it keeps getting worse which means the rest of the economy will continue to deteriorate as well:
Dallas Fed Mfg Survey
Highlights
Dallas, together with Kansas City, are two Fed districts that are being hit hardest by the collapse in oil prices. The Dallas Fed’s general activity index came in at a deeply minus 31.8 in February vs minus 34.6 in January. New orders contracted a further 8.4 points in the month to minus 17.6 for their lowest reading since 2009 in what is a very ominous signal for the months ahead. Unfilled orders are also in contraction as are production and shipments. Price contraction deepened for both raw materials and selling prices. Inventories are down as is employment. In fact, in a rare sweep of weakness, all 17 current components are in contraction! The company outlook index is at minus 17.4 with a quarter of the sample saying their outlook has worsened during February. The latter is a telling reading and suggests very strongly, in line with all other anecdotal readings this month, that the factory sector, hit by weak exports and a weak energy sector, fell back in February.
Fundamentally high inflation = weaker currency as higher prices means the same amount of currency buys less,etc. and deflation = a fundamentally stronger currency. However, the euro has been falling on news of deflation, as portfolio mangers, traders, etc. sell what euro they still have (or get outright short), their logic/fears being that deflation will trigger more inflationary policy from the ECB, which has yet to ‘trigger’ inflation. Meanwhile, the lower euro, driven down by selling and not ‘fundamentals’, continues to support the large and growing trade surplus that removes net euro financial assets from global markets. This has been going on for maybe a couple of years now leaving the euro more and more ‘undervalued’ and in ever shorter supply:
Euro-Area Prices Decline Most in Year as ECB Mulls Easing
By Alessandro Speciale
Feb 29 (Bloomberg) — The inflation rate in the 19-nation bloc declined to minus 0.2 from a positive reading of 0.3 percent in January,. Core inflation, which strips out volatile elements such as food and energy, was at 0.7 percent, down from 1 percent in the prior month. In Germany, the European Union- harmonized inflation rate dropped to minus 0.2 percent from 0.4 percent. The rate in France fell to minus 0.1 percent, while Spanish prices slid 0.9 percent. The ECB has already cut its deposit rate to minus 0.3 percent and is pumping 60 billion euros ($66 billion) a month into the economy via asset purchases.
Nothing good here:
The world’s top economies are set to declare on Saturday that they need to look beyond ultra-low interest rates and printing money if the global economy is to shake off its torpor, while promising a new focus on structural reform to spark activity.
A draft of the communique to be issued by the Group of 20 (G-20) finance ministers and central bankers at the end of a two-day meeting in Shanghai reflected myriad concerns and policy frictions that have been exacerbated by economic uncertainty and market turbulence in recent months.
“The global recovery continues, but it remains uneven and falls short of our ambition for strong, sustainable and balanced growth,” the leaders said in a draft seen by Reuters.
“Monetary policies will continue to support economic activity and ensure price stability … but monetary policy alone cannot lead to balanced growth.”
Geopolitics figured prominently, with the draft noting risks and vulnerabilities had risen against a backdrop that includes the shock of a potential British exit from the European Union, which will be decided in a June 23 referendum, rising numbers of refugees and migrants, and downgraded global growth prospects.
But there was no sign of coordinated stimulus spending to spark activity, as some investors had been hoping after the market turmoil that began 2016.
Germany had made it clear it was not keen on new stimulus, with Finance Minister Wolfgang Schaeuble saying on Friday the debt-financed growth model had reached its limits.
“It is even causing new problems, raising debt, causing bubbles and excessive risk taking, zombifying the economy,” he said.
This is from a story about Virginia’s claims for unemployment which are down even as the economy has weakened:
Colonna said the dip to 1974 levels in new unemployment claims is baffling since economic growth has been so sluggish in Virginia recently.
The state’s economy didn’t grow at all last year, U.S. Bureau of Economic Analysis data show.
And for the 12 months ended in July, the number of Virginians working rose by just 12,200, or 0.3 percent, the Virginia Employment Commission reports. The number who were unemployed declined by 33,000 – a figure that’s larger because it includes people who have stopped looking.
Part-time workers can’t always qualify for benefits when they are laid off, since to receive the minimum $60 a week unemployment benefit in Virginia, a person must have earned at least $3,000 during two of the previous five quarters.
And if income from any part-time job exceeds a laid-off person’s unemployment benefit, the state won’t pay the unemployment benefit. The maximum unemployment benefit in Virginia is $378, and the maximum time it is paid is 26 weeks. You can’t get the benefit if you are fired or quit your job.
Another bad one, and supports the possibility of another downward revision to industrial production next month:
Philadelphia Fed Business Outlook Survey
Highlights
The Philly Fed report, much like Tuesday’s Empire State report, is pointing to continuing trouble for the nation’s factory sector. The general business conditions index came in at minus 2.8 to extend a long run of negative readings. New orders, at minus 5.3, have also been stuck in the minus column as have unfilled orders, at minus 12.7. Shipments, at plus 2.5, are positive for a second straight month but aren’t likely to hold above zero for very long given the weakness in orders. Employment is in the contraction column for a second straight month at minus 5.0 with the workweek also posting a second month of contraction at minus 12.9. Manufacturers in the region continue to draw down inventories, to indicate sagging expectations, with the 6-month outlook down nearly 2 points to 17.3 which is still in the plus column but very low for this reading. Price data continue hold in the negative column. This report is a disappointment and belies yesterday’s manufacturing strength in the industrial production report.
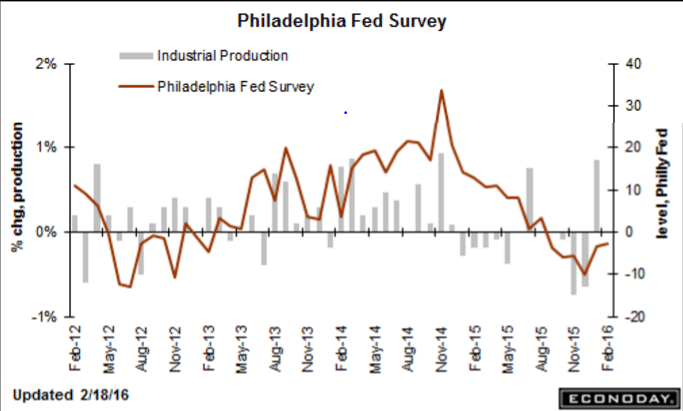
Hard to imagine from this chart that the US isn’t already in recession:
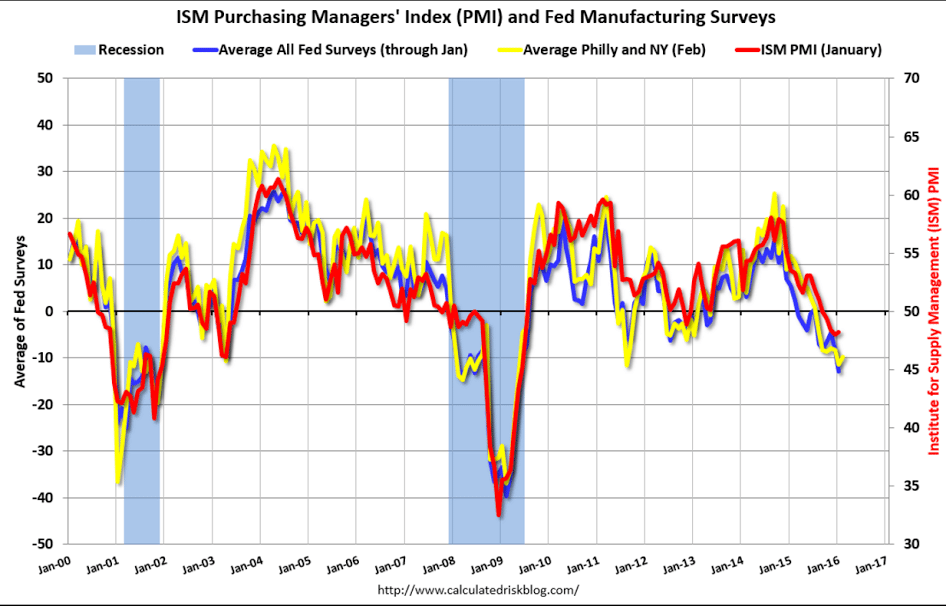
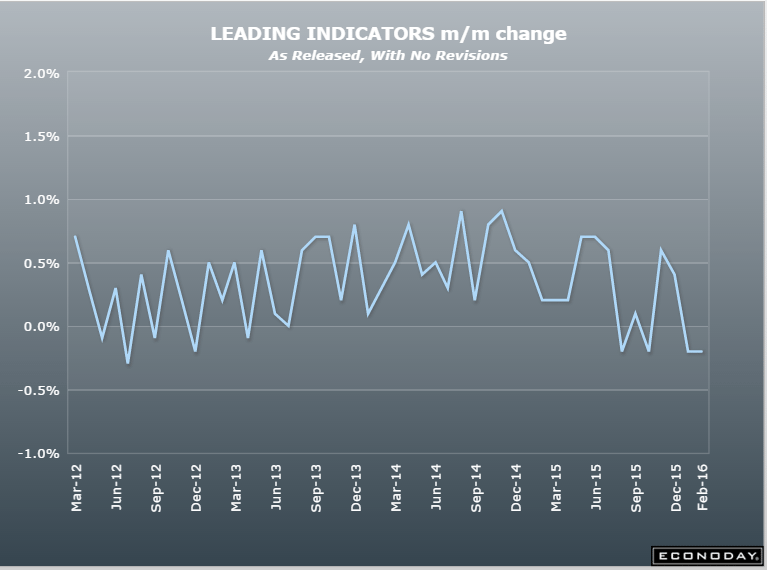
This series is biased towards positive numbers as it presumes a positive yield curve supports future growth, and with rates near 0 the yield curve is pretty much always going to be positive. So when it goes negative like this, it means the rest is that much more negative:
Leading Indicators

My point here remains that you can have no new claims AND no new hiring. And in any case states have made it more difficult to collect benefits, which are both low and fully taxable, so this could be the type of recession where hiring continues to decelerate and attrition continues without an increase in involuntary separations followed by filing for benefits:
Jobless Claims

Getting more obvious it’s ‘spreading’ much like during the sub prime days, as previously discussed?
European banks face major cash crunch
European banks may have to pare down assets to bolster capital reserves as cheap oil is taking a toll on portfolios of energy-exposed loans.
It’s slowing, whatever it is…
;)
Labor Market Conditions Index
Highlights
Payroll growth slowed in Friday’s employment report as did the Fed’s labor market conditions index, to plus 0.4 in January from a downward revised plus 2.3 in December (2.9 initially) and an upward revised plus 2.9 in November (2.8 initially). January’s reading indicates the lowest level of labor market expansion since April last year and also reflects the climbing trends in jobless claims. One big positive for the labor market, however, is the falling unemployment rate, at a recovery low 4.9 percent in January.
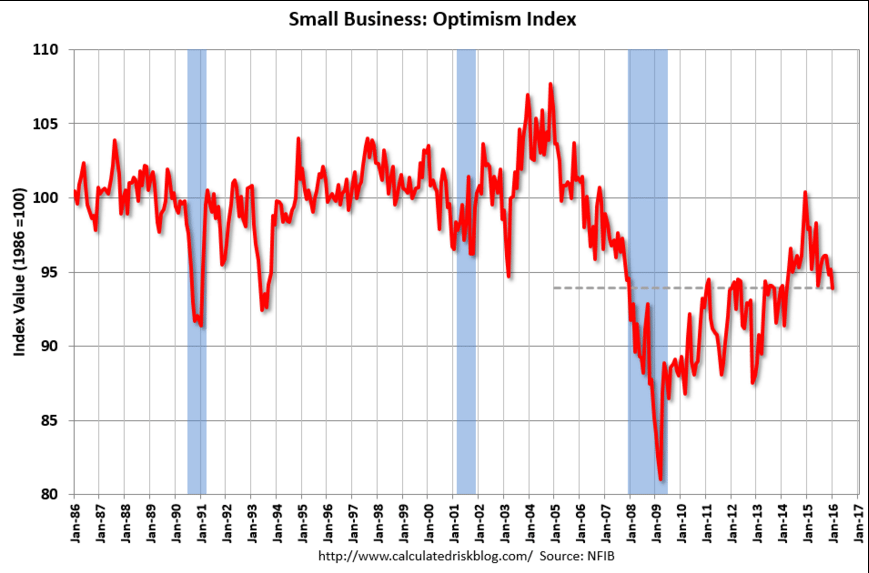
This is getting out of control.
Sales are slowing faster than inventories are being sold.
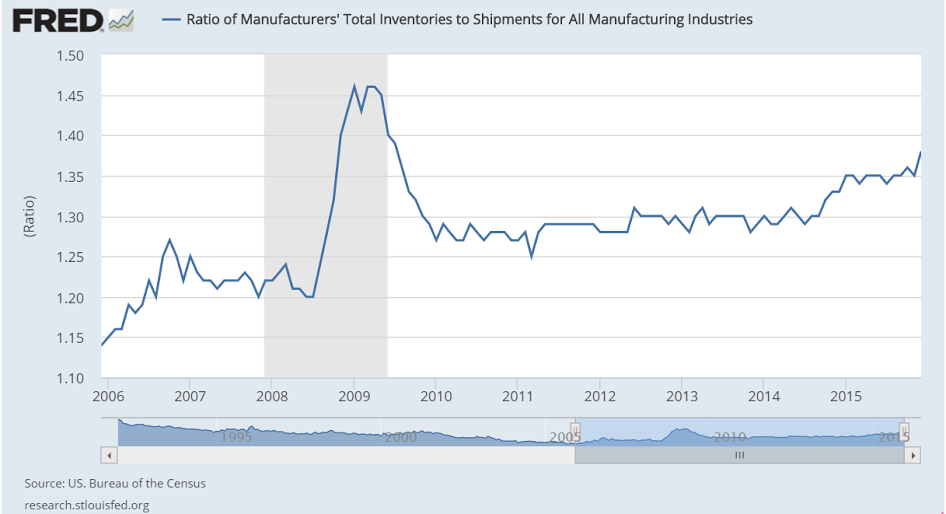
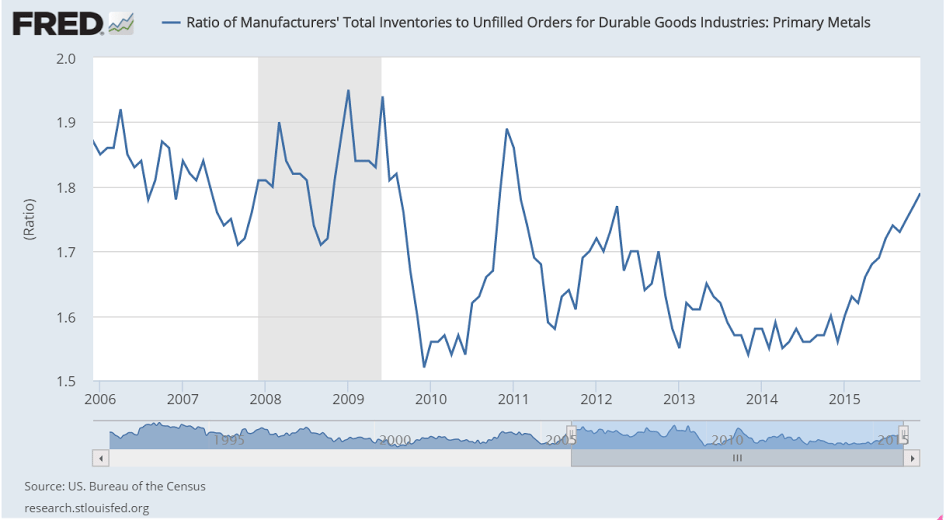
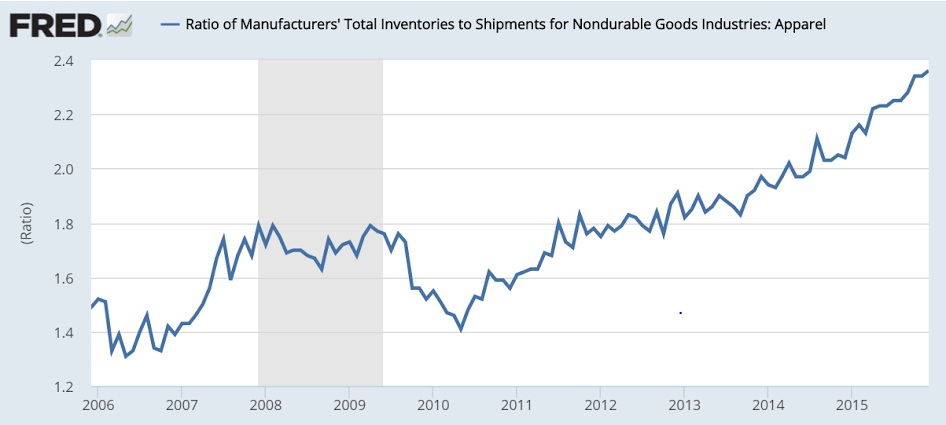
A weak print and year over year growth continues to decelerate as per the chart:
Employment Situation
Highlights
Headline weakness masks an otherwise solid employment report for January. Nonfarm payrolls rose 151,000 vs expectations for 188,000. December was revised 30,000 lower to 262,000 but November was revised 28,000 higher to 280,000. Now the signs of strength as the unemployment rate fell 1 tenth to 4.9 percent while the participation rate rose 1 tenth to 62.7 percent. In another sign of strength, the average workweek rose to 34.6 hours to end a long run at 34.5 hours. Average hourly earnings rose a very sharp 0.5 percent though the monthly gain didn’t make for any change in the year-on-year rate which holds steady at a still moderate 2.5 percent.
Manufacturing stands out in the industry data pointing to a strong January for the sector. Manufacturing hours rose in the month while payrolls jumped 29,000 for the best showing since November 2014. Retail trade, up 58,000, also posted its best gain since November 2014. Transportation & warehousing, in a sign of strength for the supply chain, rose 45,000 for the strongest showing since December 2012. On the negative side are temporary help services, down 25,000 but following strong gains in prior months. Government payrolls fell 7,000 as did mining where employment, hit by the drop in oil and commodity prices, was in contraction throughout 2015.
The labor market may be backing off slightly so far this year but it continues to approach full employment, a factor underscored by the month’s jump in hourly earnings and which offers support for further Federal Reserve rate hikes. Note that the big snow storm that hit the East Coast during the month came after the sample week and was not a factor in the data.
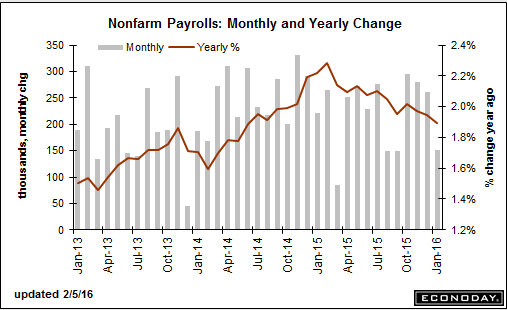
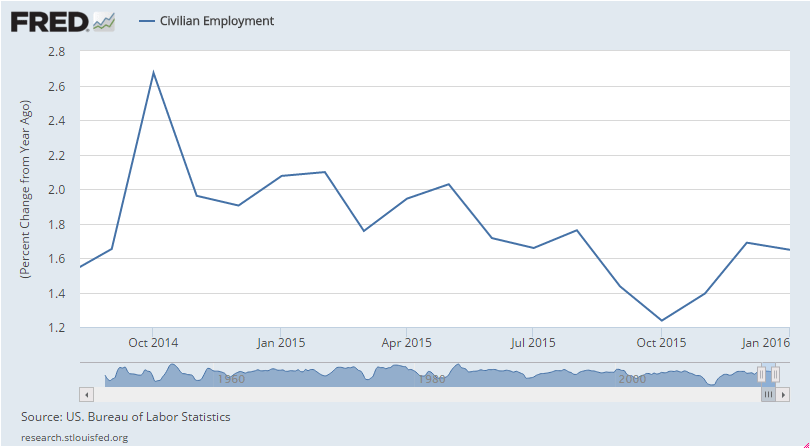
Yes, there was a monthly gain in the household survey, but on a year over year basis it decelerated from last month and the downtrend remains intact:
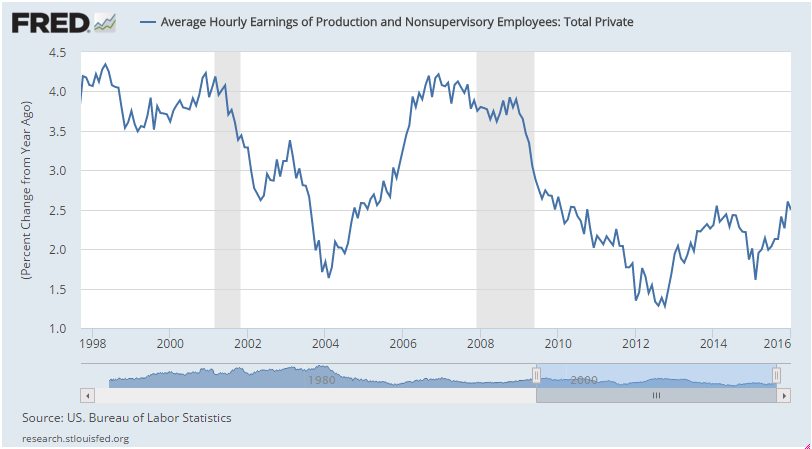
Wage growth remains well below prior lows and is only back to where it peaked in 2014:
The trade gap continues to widen even as the price of oil remains low, as exports weaken:
International Trade
Highlights
The nation’s trade deficit widened in December to $43.4 billion from a revised $42.2 billion in November. Exports have been extremely weak and weakened further, down 0.3 percent to $181.5 billion in the month. Exports of civilian aircraft fell sharply with exports of industrial supplies and foods/feeds/beverages also down. Imports rose 0.3 percent to $224.9 billion led by autos and industrial supplies and offsetting a decline for non-auto consumer goods.
Country balances show a $3.4 billion narrowing with China to a $27.9 billion monthly gap and little change with the E.U. at $13.7 billion. The gap with Japan widened by $0.9 billion to $6.6 billion while the gap with Mexico narrowed by $0.7 billion to $4.6 billion. The gap with Canada widened sharply by $1.7 billion to $2.2 billion.
The decline in exports is the latest hard evidence of global effects made more severe for U.S. exporters by the strength of the dollar, but the rise in imports, despite the decline in consumer goods, offers a positive indication on domestic demand, strength underscored this morning by the January employment report.
