Inflation in China

What I see is more evidence of an inflation problem in China that they are now trying to blame on something other than themselves to prevent the historical regime change from inflations of the past.

The problem is, of course, the don’t fundamentally understand how a currency works, which reduces the odds of being able to reverse their inflation without a recession.

Beijing’s Focus on Food Prices Ignores Broader Inflation Risk

By Keith Bradsher

November 17 (NYT) — Zhou Xiaochuan, the governor of the central bank, had said earlier on Tuesday that the amount of money racing through the global economy was putting pressure on emerging economies that want to control inflation. And Yao Jian, a commerce ministry spokesman, said at a press conference on Tuesday that the government would tighten scrutiny of foreign investment so as to prevent too much money from pouring into China as foreign investors seek higher returns than are currently available in the West.

Imposing price controls and other administrative controls on the Chinese economy runs counter to the steps recommended by many Western experts. They have suggested that China should further deregulate its economy, let the renminbi appreciate and otherwise rely on market forces to tame inflation.

UK cpi forecast down

Funny how those ultra low rates never do seem to generate inflation as many fear…

*BOE SAYS NEAR-TERM CPI OUTLOOK HIGHER ON POUND, OIL PRICE
*BOE CONSTANT-RATE FORECAST SHOW INFLATION BELOW 2% IN 2 YEARS
*BOE SAYS DOWNSIDE U.K. GROWTH RISKS HAVE `INCREASED SOMEWHAT’
*BOE FORECASTS BASED ON RATE AT 0.6% END 2010, 1.7% END 2011
*BOE SAYS U.K. BUDGET CUTS MAY NEED TO BE `MORE DEMANDING’
*BOE FORECASTS SHOW INFLATION AT ABOUT 1.4% IN 2 YEARS’ TIME
*BOE SAYS NEAR-TERM CPI OUTLOOK `SOMEWHAT HIGHER’ THAN FEBRUARY
*BOE SAYS DOWNSIDE U.K. GROWTH RISKS HAVE `INCREASED SOMEWHAT’
*BOE SAYS U.K. RECOVERY `LIKELY TO CONTINUE TO GATHER STRENGTH’
*BOE SAYS GDP RISKS FROM MARKET CONCERNS ON BUDGET DEFICITS
*BOE SAYS EURO-AREA FISCAL PRESSURES COULD ADVERSELY IMPACT U.K
*BOE FORECASTS SHOW GDP GROWING ABOUT 3.5% ANNUAL PACE IN 2 YRS
*BOE SAYS STIMULUS, POUND, GLOBAL DEMAND SHOULD AID RECOVERY
*BOE SAYS U.K. BUDGET CUTS MAY NEED TO BE `MORE DEMANDING’
*BANK OF ENGLAND RELEASES INFLATION REPORT IN LONDON
*BOE SAYS `SIGNIFICANT’ MEDIUM TERM FISCAL CONSOLIDATION NEEDED
*BOE CONSTANT-RATE FORECAST SHOW INFLATION BELOW 2% IN 2 YEARS

May 12 (Bloomberg) — The Bank of England said risks to the
economic recovery have increased on investor concern about
European budget deficits, and called on David Cameron’s incoming
government to step up measures to tackle the U.K.’s shortfall.
The central bank predicted the economy will sustain its
pickup and reach a 3.5 percent annual pace by the beginning of
2012, while inflation is still likely to remain below the 2
percent target. The forecasts are based on the interest rate
staying close to its record low of 0.5 percent this year and
reaching 1.7 percent by the end of 2011….

U.S. Data


Karim writes:

Brief and delayed recap:

Looks like Goldilocks is officially here. 4% GDP gwth and 0% core inflation.
Agreed, remains a good market for stocks apart from looming shocks from Europe and elsewhere that could do a lot of damage.
Tax hikes can do damage but they are off in the future for now.

I describe 4% gdp as more L shaped than V shaped, but that’s just semantics. It’s modest growth that will very gradually bring down unemployment.

In the end, growth will be important to the Fed as it leads inflation. Look for Bernanke to continue to tweak extended period language today.
  • Retail sales up 1.6% with upward revisions to Jan and Feb
  • Control group up 0.5% and 3mth annualized rate for control group jumped to 7.4% from 5.2%
  • Looks like 4% GDP growth in Q1
  • Core CPI up 0.05%; helped largely by another 0.1% drop in OER
  • 3mth annualized rate of core inflation now -0.1%

CPI/Housing


[Skip to the end]


Karim writes:

CPI

  • Headline CPI +0.4% and core +0.034%
  • OER -0.1% and volatile items largely offsetting (lodging away from home -1.5% vs tobacco +1% and vehicles +0.8% (after +1.7% prior month))
  • Favorable base effects for core coming in H1 2010 should see y/y drift to 1% from current 1.7%

Housing

  • Starts up 8.9%; largely payback from weak October and driven by multi-family
  • Single family up 2.1% (-7.1% prior) and multi-family up 67.3% (after down cumulative 51% prior 2mths)
  • Permits +6% (versus prior -4.2%)
  • Net/Net housing component of GDP likely to remain flat/slightly positive for next 2-3 quarters


[top]

CPI/IP/Michigan


[Skip to the end]

Yes, there’s clearly an ‘unidentified demand leakage’ to have all this deficit spending with demand only holding at very low levels.

I keep coming back to the depressing effects of low interest rates and a large Fed portfolio shifting interest income from savers to govt., banks, and corporate borrowers with consumers who borrow getting very little benefit as incomes at best stagnate.

As Bernanke stated in his 2004 paper, the fiscal drag from lower interest rates can be offset by a tax cut or fed spending increase.


Karim writes:

Biggest news this morning was surprising drop in Michigan survey. Despite equity rally, lower gas prices and labor market becoming ‘less bad’, Michigan survey drops 2.8pts to lowest level since March. Consumer still nowhere to be found in current ‘recovery’.

  • Michigan Survey falls from 66 to 63.2
  • 1y Fwd Inflation expex drop from 3.0 to 2.9; 5-10yr fwd from 2.9 to 2.8
  • IP for July up 0.5%; aided by auto production; ex-autos -0.1%
  • CPI unchanged m/m for both headline and core; headline -2.1% y/y and core +1.5%
  • OER (Unch) and lodging away from home (-2.1%) offset apparel (0.6%), vehicles (0.3%) and tobacco (2.2%).
  • Look for quirks in vehicle pricing to resolve in coming months and help drive core below 1% by yr-end.


[top]

2008-12-16 USER


[Skip to the end]


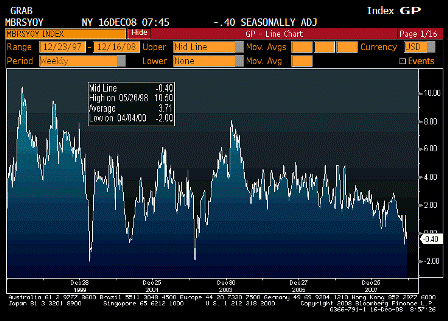
ICSC UBS Store Sales YoY (Dec 16)

Survey n/a
Actual -0.40%
Prior 0.40%
Revised n/a

 
Continues to move lower.

[top][end]

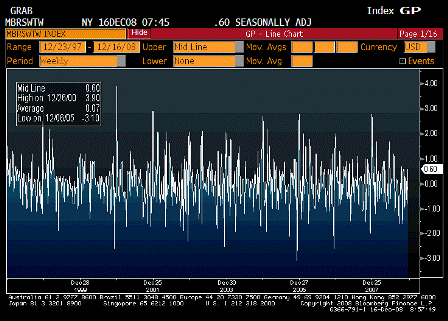
ICSC UBS Store Sales WoW (Dec 16)

Survey n/a
Actual 0.60%
Prior -0.80%
Revised n/a

[top][end]

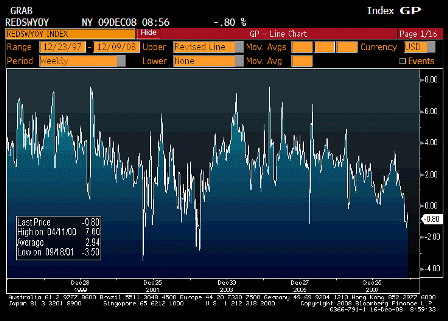
Redbook Store Sales Weekly YoY (Dec 9)

Survey n/a
Actual -0.80%
Prior -0.40%
Revised n/a

 
Continues to move lower.

[top][end]

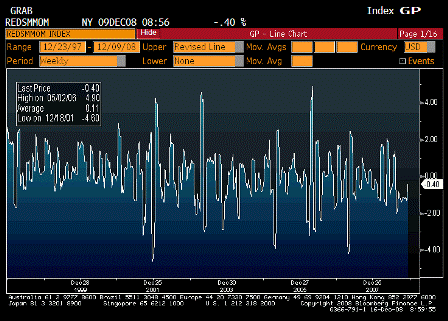
Redbook Store Sales MoM (Dec 9)

Survey n/a
Actual -0.40%
Prior -1.10%
Revised n/a

[top][end]

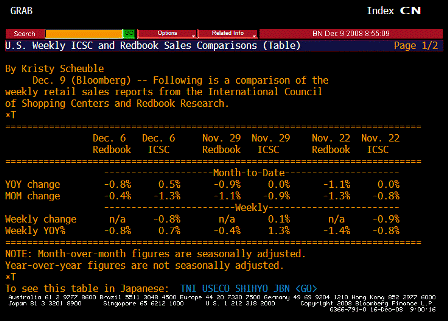
ICSC UBS Redbook Comparison TABLE (Dec 9)

[top][end]

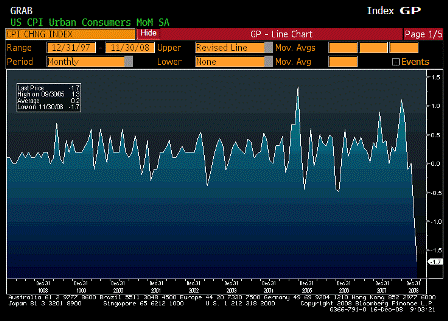
Consumer Price Index MoM (Nov)

Survey -1.3%
Actual -1.7%
Prior -1.0%
Revised n/a


Karim writes:

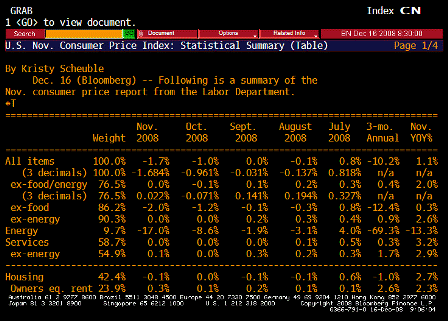
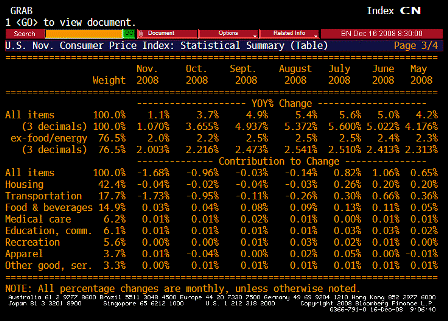
  • Headline CPI dropped 1.7% M/M in November after 1.0% decline last month (Y/Y now at +1.1%)
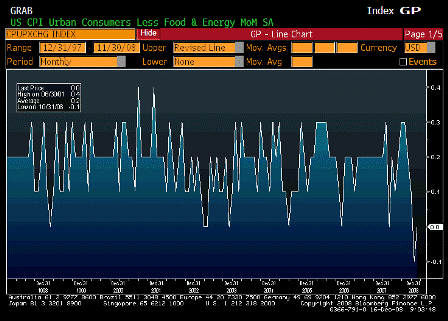
  • Core was flat in November after 0.1% decline (Y/Y at 2.0% and 3 month annualized at 0.4%… core is decelerating quickly and inflation certainly not a concern for Fed at this point)
  • OER was up 0.3% M/M, but partly due to a decline in utility prices that increases economic rents

[top][end]

CPI Ex Food and Energy MoM (Nov)

Survey 0.1%
Actual 0.0%
Prior -0.1%
Revised n/a

[top][end]

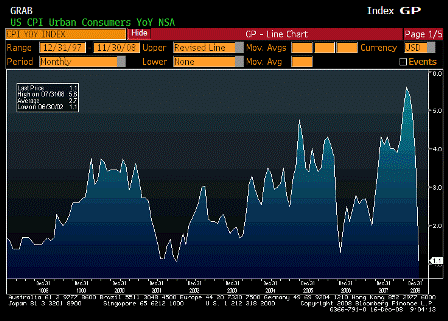
Consumer Price Index YoY (Nov)

Survey 1.5%
Actual 1.1%
Prior 3.7%
Revised n/a

 
Way down, as crude oil and gasoline are lower than they were last year.

[top][end]

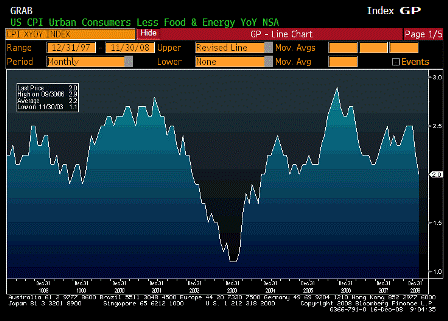
CPI Ex Food and Energy YoY (Nov)

Survey 2.1%
Actual 2.0%
Prior 2.2%
Revised n/a

 
Core drifting lower though owner equivalent rent went up .30% as utility costs fell and rents stayed about the same.

[top][end]

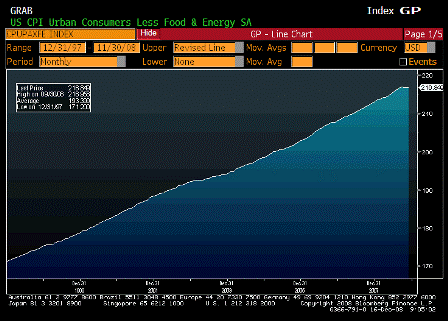
CPI Core Index SA (Nov)

Survey n/a
Actual 216.849
Prior 216.801
Revised n/a

[top][end]

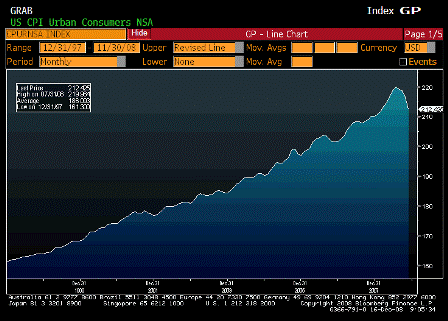
Consumer Price Index NSA (Nov)

Survey 212.699
Actual 212.425
Prior 216.573
Revised n/a

[top][end]

Consumer Price Index TABLE 1 (Nov)

[top][end]

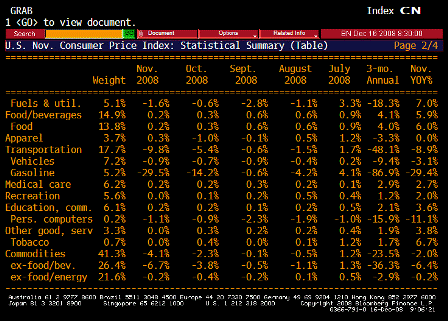
Consumer Price Index TABLE 2 (Nov)

[top][end]

Consumer Price Index TABLE 3 (Nov)

[top][end]

Housing Starts (Nov)

Survey 763K
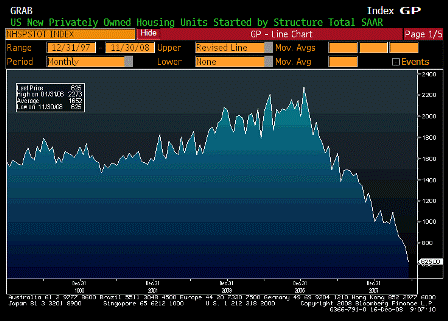
Actual 625K
Prior 791K
Revised 771K

 
Keeps falling as the headlines have the public and financial institutions scared stiff.

Karim writes:

  • Housing Starts dropped to 625k in November (record low with about 50 years of data!) from 771k last month and 1,179k last year (this should put more downward pressure on residential investment in GDP through early 2009)
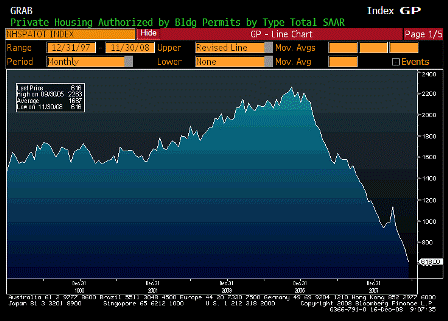
  • Permits dropped to 616k in November (record low with about 50 years of data!) from 730k last month and 1,111k last year
  • Token “Sliver” lining- less pressure on inventories from new homes

[top][end]

Building Permits (Nov)

Survey 700K
Actual 616K
Prior 708K
Revised 730K

[top][end]


[top]

2008-08-14 US Economic Releases


[Skip to the end]


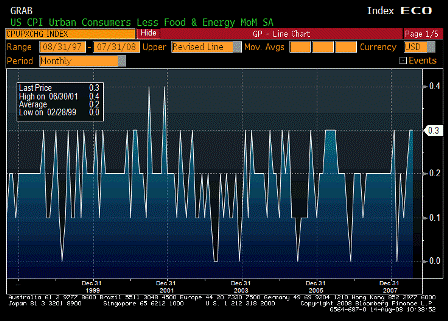
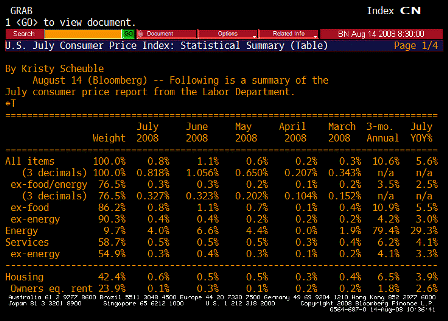
Consumer Price Index MoM (Jul)

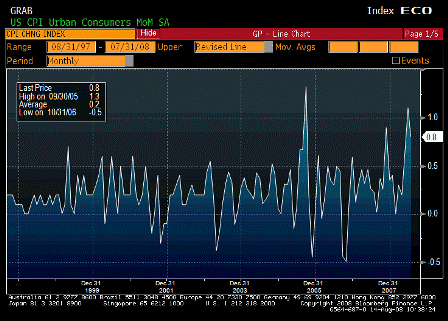
Survey 0.4%
Actual 0.8%
Prior 1.1%
Revised n/a

Out of control, but if the recent commodity sell off holds headline will moderate some for awhile. Lots of pass-throughs and cost push forces in place.

[top][end]

CPI Ex Food & Energy MoM (Jul)

Survey 0.2%
Actual 0.3%
Prior 0.3%
Revised n/a

[top][end]

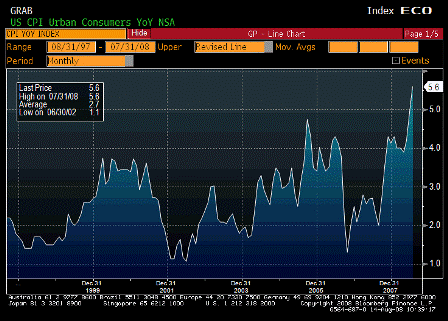
Consumer Price Index YoY (Jul)

Survey 5.1%
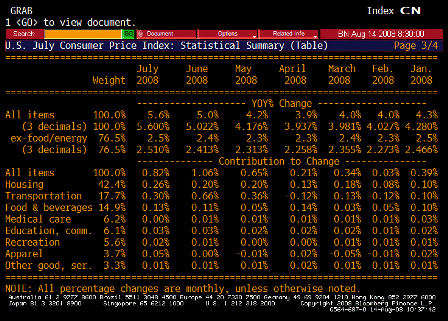
Actual 5.6%
Prior 5.0%
Revised n/a

The Fed has to be concerned that the 2% FF rate is way too accommodative, especially with Q2 GDP no forecast at over 3% and Q3 looking like 2%.

[top][end]

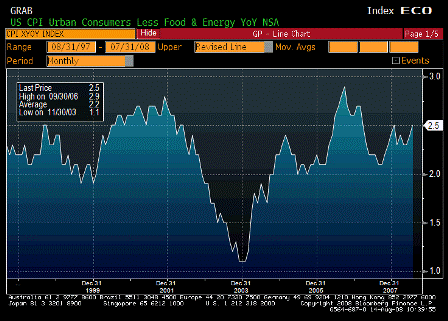
CPI Ex Food & Energy YoY (Jul)

Survey 2.4%
Actual 2.5%
Prior 2.4%
Revised n/a

Could be headed much higher as cost push pass-throughs starting to register.

[top][end]

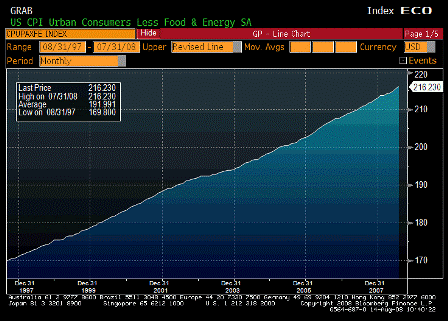
CPI Core Index SA (Jul)

Survey n/a
Actual 216.230
Prior 215.526
Revised n/a

[top][end]

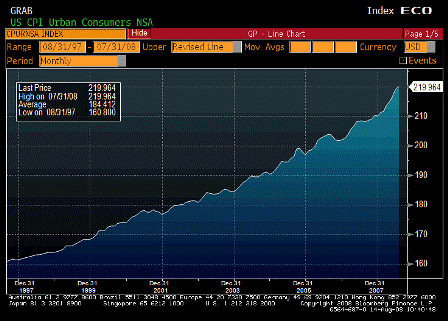
Consumer Price Index NSA (Jul)

Survey 219.075
Actual 219.964
Prior 218.815
Revised n/a

[top][end]

CPI TABLE 1 (Jul)

[top][end]

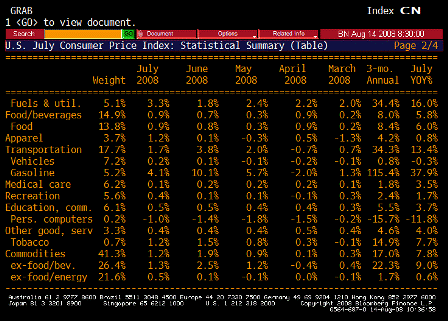
CPI TABLE 2 (Jul)

[top][end]

CPI TABLE 3 (Jul)

[top][end]


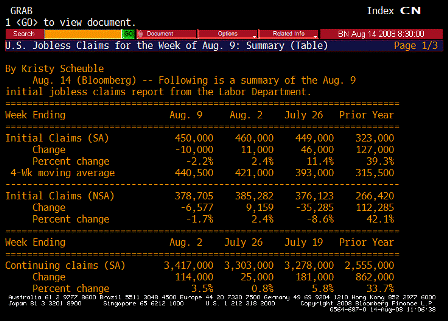
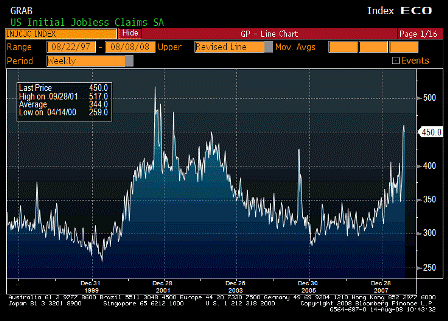
Initial Jobless Claims (Aug 9)

Survey 435K
Actual 450K
Prior 455K
Revised 460K

Up, but confused by new extended benefits.

[top][end]

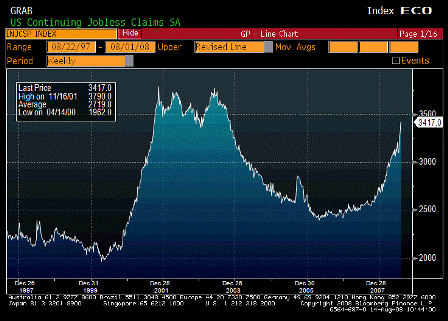
Continuing Jobless Claims (Aug 2)

Survey 3310K
Actual 3417K
Prior 3311K
Revised 3303K

Not looking good either, but how bad can it actually be with GDP north of 3%?

[top][end]

Jobless Claims TABLE 1 (Aug 9)

[top][end]

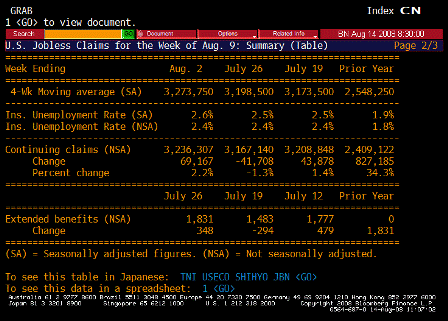
Jobless Claims TABLE 2 (Aug 9)


[top]

Japan CPI


[Skip to the end]

from Dave:

Japan core CPI last night came out at 1.9% as expected

Petrol products were up +23.9% y/y

Non fresh food products were up +3.5% y/y

Core-Core CPI (ex energy and ex fresh food) rose +0.1% vs -0.1% in the previous month indicating some signs of higher energy and food prices filtering through the economy to other products and services

Price pressures continue to grow at the corporate level (see graph of Corporate Services Price Index CSPI and Corporate Goods Price Index CGPI)

Expectations from many dealers and BOJ’s Mizuno is that CPI could reach as high as 2.5% by the fall


[top]

Bloomberg: Poole jumps in


[Skip to the end]

The Fed’s mission is to not let a relative value story turn into an inflation story.

When food/fuel prices rise, consumers have less to spend on other things; so, they should moderate to keep it all a relative value story.

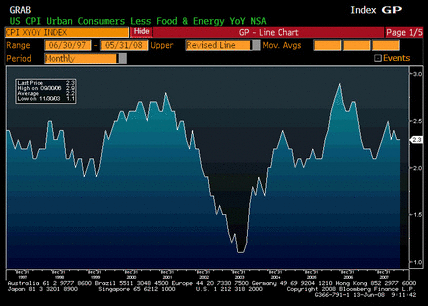
But even though core CPI hasn’t gone up as fast as headline (YET), it has gone up to 2.3%. Rather than stay the same or go down; so, the relative value story is slowing turning into an inflation story.

And my guess is that most of Congress isn’t going to like the idea that the Fed’s job is to keep wages ‘behaving’ (suppressed) when food/fuel goes up, as Poole states below:

Poole Says Fed Needs to Help Prevent Wage Increase

by Kathleen Hays and Timothy R. Homan

(Bloomberg) The Federal Reserve needs to prevent the public’s expectation that inflation will accelerate from spurring demands for higher wages, William Poole, former St. Louis Fed President, said today.

“You want to keep wages behaving,” Poole said in an interview on Bloomberg Television. Once the public’s anticipation of rising prices begins to stoke demands for higher wages, “the jig is up” and inflation becomes harder to eradicate.
The public’s outlook for annual inflation over five years stood at 3.4 percent in June, up from 2.9 percent the same month last year, according to the Reuters/University of Michigan Survey.

Comments by Fed Chairman Ben S. Bernanke and other policy makers this month have compelled traders to increase bets the central bank will start to lift the main lending rate later this year to keep rising food and energy costs from influencing labor agreements and other prices.

“We should be moving sooner rather than later,” Poole said, referring to an interest-rate increase.


[top]

2008-06-13 US Economic Releases


[Skip to the end]


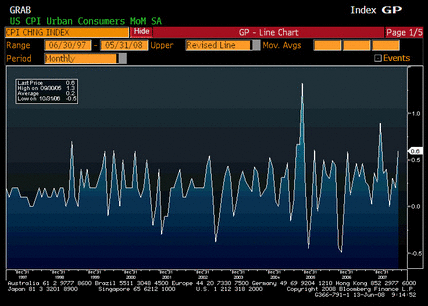
Consumer Price Index MoM (May)

Survey 0.5%
Actual 0.6%
Prior 0.2%
Revised n/a

From Karim:

More divergence between headline and core.

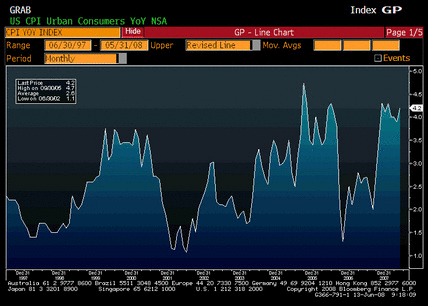
  • Headline up .6498% m/m and 4.2% y/y; 3mth annualized rate of 4.9%
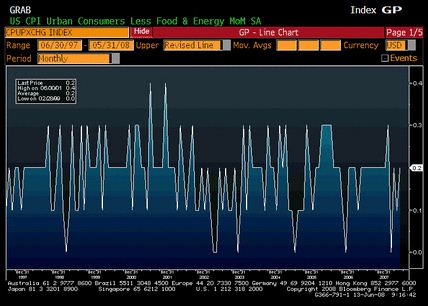
  • Core up .202% and 2.3% y/y; 3mth annualized rate of 1.8%

Trends diverging

  • Gas (up 5.7%) and lodging away from home (+1.3%, but just reversing prior mth’s 1.9% drop) only major outliers
  • Medical (0.2%), oer (0.1%) and education (0.4%) all in line with trend

Kohn defended his inflation forecasting approach on Wednesday (based on ’50yrs’ of analysis). Basically using an ‘expectations augmented’ Philips Curve; meaning slack (which he stated is opening up) is largest determinant of inflation, as long as expectations are stable. He said if ‘over time’ expectations did not recede, it would be ‘troublesome’ for inflation; in the meantime, the Fed would ‘temporarily’ allow a rise in both inflation and joblessness. Some Regional Bank Presidents may feel differently.

[top][end]


CPI Ex Food & Energy MoM (May)

Survey 0.2%
Actual 0.2%
Prior 0.1%
Revised n/a

[top][end]


Consumer Price Index YoY (May)

Survey 3.9%
Actual 4.2%
Prior 3.9%
Revised n/a

The dip in the second half of 2006 was entirely due to the Goldman induced commodity sell off when the gasoline weighting in their index was changed.

Prices have now fully recovered and resumed their uptrend.

[top][end]


CPI Ex Food & Energy YoY (May)

Survey 2.3%
Actual 2.3%
Prior 2.3%
Revised n/a

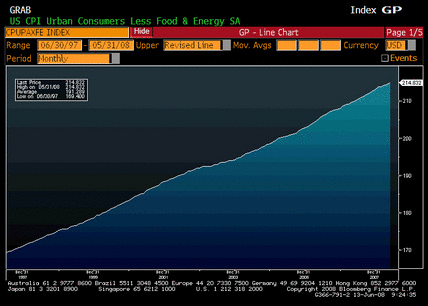
Food and energy prices are just beginning to be passed through to core CPI. Everything is composed of food and energy, so it’s just a matter of time before all prices catch up, particularly with GDP now moving up some with the latest fiscal package kicking in.
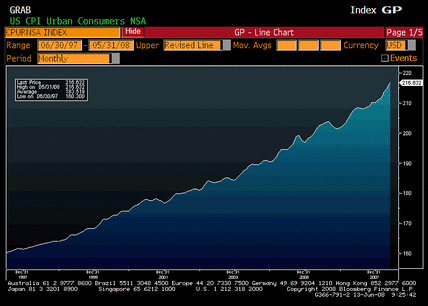
Because headline CPI is a smaller percentage of GDP than it was in the 70’s, the passthrough will take a bit longer.
[top][end]


CPI Core Index SA (May)

Survey n/a
Actual 214.832
Prior 214.398
Revised n/a

[top][end]


Consumer Price Index NSA (May)

Survey 216.205
Actual 216.632
Prior 214.823
Revised n/a

[top][end]


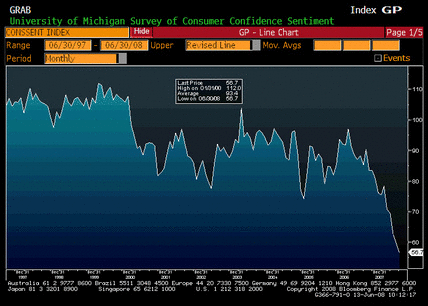
U of Michigan Confidence (Jun P)

Survey 59.0
Actual 56.7
Prior 59.8
Revised n/a

Below expectations, but seems inflation is cutting into confidence, so this doesn’t give the Fed a reason not to hike at the next meeting.

[top][end]


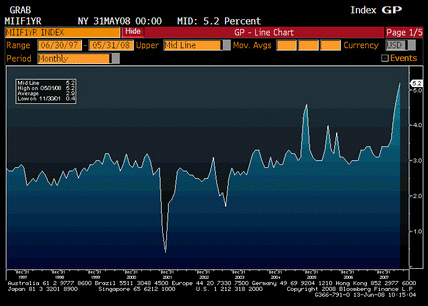
Inflation Expectations 1yr Forward (May)

Survey n/a
Actual 5.1%
Prior 5.2%
Revised n/a

This is persisting at far too high a level for Fed comfort.

[top]