Bloomberg: New-Home Sales in the U.S. Rose 3.3% to 526,000 Pace

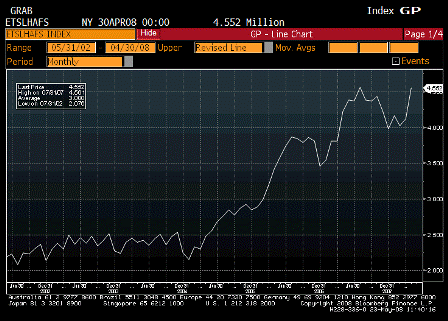
Looking more like a bottom with every report. And most housing reports are ‘fighting’ some strong seasonals in the spring.

by Shobhana Chandra

(Bloomberg) New-home sales in the U.S. unexpectedly rose in April after readings for the prior month were revised down, signaling a worsening housing slump is still a threat to the economy.

Sales increased 3.3 percent to an annual pace of 526,000 from a 509,000 rate the prior month that was the lowest in 17 years, the Commerce Department said today in Washington. A separate report today showed home prices dropped in the first quarter by the most in at least 20 years.

A separate report today showed confidence among American consumers fell to the lowest level since October 1992 this month, raising the risk that households will rein in spending. The Conference Board’s confidence index declined more than forecast to 57.2.

They already have reined it in. That´s what an export economy looks like!

Economists’ Forecasts
Economists forecast new home sales would drop to a 520,000 annual pace from an originally reported 526,000 rate the prior month, according to the median estimate in a Bloomberg survey of 70 economists. Forecasts ranged from 500,000 to 570,000.

Purchases in April were the second lowest since October 1991. The March reading became the weakest since April 1991.

The median sales price last month increased 1.5 percent from April 2007 to $246,100. The figures can be influenced by changes in the mix of sales at the regional level. For that reason, economists prefer price measures that track the same house over time.

They never added that type of comment when prices fell. Still a lot of biased reporting out there.

One such gauge is the S&P/Case-Shiller index. Those figures, also reported today, showed house prices dropped 14.1 in the first quarter compared with the same period in 2007, the biggest decline since records began in 1988.

Much narrower market and different months

Sales of new homes were down 42 percent from April 2007, the biggest year-over-year decline since September 1981, the Commerce report showed.

Better to be 10 miles from hel_ and moving away from it than 100 miles away moving towards it.

Drop in Inventories
One bright spot is that inventories decreased. The supply of homes at the current sales rate dropped to 10.6 months’ worth from 11.1 months in March. The number of homes completed and waiting to be sold decreased to 181,000, the fewest since July.

Shortages looming as suggested in prior emails.

Purchases rose in three of four regions, led by a 42 percent jump in the Northeast. They increased 8.3 percent in the West and 5.8 percent in the Midwest. Purchases dropped 2.4 percent in the South.

Sales of previously owned homes, which account for about 85 percent of the market, fell 1 percent in April, and the supply of unsold properties reached a record, the National Association of Realtors said last week.

New-home purchases, which make up the remaining 15 percent of the market, are considered a timelier indicator because they are based on contract signings. Resales are calculated when a contract closes, usually a month or two later.

2008-05-24 Valance Weekly Chart Review

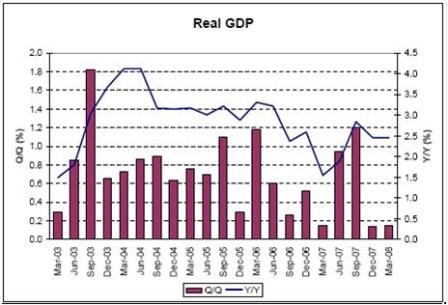
2008-05-24 Real GDP

Hard to see any recession here, and the consensus is for Q1 to be revised up to 0.9%, bringing year over year up to 2.8%.

I also think the estimates of the effects of the fiscal package are on the low side.

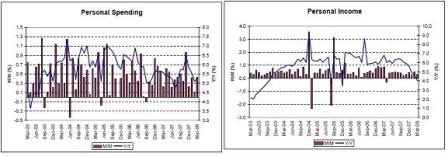
2008-05-24 Personal Spending, Personal Income

Income and spending continue to chug along, ahead of core but not headline ‘inflation’.

2008-05-24 Total Delinquency Rate, Residential Delinquency Rate, All Consumer Loan Delinquency Rate, Credit Card Delinquency Rate

Still moving higher.

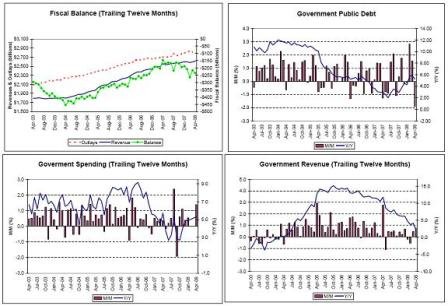
2008-05-24 Fiscal Balance, Government Public Debt, Government Spending, Government Revenue

Fiscal rebates now kicking, with other government spending on the rise as well – should be a decent Q2 and better Q3.

And revenues seems to be holding up also indicating no recession yet.

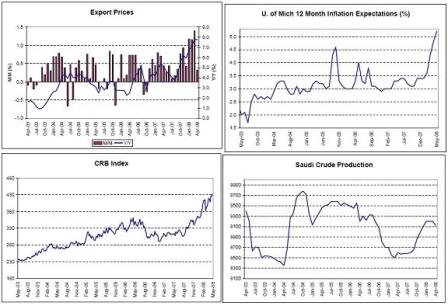
2008-05-24 Export Prices, U. of Michigan 12 Month Inflation Expectations, CRB Index, Saudi Crude Production

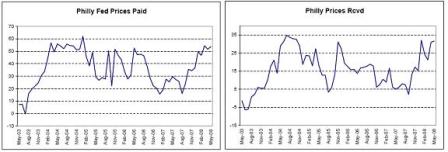
2008-05-24 Philly Fed Prices Paid, Philly Prices Received

While headline CPI took a slight breather due to seasonal factors, the drivers of the current bout of inflation continue without let up, as crude oil touches $135 and the USD fall resumes.

Saudi crude output remains above 9 million bpd, indicating world demand is holding at the higher prices.

Booming exports and export prices work in tandem.

Inflation expectations have alarmed the FOMC with recent speeches indicating there will probably be no more rate cuts if inflation continues to escalate .

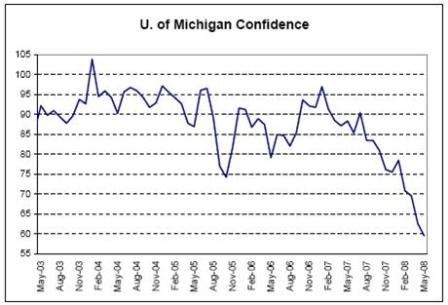
2008-05-24 U. of Michigan Confidence

2008-05-23 US Economic Releases


[Skip to the end]


2008-05-23 Existing Home Sales

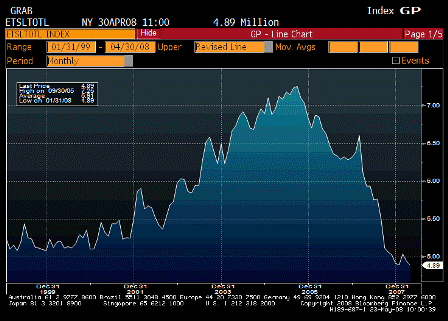
Existing Home Sales (Apr)

Survey 4.85M
Actual 4.89M
Prior 4.93M
Revised 4.94M

Looking more and more like a bottoming action.

[top][end]


2008-05-23 Existing Home Sales MoM

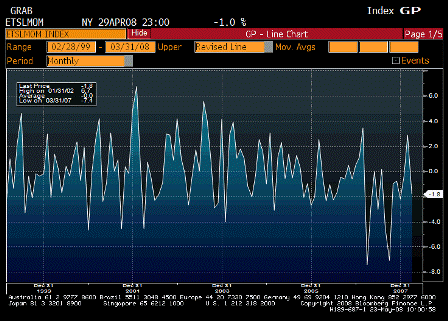
Existing Home Sales MoM (Apr)

Survey -1.6%
Actual -1.0%
Prior -2.0%
Revised -1.8%

A touch better than expected for both March and April.


[top]

5 year tips 5 years forward and recent Fed speeches


[Skip to the end]

2008-05-22 5yr Tips 5yr Forward

5yr Tips 5yr Forward

The Fed watches this carefully in regard to inflation expectations, along with surveys and professional forecasts which have gone up considerably.

The 5 year tips 5 years forward dipped a couple of months ago on the generally commodity sell off, then fell again for short term technical reasons- the first five years went up with crude and the 10 year stayed about the same, so the forwards went down as a matter of arithmetic and little volume – and now this is all sorting itself out along the curve, with the forwards moving up as shown.

Just saw Fed Gov Warsh on TV saying the same thing Vice Chair Kohn said (and was also in the Fed minutes) they have to be careful about perceptions that the Fed’s inflation tolerance have gone up feeding into inflation expectations.

And concern has been further supported by pronouncements that even if the economy weakens some there’s no room for rate cuts.


[top]

2008-05-22 US Economic Releases


[Skip to the end]


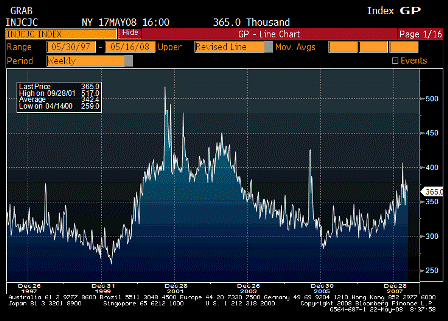
2008-05-22 Initial Jobless Claims

Initial Jobless Claims (May 17)

Survey 373K
Actual 365K
Prior 371K
Revised 374K

Settling down at levels far below recession levels.

[top][end]


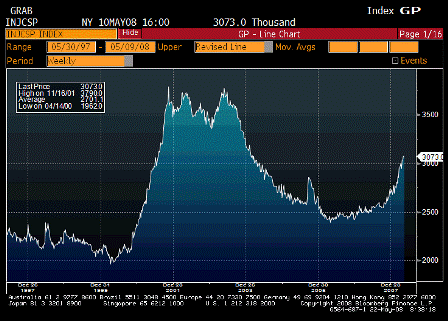
2008-05-22 Continuing Claims

Continuing Claims (May 10)

Survey 3065K
Actual 3073K
Prior 3060K
Revised 3073K

Still far from recession levels but moving up.
Might be some unemployment benefits that have been extended – can’t remember.

[top][end]


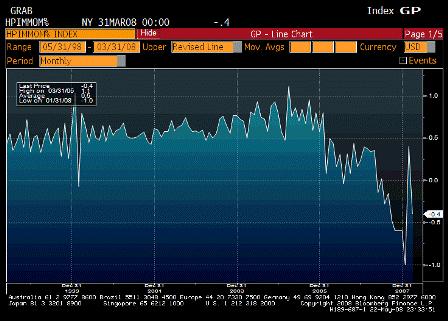
2008-05-22 House Price Purchase Index MoM

House Price Index MoM (Mar)

Survey n/a
Actual -0.4%
Prior 0.6%
Revised 0.4%

Showing signs of stabilizing.

[top][end]


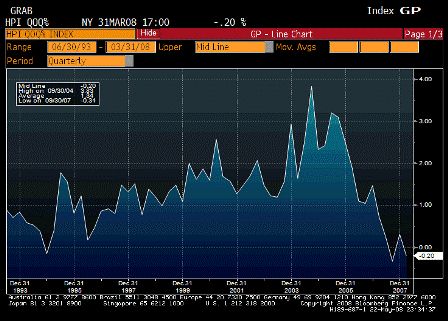
2008-05-22 House Price Total Index QoQ

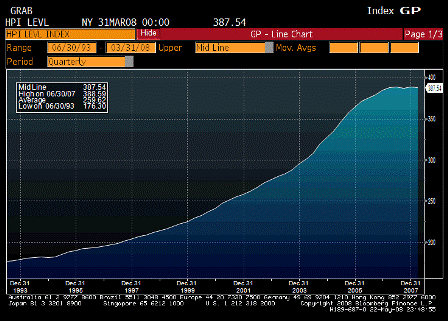
House Price Index QoQ (1Q)

Survey -1.3%
Actual -0.2%
Prior 0.1%
Revised 0.3%

Showing signs of stabilizing.


[top]

Energy crisis ‘solution’


[Skip to the end]

Interesting no one even mentions anything close to my proposal:

Lower the national speed limit to 30 mph for private ground transportation.

    That would:

    • Directly cut gasoline consumption as vehicles are far more fuel efficient at 30 mph than 60 mph.
    • Directly cut air and other pollutions.
    • Reduce long distance driving due to time constraints
    • Increase the demand for public transportation due to time savings issues
    • Reduce the needed safety features as you can’t hurt yourself all that much at 30 mph
    • Lead to much smaller cars and therefore better ‘packaging’ in the cities, reducing traffic and parking demands
    • Change relative real estate values currently distorted by relatively cheap fuel

    The reduction in consumption could be up to 5 million bpd in the US alone, which would:

    • Provide the net supply shock capable of reducing crude and refined product prices
    • Improve our real terms of trade and restore our quality of life
    • Increase national security by reducing dependence on foreign oil
    • Slow environmental degradation

    It’s a political choice- ration by price as we are currently doing, or use other methods, some of which we already do, such as fuel economy standards.

    This proposal simply adds the price of ‘time’ to burning gasoline for all private transportation, thereby making fuel efficient, cleaner, less resource intensive, alternative transportation more attractive.

    Feel free to try to make it happen if you agree!


    [top]

    Reuters: Congress passes bill to sue OPEC for antitrust violations


    [Skip to the end]

    Didn’t know this would be enforceable?

    House passes bill to sue OPEC over oil prices

    by Tom Doggett

    (Reuters) The House of Representatives overwhelmingly approved legislation on Tuesday allowing the Justice Department to sue OPEC members for limiting oil supplies and working together to set crude prices, but the White House threatened to veto the measure.

    The bill would subject OPEC oil producers, including Saudi Arabia, Iran and Venezuela, to the same antitrust laws that U.S. companies must follow.

    The measure passed in a 324-84 vote, a big enough margin to override a presidential veto.

    The legislation also creates a Justice Department task force to aggressively investigate gasoline price gouging and energy market manipulation.

    “This bill guarantees that oil prices will reflect supply and demand economic rules, instead of wildly speculative and perhaps illegal activities,” said Democratic Rep. Steve Kagen of Wisconsin, who sponsored the legislation.

    The lawmaker said Americans “are at the mercy” of OPEC for how much they pay for gasoline, which this week hit a record average of $3.79 a gallon.

    The White House opposes the bill, saying that targeting OPEC investment in the United States as a source for damage awards “would likely spur retaliatory action against American interests in those countries and lead to a reduction in oil available to U.S. refiners.”


    [top]