
Monday, June 10 in Montalto Uffugo (Cosenza): at the Cloister of the Dominican Piazza Municipio 4 17.30 – Public event
Thursday, June 13 in Caltanissetta: Great Hall at the University Consortium (Chair) in Corso Vittorio Emanuele 92 to 10.00 – Public event
Friday, June 14 in Rome at the Teatro Piccolo Eliseo Via Nazionale 183 to 20.00-Public event
Thursday, June 20 in Ferrara at Apollo Multiplex Piazzetta Carbone 35 20.30 – Public event
Friday, June 21 in Treviso at the Congress Hall Hotel Grand Council by the Novotel 140 21.00 – Public event with priority registration (call veneto@memmt.info)
Saturday, June 22 in Cantù (Como): at the Theater Fumagalli via S. Joseph 9 15.30-Public event
Events with priority access subscribers (rooms with capacities of less than 300 seats)
Tuesday, June 11 in Cagliari: Nanni Loy at the Hall of Residence Halls ERSU via Trentino 18.00 2 – To participate: sardegna@memmt.info
Thursday, June 13 in Palermo at Palazzo Comitini of Via Maqueda 100 to 20.00 – To participate: sicilia@memmt.info
Saturday, June 15 in Avezzano (L’Aquila): at the City Hall Council Chamber of Avezzano in Piazza della Repubblica 7 to 17.oo-To participate: abruzzo@memmt.info
Sunday, June 16 in Santa Maria degli Angeli (Assisi): Upper Room at the Hotel Avenue Patron of Italy 70 at 17:00 – To participate: umbria@memmt.info
Monday, June 17 in Recanati: at the Great Hall of the Municipality of Recanati Piazza Giacomo Leopardi 17.00 – To participate: marche@memmt.info
Monday, June 17 in Crawley: at the Sala Verdi Municipality of tracks in Piazza Vittorio Emanuele II 20.30 – To participate: marche@memmt.info
Tuesday, June 18 in Siena, at the Auditorium Confesercenti, State Road 73 Sun 10 21.00 – To participate: read here
Wednesday, June 19 in Savona: at the Library UBIK of course Italy 116R 18.00 – To participate: liguria@memmt.info
ADP
Continuing evidence of deceleration.
A 150,000 jobs print Friday puts the 3 month average back to around where it was when the Fed expanded QE due last year due to cliff fears, etc.
So with CPI also weak, at least for now the Fed continues to fail on both its mandate targets. Seems the FOMC doesn’t yet appreciate the power of the interest income channels, as expanded QE means that much more interest income is being removed from the economy.
And the ‘government getting out of the way’ means less ‘free income’ for the economy, meaning increased domestic ‘borrowing to spend’/’dipping into savings’ for all practical purposes is the only way to ‘jump the gap’ of reduced govt deficit spending and sustain output and employment.
In other words, the risk is that the already narrowing govt deficit was proactively made too small to support the current domestic credit structure.
And if so, market forces work to increase govt deficit spending/restore required private sector net financial assets the ugly way- falling revenues and increased transfer payments, aka the automatic fiscal stabilizers.
Much like we’ve seen in the euro zone, the UK, Japan, etc. etc. etc. etc. etc.
ADP reports 135,000 private-sector jobs created in May, vs. estimate of 165,000
By Jeff Cox
June 5 (CNBC) — Private-sector job creation was weaker than expected in May, as the economy struggled to break free of what appears to be a summer slowdown on the horizon.
ADP and Moody’s Analytics reported just 135,000 new positions for the month, below expectations of 165,000.
Services were responsible for all the new jobs, adding 138,000, while the goods-producing sector lost 3,000 positions.
Construction added 5,000 workers, but that was offset by a loss of 6,000 manufacturing jobs.
The poor showing sets the stage for a possibly weak nonfarm payrolls report on Friday, when the Labor Department had been expected to show 169,000 new jobs.
Economists sometimes will use the ADP numbers to adjust their estimates for the government account, even though the private-sector count has been a historically unreliable gauge.
“The job market continues to expand, but growth has slowed since the beginning of the year,” Moody’s economist Mark Zandi said in a statement.
Financial markets offered muted reaction to the report, with stock market futures off their lows. Investors have been using the weak economic reports to fuel hopes that the Federal Reserve will continue with its aggressive easing program.
The Fed is creating money to buy $85 billion in Treasurys and mortgage-backed securities each month.
Recently, some members have suggested that the central bank begin easing its purchases, and markets in turn have been unsettled as interest rates have climbed and equities have been volatile.
A weak payrolls number Friday could go a long way toward squelching talk that the Fed will begin tapering purchases as soon as this month.
“As far as the tapering debate goes, the report does nothing to bolster expectations that the Fed will ease its foot off the pedal over the summer,” Andrew Wilkinson, chief market economist at Miller Tabak, said in a note.
mtg purchase apps down
It still all looks to me like it would look if demand was decelerating from the tax hikes and sequesters, and if QE was in fact a tax.
Mortgage Applications Drop as Interest Rates Surge
June 5 (Reuters) — Interest rates on U.S. mortgages continued to surge last week, rising above four percent for the first time in a year and driving down demand from homeowners to refinance, data from an industry group showed on Wednesday.
Fixed 30-year mortgage rates climbed 17 basis points to average 4.07 percent in the week ended May 31, the Mortgage Bankers Association said. Rates have risen by 48 basis points in the last four weeks, with the most recent upswing driven by nervousness that the Federal Reserve could slow its economic stimulus efforts sooner than had been anticipated.
Last week’s interest rate was the highest since April 2012 and the first time rates have been above 4 percent since early May of last year.
With the Fed keeping borrowing rates low through its massive bond buying program, historically cheap mortgages have been one of the drivers of the recovery in the housing sector as the affordability lured in buyers.
But the recent rise in rates could test potential buyers’ resolve. MBA’s seasonally adjusted index of mortgage application activity, which includes both refinancing and home purchase demand, tumbled 11.5 percent last week.
Demand for refinancing was hit hardest by the acceleration in rates, with applications slumping 15.0 percent. The refinance share of total mortgage activity fell to its lowest level since July 2011 at 68 percent of applications from 71 percent the week before.
The gauge of loan requests for home purchases – a leading indicator of home sales – held up relatively better, falling just 1.6 percent.
The survey covers over 75 percent of U.S. retail residential mortgage applications, according to MBA.
Along with low interest rates, rising prices, a decrease in foreclosures and a tighter supply of available homes have all helped the housing sector get back on its feet.
Fed chairman Ben Bernanke said last month the Fed could scale back the pace of its bond purchases at one of the “next few meetings” if the economic recovery looked set to maintain forward momentum.
The Fed is currently buying $85 billion a month in bonds and mortgage-backed securities. Along with some improving economic data, the comments sowed concerns among investors that the Fed’s ultra-loose policy could end sooner than expected.
ISM
Karim writes:
Weak, with employment holding steady and orders and shipments lower. At odds with much of the recent hard data for other sectors and other surveys (consumer surveys, NFIB,etc).
As mentioned, manufacturing hasn’t contributed to job growth for the past 2mths.
Should receive a boost from the automakers not shutting down as usual this summer.
| May | April | |
| Index | 49.0 | 50.7 |
| New Orders | 48.8 | 52.3 |
| Production | 48.6 | 52.3 |
| Employment | 50.1 | 50.2 |
| Supplier Delvs | 48.7 | 50.9 |
| Inventories | 49.0 | 46.5 |
| Prices | 49.5 | 50.0 |
| Backlog orders | 48.0 | 53.0 |
| Exports | 51.0 | 54.0 |
| Imports | 54.5 | 55.0 |
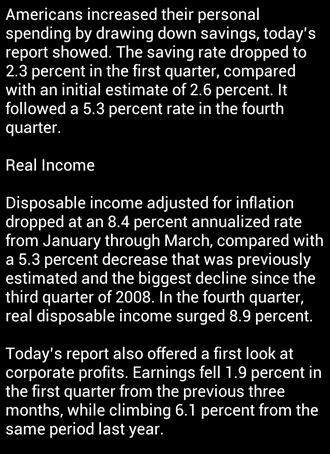
Income and spending graphs
Yes, a little bounce back from subdued Q4 due to cliff fears, and a tenth here and there on real vs nominal, etc., but if it was decelerating from tax hikes and sequesters isn’t this what it would look like?
Chicago ISM
Today’s zig up in this volatile series doesn’t look like much on the longer term graph.
JPY
Unfortunately what Japan risks is an exit from headline deflation but no growth in output and employment to show for it. What they’ve done might be to cause the currency to depreciate about 25% via ‘portfolio shifting’, which may not expand real domestic demand. In fact, in real terms, it may go down, leaving them with higher prices and a lower standard of living.
Yes, the currency shift makes imports more expensive, which means there will be some substitution to domestic goods which cost more than imports used to cost, but less than they now cost. But for many imports there are no substitutions, so the price increase simply functions like a tax increase.
And yes, exports, particularly nominal, will go up some, but so does the cost of inputs imported. And yes, some inputs sourced elsewhere will instead be sourced locally, adding to domestic employment and output, but not to real domestic consumption.
At the macro level what counts is what they do with regards to keeping the govt deficit large enough to accommodate the need to pay taxes and net save. Net exports ‘work’ by reducing real terms of trade when the govt purchases fx, which adds net yen to their economy. I call the fx purchases ‘off balance sheet deficit spending’. But so far the govt at least says they aren’t even doing that, and the lifers etc. now deny having done much of that either?
What has changed fundamentally is they are importing more energy since shutting down their nukes. Again, this functions as a tax on their economy (taxonomy for short? really bad pun intended!).
On the other hand, as above, buying fx by either the private or public sector is, functionally, deficit spending, which in this case first supports exports, but could add some to aggregate demand, depending on the details of relevant propensities to consume, etc.
The entire point of all this is Japan can cause some ‘inflation’ as nominal prices are nudged up by the currency depreciation, but with only a modest increase in real output via an increase in net exports that fades if not supported by ongoing fx purchases. And all in the context of declining real terms of trade as the same amount of labor buy fewer imports, etc. which is the engine that makes it ‘work’ on paper.
And for the global economy it’s another deflationary shock in a deflationary race to the bottom as other wanna be exporters compete with Japan’s massive cut in real wages.
So yes, they are trying to cause inflation, but not for inflation’s sake, but as a way to increase output and employment. But I’m afraid what they are missing that the causation doesn’t work in that direction.
In conclusion, this was the thought I was trying to flesh out:
Just because increasing output can cause inflation, it doesn’t mean increasing inflation causes real output and employment to increase.
sorry, this all needs a lot more organizing. Will redo later.
can’t help it, seeing weakness everywhere
Initial claims,GDP, Italy
Karim writes:
-
Q1 Real GDP was revised down just 0.1% to 2.4% but the underlying changes were more volatile:
- Real Consumer Spending up to 3.4% from 3.2%
- Capex up from 3% to 4.6%
- Government consumption down to -4.9% from -4.1%
- Inventory contribution down to 0.6% from 1%
Takeaway is underlying private demand was stronger than initially reported, government was more of a drag and inventories have more room to expand.
Yes, but note this:
The drag from government and inventories was partially offset by an upward revision to consumer spending, which rose at a 3.4 percent annual rate, up two tenths of a point from the government’s previous estimate. However, a cloud hung over that category, as most of the upward revision was due to higher sales of gasoline. Higher prices at the pump are a burden on consumers, leaving them less money to spend on other things.
And:
After-tax corporate profits fell at a 1.9 percent annual rate in the quarter, the first decline in a year.
Optimism on late 2013 and 2014 growth (Rosengren speech yesterday) stems from government consumption turning from being a drag to neutral sometime in Q3 or Q4, leaving in place the underlying pace of private demand growth of about 3%.
Yes, the question being ‘leaving in place’, as govt spending feeds private sector sales, etc.
So the assumption is the private sector spending that’s been taking place will continue at that pace post tax hikes and sequesters. And note that growth in the credit driven spending (cars, appliances, housing) is showing at least hints of slowing.
Department of Labor reported 5 states didn’t complete their claims count last week due to the holiday, so the rise in claims to 354k to be taken with a grain of salt.
Yes, but here too are at least hints that claims bottomed a few weeks ago and have edged a bit higher since then, and that Non Farm Payrolls peaked in Feb, and if next weeks number prints at 150,000 the three month average is back down to around that level.
And, again, it’s the year end tax hikes and subsequent sequesters that are causing me to look for evidence of subsequent slowing.
This is notable for Italian (and European) growth. Eur10bn (mid-point of estimates below) is worth about a 0.5% add to GDP growth:
EU Recommends Removing Italy From Excessive-Deficit Procedure (Bloomberg) The European Commission recommended today lifting an excessive-deficit procedure against Italy after the government brought its budget shortfall within the European Union limit. “Our task is to respect our commitments with Europe and implement the program the parliament has given its vote of confidence on,” Italian Prime Minister Enrico Letta said. Ending the strict EU monitoring of Italian public spending may free up resources of as much as 12 billion euros, Regional Affairs Minister Graziano Delrio said in an interview with daily La Stampa May 27. “The closing of the procedure alone allows us to boost spending by between 7 and 10 billion euros, 12 billion euros in the most optimistic forecast,” Delrio said in the La Stampa interview.
Yes, this would be helpful, but a deceleration in expected US growth hurts Europe as well.
Initial Claims YTD:
Full size image
Nonfarm Payroll Change YTD:
Full size image
Larry Fink talking position
Americans are not saving enough for retirement, which is a bigger issue than tax policy, Fink said.