Dallas Fed

They even tried to spin this positively:

United States : Dallas Fed Mfg Survey
er-6-29-5
Highlights
The Texas manufacturing sector is still falling but not falling as fast as prior months. The general activity index improved but to a still very weak minus 7.0 from a deeply negative minus 20.8 percent in May. The production index improved to minus 6.5 from minus 13.5 percent in the May report.

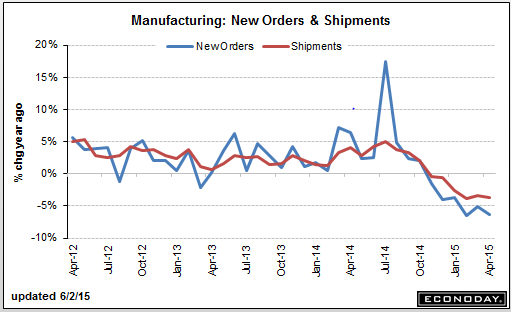
New orders, however, remain very weak, still in the double-digit negative column at minus 10.3. Shipments are in the high single-digit negative column at minus 8.8. Nearing the plus column, however, is employment, at minus 1.2 vs May’s minus 8.2. Price data show upward pressure for inputs, moderating downward pressure for finished goods, and steady upward pressure for wages.

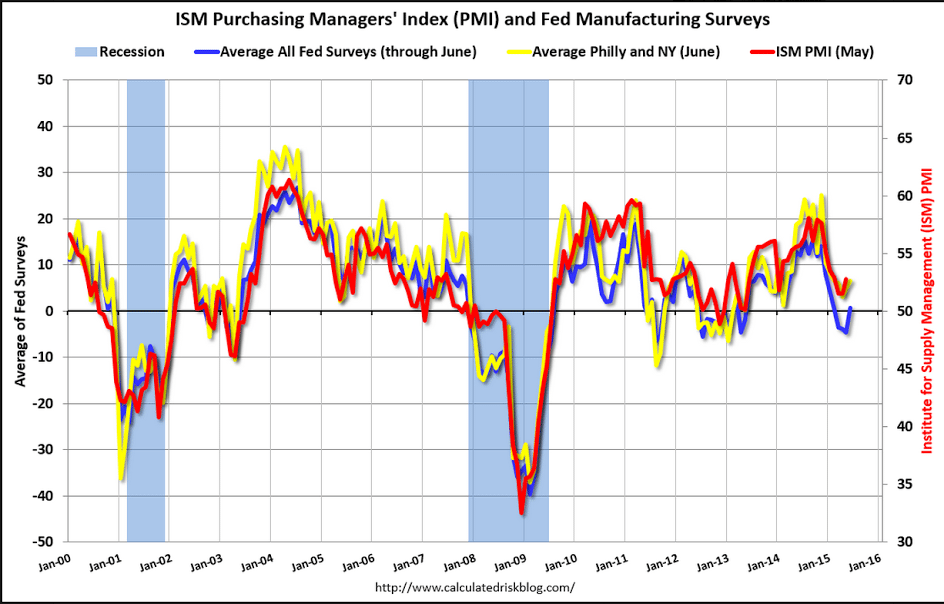
This is the last of the regional manufacturing surveys from the Fed and the bulk, with the exception of the Philly Fed, pointing to another month of weakness for the sector which continues to get hit with a one-two punch: weakness in exports and also, as especially evidenced in this report, weakness in energy equipment.

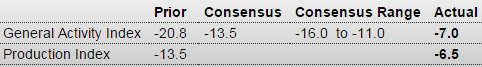
Check out the individual indicators, where only the ‘activity index’ was up:
er-6-29-6
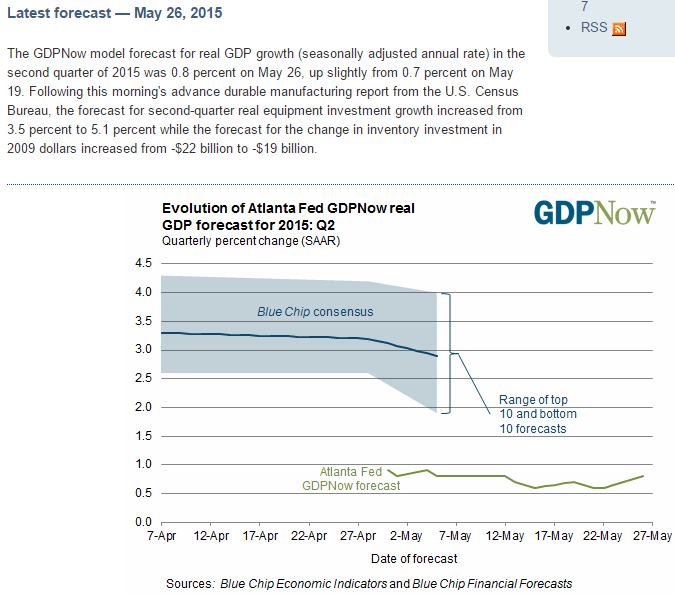
And none of this indicates Q2 improved from Q1, just maybe got worse less fast:

er-6-29-7

Consumer spending, rail traffic

Personal Income and Outlays
er-6-26-1
Highlights
The consumer came to life in May, boosted by a 0.5 percent rise in personal income and helping to support a 0.9 percent surge in personal outlays that reflects heavy spending on autos and retail goods. And gains are not inflationary, at least yet, based on the very closely watched core PCE price index which edged only 0.1 tenth higher in May and is at a very benign 1.2 percent year-on-year rate which is actually down a tenth from an upward revised April.

Components on the income side are very solid with wages & salaries up 0.5 percent in the month. Both proprietors’ income and rental income show especially strong gains. Spending components show special strength for durables, again tied especially to autos, and also strong gains for non-durables, here tied to higher pump prices. Spending on services once again shows an incremental gain.

Turning back to PCE prices, the overall price index looks a little hot in May at plus 0.3 percent but the year-on-year rate is unchanged at only 0.1 percent. That’s right, that’s the year-on-year rate at only the most incremental level of inflation. And the 1.2 percent year-on-year core appears to be moving in reverse, down 1 tenth in each of the last two reports and further away from the Fed’s 2 percent target.

Consumers, in an expression of their confidence, dipped into their savings to spend, with the savings rate down 3 tenths to 5.1 percent. This is a good report for the bulls, showing a strong non-inflationary bounce for the second quarter. This report won’t be keeping the doves up at night and does not move forward the Fed’s coming rate hike.

First, note the last wiggle up all the cheer leading is about, up from the previous flat one on the 5 year chart:
er-6-26-2
And the year over year growth rate for the last 10 years, and how the last time it got over 3% it didn’t stay there long:
er-6-26-3
New vehicle sales may have been up for the month, but the year over year industry growth rate is generally slowing:
er-6-26-4
er-6-26-5
And retail was reported higher, but hasn’t yet even recovered from the prior dip:
er-6-26-6
er-6-26-7
And, turns out, here’s where the growth is also coming from lately- health care premiums, which aren’t tracking with the lower growth of actual health care prices:
er-6-26-8
er-6-26-9
Construction appears to be growing at historical rates since the crisis dip:
er-6-26-10

The growth in health care employment has picked up to more historic levels after a large decline, so perhaps the larger increases we’ve seen are just a case of ‘catch up’, nor does there seem to be any unusual wage growth associated with the additional employment:
er-6-26-11
er-6-26-12
Nothing good happening here:
er-6-26-13

Greece at the cross roads

On Fri, Jun 19, 2015 at 6:47 AM, wrote:
Hi Warren!

Do you know this proposal by Rob Parentau and Trod Andresen of introducing a parallel currency in the form of Tax Anticipation Notes?

A program proposal for creating a complementary currency in Greece

From rumours seem it could be introduced in Greece.

What do you think?

Yes, it’s been around for a while- a take off on Mosler bonds and my California proposal years ago when they had problems.

The Greeks have known about these things all along but didn’t want to go in that direction. If they come to any kind of agreement, they get full conventional funding. If they don’t, they are afraid of what might happen to the banking system and the economy if the EU retaliates, whether or not they get alternative funding. And that could mean political turnover and the rise of Golden Dawn, etc.

So it hasn’t been about funding- it’s been about coming to terms that allow Greece to stay in the EU. As we discussed, leaving is looked at as a move to the right, and a victory for the right and nationalism.

It’s the right that has said the the EU was a mistake from the beginning for reasons of governance more than economics. The current Greek leftist government considers themselves as ‘progressive Europeans’ who look to the European Union and the common currency as the progressive future, moving away from the nationalism that caused the previous centuries of warfare, etc. So their first choice is to remain Europeans and work within the EU for a progressive economic agenda.

If they do break from the EU and move towards alternative finance to support their progressive economic agenda, which could very well happen, they will see it as a catastrophic failure of their diplomatic efforts to achieve their personal ideals.

Car sales, Redbook retail sales, Factory orders

Strong number, bouncing from winter slowdown. Looking at the chart seems spikes are followed by dips, and imports are a large factor as well. Hopefully it continues:

United States : Motor Vehicle Sales
er-6-3-1
Highlights
Consumers weren’t holding back in May when it came to buying cars and trucks which sold at a 17.8 million annual rate for a whopping 7.9 percent gain from April. The rate is above the top-end of the Econoday forecast and the strongest since July 2005. The monthly percentage change is the strongest since March 2010. Incentives and low rates no doubt boosted sales but May’s surge hints at pent-up demand, demand that has built up over the last six months when sales declined four times.

Among details, sales of North American-made vehicles rose 7.6 percent to a 14.2 million rate in a jump that points to a rise in future auto production and a rising auto contribution in the factory sector. Foreign-made vehicles sold at a 3.6 million rate for 9.1 percent gain which is among the largest monthly gains on record for this reading.

The April retail sales report proved to be a flop, but May’s vehicle sales data point to a big surge for the motor vehicle component which makes up nearly 1/4 of total retail sales.
er-6-3-2

This retail sales measure should have picked up by now:
er-6-3-3
Nor is this any good:

Factory Orders
er-6-3-4
Highlights
Factory orders fell 0.4 percent in April for the 8th decline in 9 months, a depressing streak interrupted only by March’s revised gain of 2.2 percent, a gain inflated by a monthly swing higher for civilian aircraft. There are significant downward revisions to the durable goods side of the report that was first published last week, with durables orders now down 1.0 percent vs an initial decline of 0.5 percent. Capital goods in that report looked strong, but not with today’s revision with orders for non-defense capital goods excluding aircraft sinking 0.3 percent vs an initial and very strong gain of 1.0 percent.

Ex-transportation, orders are unchanged, well down from the 0.5 percent gain in the durable goods report. Nondurable goods are a positive offset in today’s report, up 0.2 percent and reflecting strength for chemical products.

Outside of new orders, data show no change for shipments and a 0.1 percent dip for unfilled orders, both very weak. The lack of punch is putting pressure on inventory levels where the inventory-to-shipments ratio rose to 1.35 from 1.34 in March.

The downward revision to core capital goods orders is a setback, pointing to much less business optimism than first reported. The factory sector did not get any lift at all coming out of the first quarter, reflecting weak exports and trouble in the energy sector. Manufacturing employment has understandably been very soft with the next update part of Friday’s employment report.
er-6-3-5

Atlanta Fed, Redbook retail sales, mtg purchase apps

Still not showing much of a rebound from Q1, with their Q2 GDP forecast now at only .8% annualized:
er-5-27-1
Continues to disappoint and still looking worse than it was in Q1:

Redbook Retail Sales
er-5-27-2

Up 1% after being down 4% last week:

United States : MBA Mortgage Applications
er-5-27-3
Highlights
Mortgage rates are moving higher and squeezing out what had been gains in purchase applications. Purchase applications did rise in the May 22 week but only 1.0 percent. Year-on-year, applications are still up a healthy 14.0 percent. Demand for refinancing continues to shrink, down 4.0 percent in the latest week. The average 30-year fixed mortgage for conforming loan balances ($417,000 or less) rose 3 basis points to 4.07 percent.

Purchase Mortgage level:

sg2015052734828

Business inventories, retail sales charts, Atlanta Fed

Still way high, especially with today’s retail sales growth at 0

United States : Business Inventories
er-5-13-1
Highlights
Business inventories don’t look quite as bloated after a small 0.1 percent gain in March that is under the 0.4 percent gain in business sales, taking the stock-to-sales ratio down to 1.36 from February’s recovery high of 1.37.

The improvement in March is centered, however, in the retail sector where, thanks to that month’s surge in sales, the stock-to-sales ratio slipped to 1.46 from 1.47. Whether further improvement can be expected in April is uncertain given this morning’s disappointing retail sales report.

The stock-to-sales ratios for the report’s two other components were unchanged, at 1.35 for manufacturers and at 1.30 for wholesalers.

Inventory overhang, built up during the slow first quarter, is widely seen as a risk for second-quarter growth, though this report suggests that the inventory headwind may not be that severe. Today’s data follow yesterday’s small business optimism report where inventory readings were surprisingly low.
er-5-13-2
er-5-13-3
er-5-13-4
er-5-13-5
er-5-13-6

Q2 forecast down to .7% as nothing yet stepping up to replace the lost oil and gas capex spending:
er-5-13-7

EU GDP, Mtg apps, retail sales

European Union : GDP Flash

er-5-13-8

Highlights
Eurozone economic activity extended its recovery into last quarter with a provisional and slightly smaller than expected 0.4 percent increase in real GDP versus the previous period. The fourth quarter rise was unrevised at 0.3 percent and annual growth edged a tick firmer to 1.0 percent. In line with normal procedure, Eurostat provided no details of the latest GDP expenditure components.

Growth was hindered by a sharp slowdown in Germany where total output expanded a quarterly 0.3 percent following a 0.7 percent rise at the end of last year. However, France (0.6 percent after 0.0 percent) was surprisingly robust and Spain (0.9 percent after 0.7 percent) posted its strongest performance in more than seven years. Italy (0.3 percent after 0.0 percent) saw its first positive print since the third quarter of 2013. Amongst the smaller countries Cyprus (1.6 percent after minus 0.4 percent) finally pulled out of recession but Finland (minus 0.1 percent after minus 0.2 percent) saw a second successive quarter of falling output.

Early signals on the current quarter have pointed to little change in Eurozone economic momentum which will probably be seen as disappointing by policymakers and investors alike. Still, the ECB’s QE programme was only launched in March so much of its potential benefit has yet to be realised. That said, with the region’s inflation currently running at just a provisional 0.0 percent annual rate, Eurozone governments and the ECB will be hoping for a significantly stronger growth profile over the second half of the year.

Q2 not getting any help here…

United States : MBA Mortgage Applications
er-5-13-9

Still not spending that gas savings…
Q2 still not showing signs of life

Retail Sales
er-5-13-10

Cleveland Fed on low wage growth, Atlanta Fed Q2 gdpnow, factory orders

Behind the Slow Pace of Wage Growth

er-5-4-1

er-5-4-2

Factory Orders
er-5-4-3
Highlights
Boosted by aircraft and also by motor vehicles, factory orders rose an as-expected 2.1 percent in March. March’s gain ends what were 7 straight declines as February, which was initially at plus 0.2 percent, is revised now to minus 0.1 percent. The 7 straight declines are the most striking evidence of how hard the manufacturing sector has been hit, by the strong dollar that weakens exports and also specific trouble in the energy sector due to the downturn in oil.

But in March, the sector got a big boost from civilian aircraft, an industry where big monthly swings are normal, but also from motor vehicle & parts where orders rose 6.0 percent in what is one of the very strongest gains of the recovery. Excluding transportation, however, orders were unchanged compared to only a 0.1 percent gain in February, with the latter revised down sharply from an initial reading of plus 0.8 percent.

Energy equipment rebounded 4.8 percent in the month but following a long streak of declines including an 18.5 percent drop in February. Industrial machinery was also down on the month. Other industries on the plus side include computers and defense capital goods.

Orders for capital goods in general were mixed, up only 0.1 percent on the core, which excludes aircraft, and extending their downward slope.

Other readings include a sizable 0.5 percent rise in shipments. Another plus is a small rise in unfilled orders which have been especially weak. Inventories held steady relative to sales, with the inventory-to-sales rate unchanged at 1.35.

The pop in March ends the first quarter on a positive note but the early indications on the second quarter, despite expectations of an outsized weather boost, have all been soft.
er-5-4-4

Remember all that cheerleading last year about how NOW capex was going to pick up?
er-5-4-5
er-5-4-6
er-5-4-7
No chance of recession?
er-5-4-9

Redbook retail sales, consumer confidence, Richmond Fed

Not good again.
Looks like more than a ‘soft spot’ as so far no improvement for Q2:

Redbook
er-4-28-7
Highlights
It’s hard to make heads or tails of weekly retail sales data surrounding Easter and its shifting comparisons. Redbook’s same-store year-on-year sales tally came in at a very weak plus 1.4 percent in the April 25 week which however is up from plus 0.8 percent in the prior week but well down from the plus 3.0 to 3.5 percent underlying trend. This trend, or somewhere close to it, is likely to re-emerge in next week’s report when Easter calendar distortions are no longer in play. Behind the distortions, however, Redbook does note that the overall performance is below plan though warmer weather did help seasonal sales in the latest week.
er-4-28-8

United States : Consumer Confidence
er-4-28-9
Highlights
Consumer confidence has fallen back noticeably this month, down more than 6 points to a much lower-than-expected 95.2. This compares very poorly with the Econoday consensus for 103.0 and is even far below the Econoday low estimate of 100.5. The weakness, ominously, is the result of falling assessments of the jobs market, both the current jobs market and expectations for the future jobs market. The second quarter, which is expected to be much stronger than the weather-depressed first quarter, isn’t likely to get off to a fast start, at least as far as this report goes.
er-4-28-10

Richmond Fed Manufacturing Index
er-4-28-11

Recent History Of This Indicator
The Richmond Fed manufacturing index in March fell into contraction, to minus 8 vs zero in February. Order readings, both for new orders and backlogs, were down substantially as were shipments and the workweek. Hiring, however, remained respectable, at least for now. Price readings showed only the most marginal pressure.

wage growth and business investment

Interesting how these two reports relate to each other.

And the circled section is the last time the street was screaming about ‘wage inflation’ saying that every time in the past it went up as it had to that point it kept going up for the next 4 years. But it does track somewhat with investment, below:
ahe

Wage Growth Is Poised to Accelerate

By Gene Epstein

April 24 (Barrons) — Jason Benderly of Applied Global Macro Research has built an explanatory model that accounts for fluctuations in labor compensation with a far closer fit than a single-variable model that consists solely of the change in the unemployment rate. These four key variables (the change in the jobless rate, the jobless rate, the change in labor productivity, and after-tax profit margins), along with two other, minor ones relating to prices, explain real hourly compensation, which includes all benefits, going back to 1960. With no trouble explaining the recent period, the model predicts an acceleration in wage growth.

Weak U.S. business spending data hints at sluggish growth rebound

By Lucia Mutikani

April 24 (Reuters) — U.S. business investment spending plans fell for a seventh straight month in March. Non-defense capital goods orders excluding aircraft declined 0.5 percent last month after a revised 2.2 percent drop in February, which was the biggest decline since July 2013. In March, shipments of core capital goods fell 0.4 percent after a downwardly revised 0.1 percent gain in February.Shipments in February were previously reported to have risen 0.3 percent. That downward revision together with March’s weak reading could see economists trim their first-quarter GDP growth estimates.

Looks like this is coincident to recession, unless rescued by another fracking boom…
capex
Sure looks to me like there’s a high probability this cycle is over. And could have been over last year if not rescued by the fracking boom.

Fracksional reserve banking???
:( sorry!!!