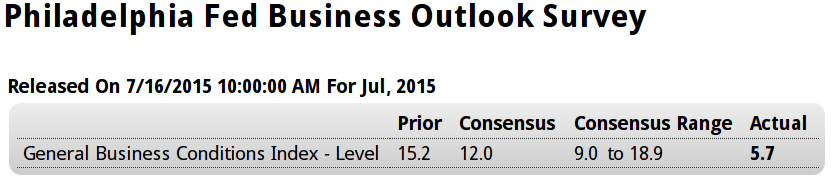
Ugly:
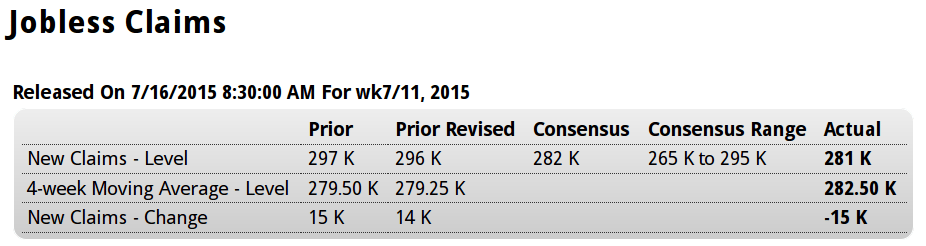
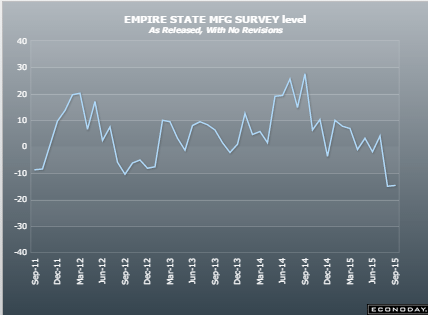
Empire State Mfg Survey

Highlights
The shocking weakness in August was no fluke as the Empire State index came in far below expectations for September, at minus 14.67. Next only to August’s minus 14.92, September’s reading is the weakest of the recovery, since April 2009. And, unfortunately, judging by new orders, activity in October may prove to be just as weak. New orders are deeply negative this month, at minus 12.91 vs minus 15.70 in August and the fourth straight negative reading. And manufacturers in the New York region won’t be able to turn to backlogs which are extending their long run of contraction at minus 8.25.
Searching for positives in this report is difficult. Negative signs sweep components including shipments, at minus 7.98 following August’s minus 13.79. If extended to national data, these results point to trouble for third-quarter GDP. Employment is at minus 6.19 which is the first negative reading since all the way back in January 2013. The workweek, reflecting the weakness in shipments, is down very steeply at minus 10.31. Price data show outright contraction for finished goods at minus 5.15 — the first negative reading since November 2013. And rounding things out is a 10 point loss in the 6-month outlook to 23.21 which is the weakest since, once again, January 2013.
The negative signals from this report from August were not confirmed by other regional indications but could be confirmed as early as this morning with the August industrial production report. Strength in the auto sector gave manufacturing a lift in June and July but this lift, given weakness in foreign markets and the energy sector, may not have extended too far, at least based on this report.
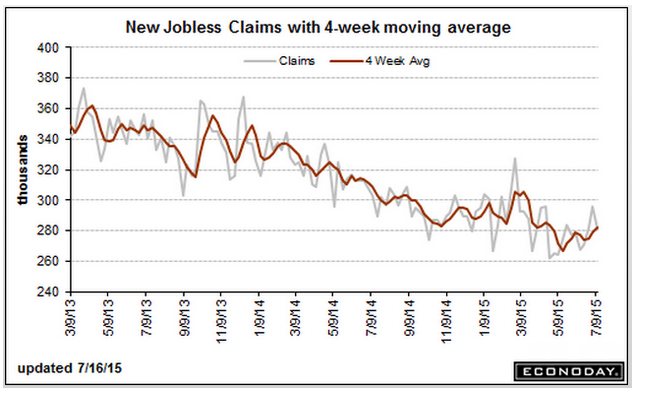
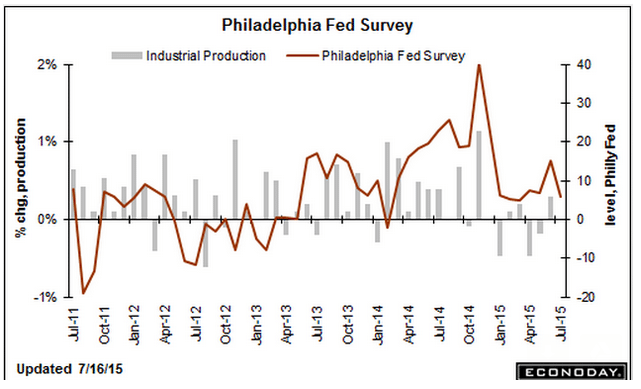
Bad here too, as excess prior inventory building led to production cuts:
Industrial Production
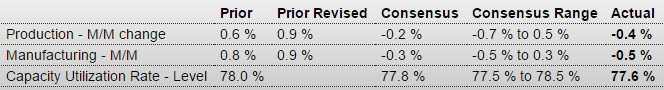
Highlights
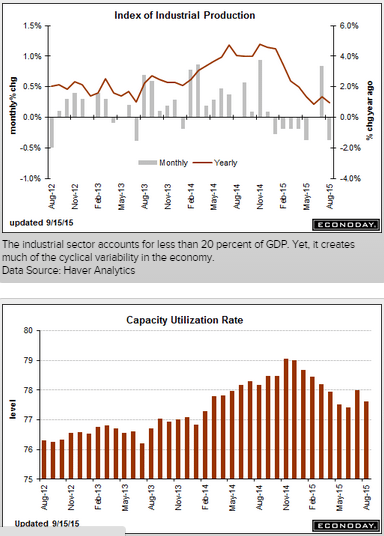
A reversal in the auto sector pulled down industrial production in August, falling 0.4 percent vs the Econoday consensus for a 0.2 percent decline. The manufacturing component fell 0.5 percent, also deeper than the consensus at minus 0.3 percent. In an offset, gains in July proved more robust than initially reported with total industrial production revised 3 tenths higher to plus 0.9 percent and manufacturing revised 1 tenth higher, now also at plus 0.9 percent.
Motor vehicle production is August’s disappointment, down 6.4 percent following July’s giant 10.6 percent spike. When excluding motor vehicle production, however, industrial production was unchanged in August following respectable gains of 0.3 percent in the prior two months. But these readings are far from spectacular and the weakness in the latest month could be a signal of retrenchment tied to Chinese-based volatility.
Turning to the report’s other two components, utility production rose 0.6 percent in August with mining at minus 0.6 percent. Mining, hit by weak commodity prices, has been hurting all year with the year-on-year reading at minus 3.2 percent. Utilities, however, are up 3.2 percent year-on-year which leads the major components as manufacturing’s year-on-year rate is a soft looking plus 1.4 percent. Total industrial production is up only 0.9 percent year-on-year.
This weakness is reflected in capacity utilization which is at 77.6 percent in the August report, down 4 tenths in the month and 2 tenths lower than consensus. Manufacturing utilization is at a soft 75.8 percent vs an unrevised 76.2 percent in July.
The vehicle-led burst in the manufacturing sector faded noticeably by summer’s end, a reminder that foreign demand for U.S. goods is weak and that the domestic energy sector is suffering. The consumer is the lead horse for the economy, making up for factory slack that the doves are certain to cite at this week’s FOMC.
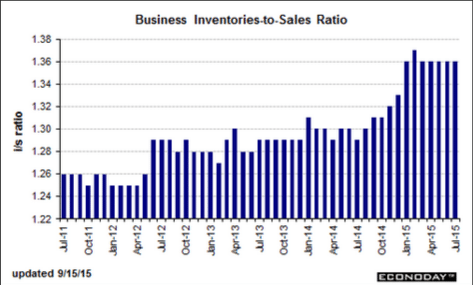
The inventory build was small, but weak sales kept inventory to sales ratio too high.
Note the July inventory build in autos led to the August cutback in production just reported:
Business Inventories

Highlights
The nation’s inventories remain slightly on the heavy side, up an as-expected 0.1 percent in July vs a 0.1 percent gain in sales that leaves the stock-to-sales ratio at 1.36, substantially higher than 1.29 a year ago.
Retail inventories rose 0.6 percent in July with the build, however, centered in vehicles which is positive given the strength, evident in this morning’s retail sales report, of strong consumer demand for vehicles. Excluding vehicles, retail inventories rose a manageable 0.2 percent. Building materials rose 0.6 percent which may be a problem given weakness for this component in the August retail sales report. The stock-to-sales ratio for retail is unchanged at 1.46.
I don’t see this as good news:
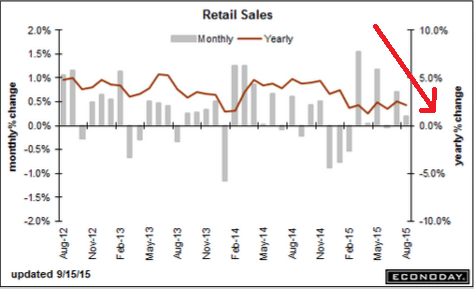
Retail Sales
Highlights
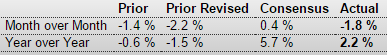
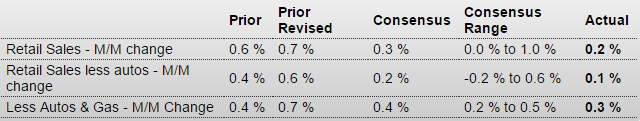
For a second report in a row, upward revisions highlight solid growth in retail sales. Retail sales rose 0.2 percent in August with ex-auto at plus 0.1 percent and ex-auto ex-gas at plus 0.3 percent. These are all 1 tenth below consensus. July, however, shows broad upward revisions with total sales at a very strong plus 0.7 percent vs an initial plus 0.6 percent. Ex-auto for July is revised upward by 2 tenths to plus 0.6 percent and ex-auto ex-gas revised upward by 3 tenths to plus 0.7 percent.
Turning first to strength in the August data, motor vehicles rose 0.7 percent on top of July’s 1.4 percent gain. These are very solid readings for a very important component that points squarely at a healthy and confident consumer. Restaurants, another component tied to discretionary health, rose a very strong 0.7 percent to extend a run of gains. On the weak side are gasoline stations where, due to lower gas prices, sales fell 1.8 percent. But this decline actually underscores one of the reasons behind the consumer’s health unlike, however, declines in building materials, down 1.8 percent, and furniture, down 0.9 percent. Yet both of these declines follow very strong gains in the prior month.
Taken together, July and August point to a very strong start to the third quarter for the consumer, a fact that plays into the hands of the hawks at this week’s FOMC. Still, the doves can argue that slowing in August could point to negative effects from China-based volatility.