GDP revision, Inventories, Corporate profits, Trump fundraiser

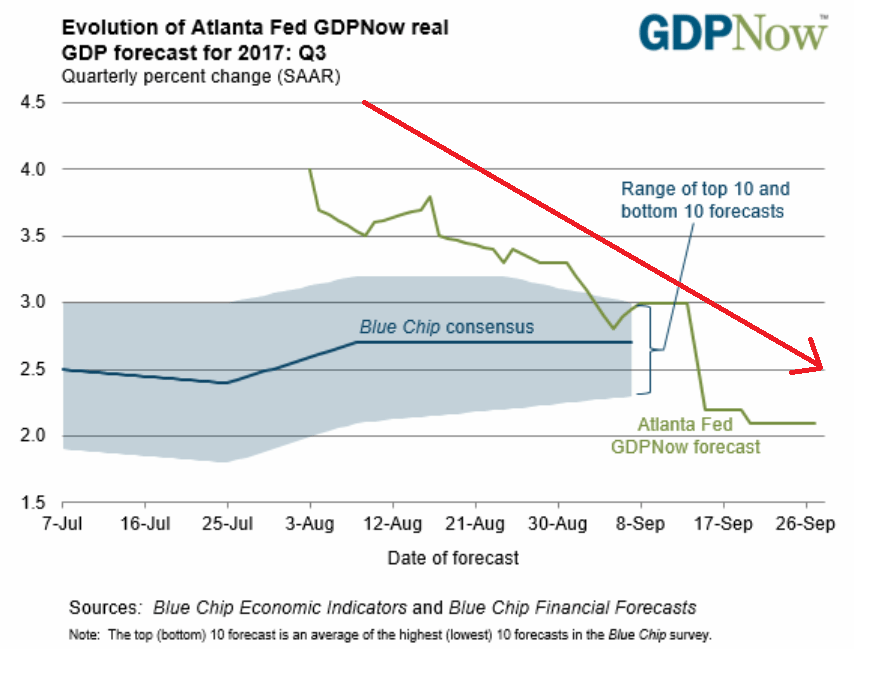
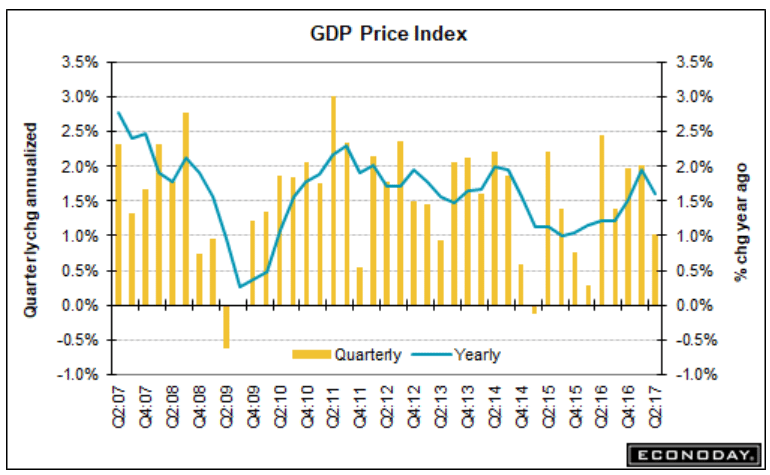
Revised higher due to inventory building- not good- and weak prices also tend to indicate low demand. And note how q3 gdp estimates have been coming down as well:

Highlights
Second-quarter GDP proved strong, at an as-expected 3.1 percent annualized rate for the third estimate driven by consumer spending at a 3.3 percent rate. Nonresidential fixed investment, at a 6.7 percent rate, was also a strong contributor and offsetting a 7.3 percent decline for residential investment. Government purchases, at minus 0.2 percent, were a slight drag on the quarter while both net exports and inventories were slight positives. GDP prices, like other inflation measures, were soft, up 1.0 percent overall and 1.1 percent for the core.

Today’s report confirms that the economy was showing solid momentum going into the third quarter where this morning’s preliminary data for August net exports and August inventories are very strong.

Highlights
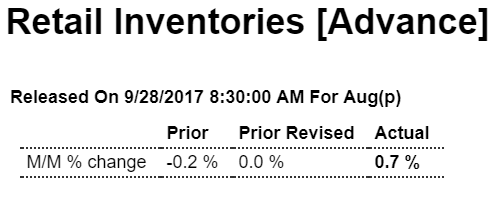
Retail inventories rose a sharp 0.7 percent in August and are led by a 1.2 percent build in vehicle inventories which, following the month’s weak vehicle sales, hints at overhang. Replacement demand following Hurricane Harvey, however, should soak up some of the inventory. Retail inventories excluding vehicles rose 0.4 percent. Overhang or not, retail’s build together with a 1.0 percent jump in wholesale inventories, where preliminary data were also released this morning, are immediate positives for third-quarter GDP.

Highlights
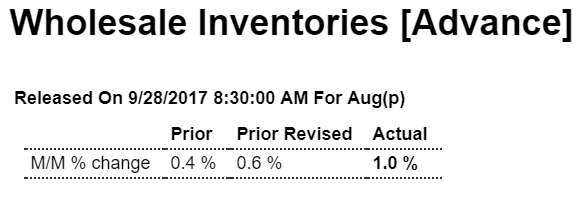
Wholesale inventories rose a very sharp 1.0 percent in August, split evenly between a 1.0 percent build for durables and a 1.2 percent build for nondurables. This along with a heavy 0.7 percent build for preliminary retail inventories, which were also released this morning, are positives for third-quarter GDP.

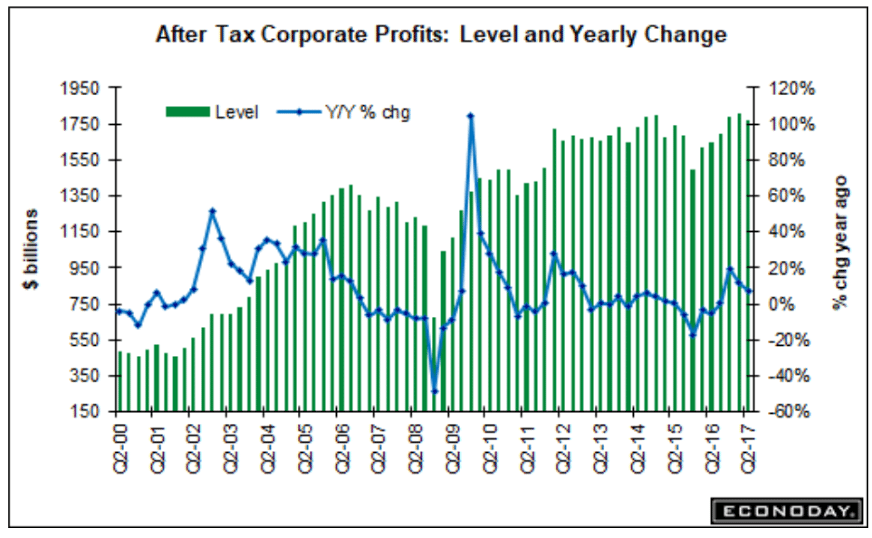
The chart shows corporate profits have been largely flat for over 5 years, with a dip when oil capex collapsed and a subsequent recovery only back to prior levels:


Looking like just another politician in that regard:

Trump’s Le Cirque fundraiser pulls in $5 million for GOP

New home sales, Pending home sales, Durable goods orders, Children

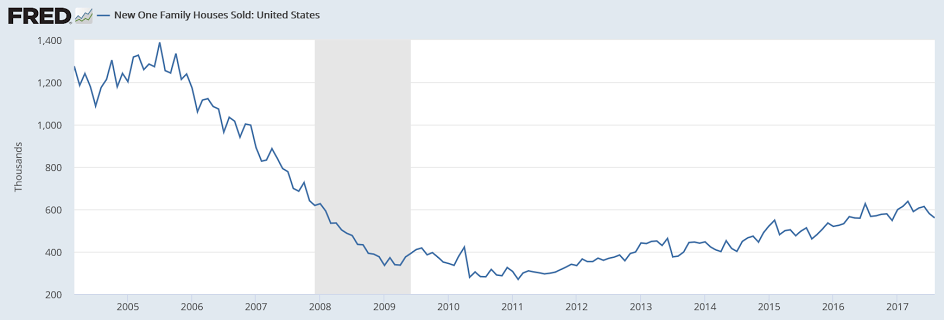
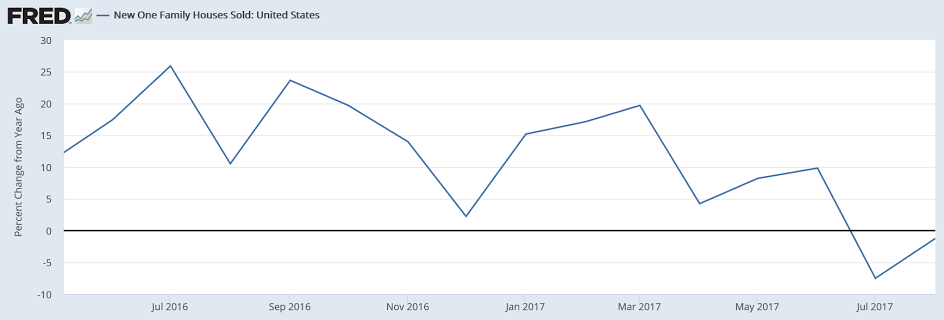
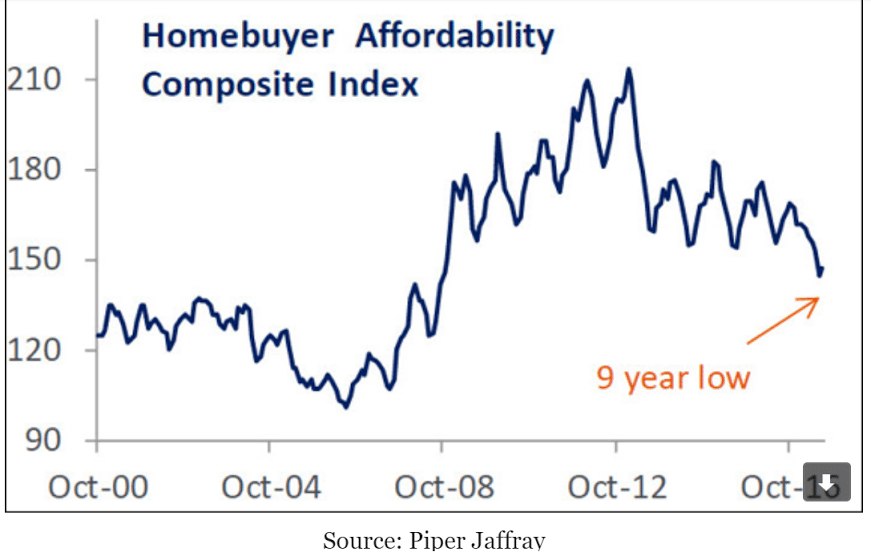
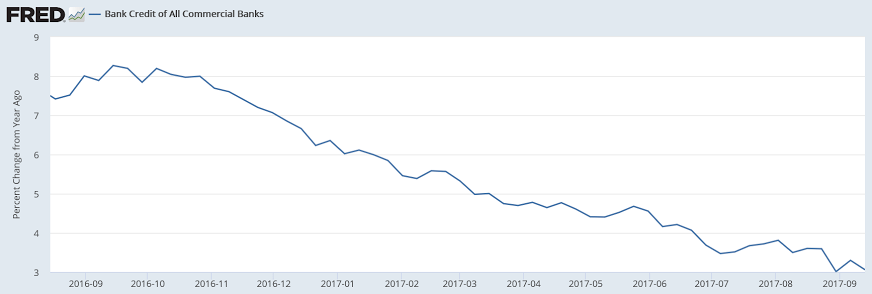
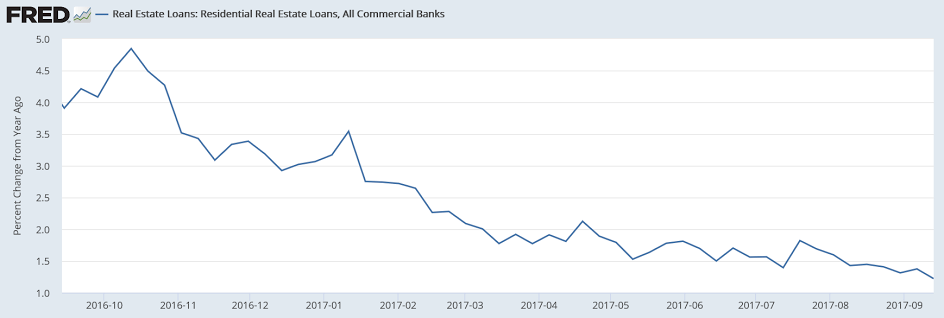
Heading south in line with the deceleration of mortgage lending:

Highlights

Weakness in the South pulled down new home sales in August as it did in last week’s existing home sales report. New home sales fell sharply in the month to a 560,000 annualized rate vs an upward revised rate of 580,000 in July and a downward revised 614,000 in June (revisions total a net minus 7,000).

Sales in the South, which is by far the largest region for housing, fell 4.7 percent in the month to a 307,000 rate for a year-on-year decline of 9.2 percent. But importantly, sales in the West and Northeast were also lower, down 2.6 and 2.7 percent respectively, with sales in the Midwest unchanged.

September in fact was a weak month for housing demand, evident in this report’s median price which fell a very sharp 6.2 percent to $300,200. Year-on-year, the median is up only 0.4 percent which, in another negative, is still ahead of sales where the yearly rate is minus 1.2 percent.

Builders, despite late month disruptions in the South, moved houses into the market, up 12,000 to 284,000 for a striking 17.8 percent yearly gain that hints at a glut. But supply had been so thin that the balance is now at a traditional level, at 6.1 months vs 5.7 and 5.3 months in the prior two months and 5.1 months a year ago.

Hurricane effects are likely in the next report for September with the South to continue to suffer. But today’s data do mark a shift, one of softening sales nationally, which is a short-term weakness, and a rebalancing in supply which is long-term strength. Yet for the 2017 economy, the housing sector looks to be ending the year in weakness, some of it hurricane related.


This isn’t looking so good either:

Highlights

Existing home sales have been on the decline as signaled all along by the pending home sales index which is down a very steep 2.6 percent in the latest reading which is for August. Hurricane Harvey’s late August hit on Texas didn’t help pending sales in the South which fell 3.5 percent but pending sales show across-the-board weakness: Northeast down 4.4 percent, Midwest down 1.5 percent, and the West down 1.0 percent.

Pending sales nationwide are down a year-on-year 2.6 percent while final sales of existing homes are down 1.7 percent. The pending index has been on a tailspin this year, peaking at 112.3 in February and now down at 106.3 for a year-to-date decline of 5.3 percent. New home sales, along with sales of existing homes, have also been moving lower making for a housing sector that is visibly stumbling into year end. The cause? It’s not mortgage rates which are very low nor employment which is very strong. High asking prices, however, are one factor as is soft wage growth.

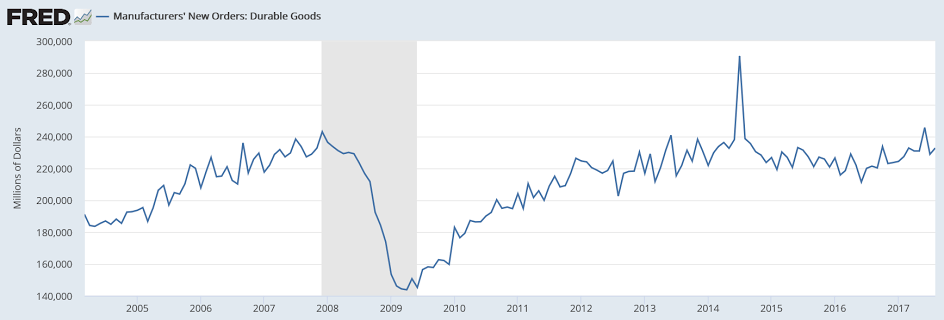
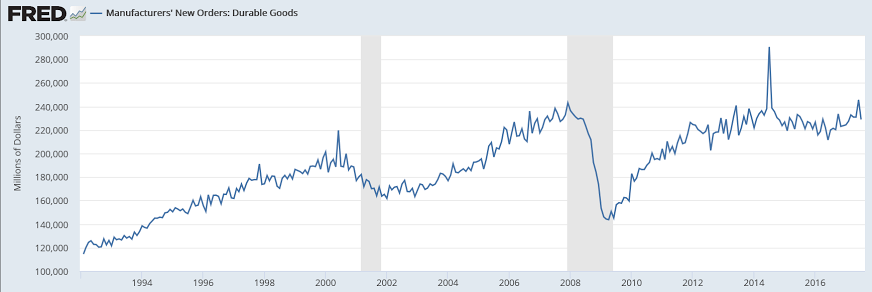
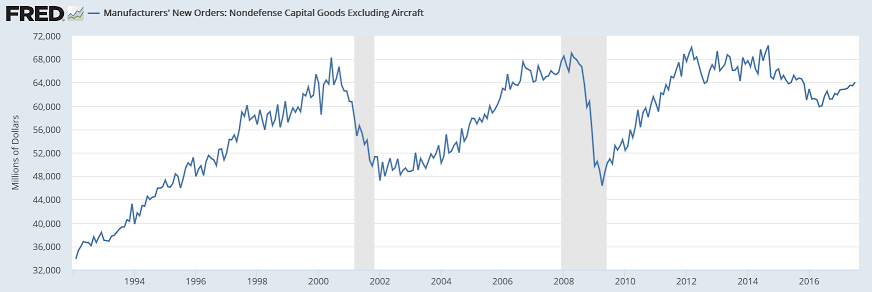
This type of thing went down hard after the collapse in oil capex in November 2014, And subsequently resumed growth a modest rates, as per the chart:

Highlights

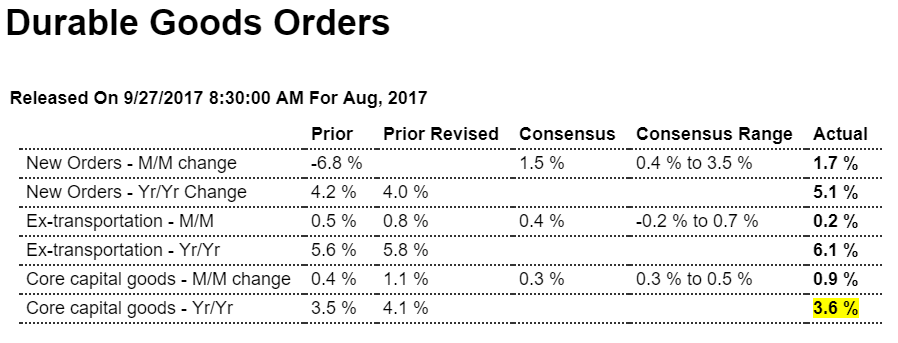
A second straight jump in capital goods leads what is a mostly very strong durable goods report where the August headline rose 1.7 percent. This is only slightly above expectations but not core capital goods (nondefense ex-aircraft) which jumped 0.9 percent vs Econoday’s consensus for a 0.3 percent gain. This together with a second straight jump in shipments of core capital goods, up 0.7 percent in August, point to business confidence and strengthening business investment and will significantly lift estimates for second-half nonresidential investment.

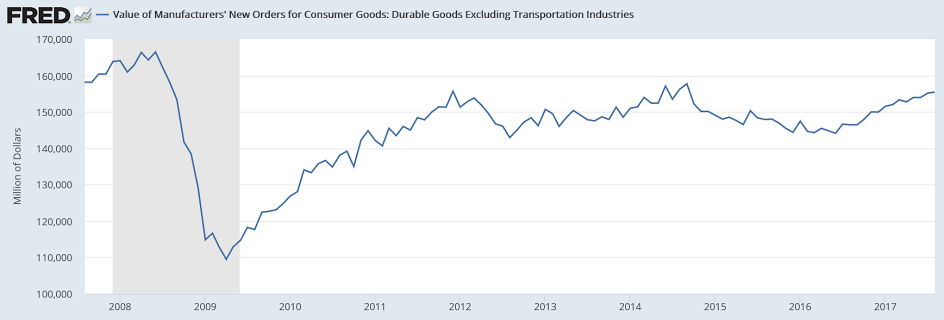
The headline gain reflects a monthly upswing in civilian aircraft orders, up 45 percent in August following a drop of 71 percent and a surge of 129 percent in the prior two months. Excluding transportation, the report’s strength fades, up only 0.2 percent which is half the expected gain. Weakness here is in defense capital goods which fell 9.4 percent but following July’s 15.3 percent jump. Other declines include fabricated metals (down 0.4 percent), computers (down 2.3 percent), and electrical equipment (down 0.1 percent).

But there’s more good news than bad news including motor vehicles which had been weakening but now show a 1.5 percent August gain for orders and a 1.9 percent rise in shipments. Communications equipment also jumped with orders up 4.0 percent. Other readings include a moderate 0.3 percent rise for both total shipments and inventories that keeps the inventory-to-shipments ratio steady at a lean and constructive 1.69. Unfilled orders did not show improvement, unchanged following July’s 0.3 percent decline.

The factory sector did not show any initial effects from Hurricane Harvey’s late August hit and, assuming Hurricane Irma’s effects proves as slight in September, appears poised for solid year-end acceleration centered in capital goods. The one missing piece in the factory sector, however, is manufacturing production as measured by the Federal Reserve which has remained stubbornly weak including a 0.3 percent fall in the report for August. Note that revisions in today’s report are minor compared to the factory orders report when capital goods data from the July advance durables report were sharply upgraded.


A bit of a fallacy of composition here? (who’s supposed to care for the retired?)
We’ve set up our institutional structure to eliminate our species?
;)

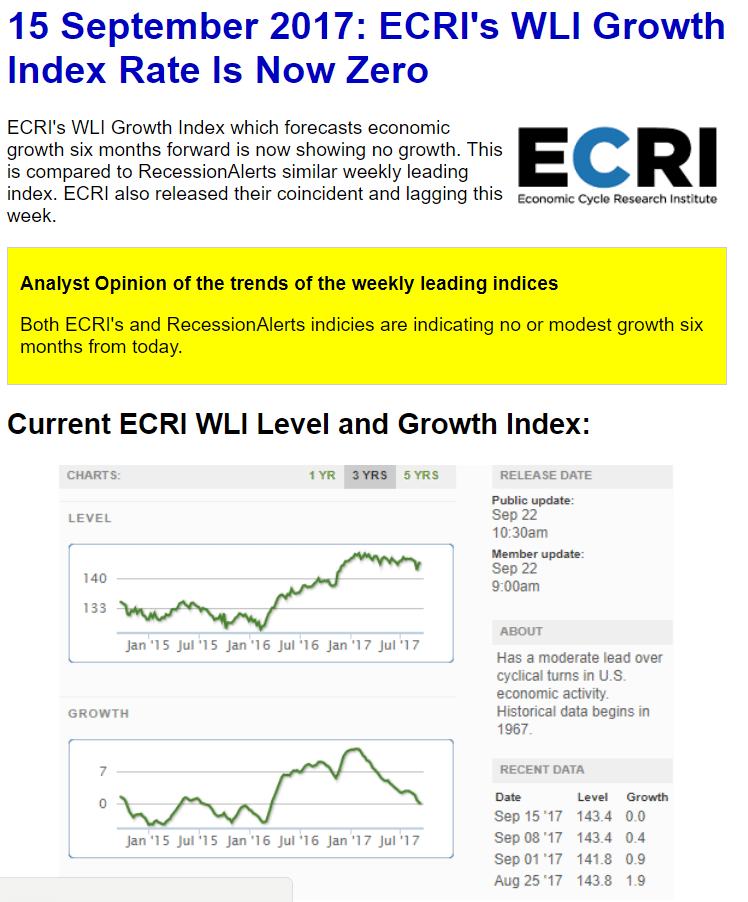
Vehicle sales, Homebuyer affordability, Bank loans, FX reserves, Growth index, Rail traffic

Looking like an uptick here, some of it weather related?

From WardsAuto: Forecast: SAAR Expected to Surpass 17 Million in September

A WardsAuto forecast calls for U.S. light-vehicle sales to reach a 17.5 million-unit seasonally adjusted annual rate in September, following August’s 16.0 million SAAR and ending a 6-month streak of sub-17 million figures. In same-month 2016, the SAAR reached 17.6 million.

Preliminary assumptions pointed to October, rather than September, as the turning point for the market, as consumers replace vehicles lost due to natural disasters and automakers push sales to clear out excess model-year ’17 stock. However, the winds have already begun to turn, and September sales will be significantly higher than originally expected.
emphasis added

Sales have been below 17 million SAAR for six consecutive months.
Read more at http://www.calculatedriskblog.com/#Xo888Paz0wrbTfbl.99


No recovery here:


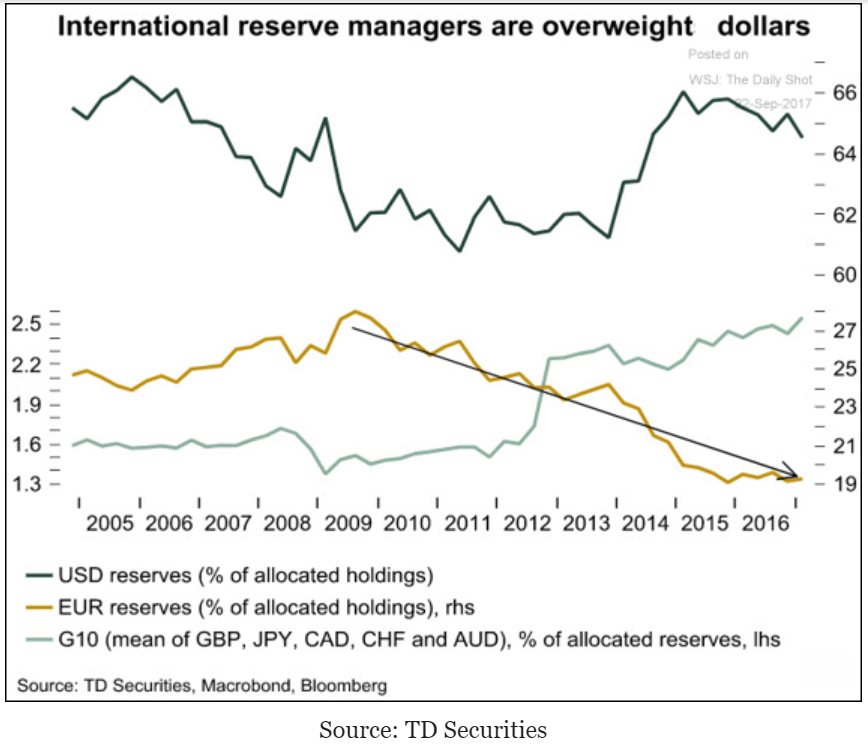
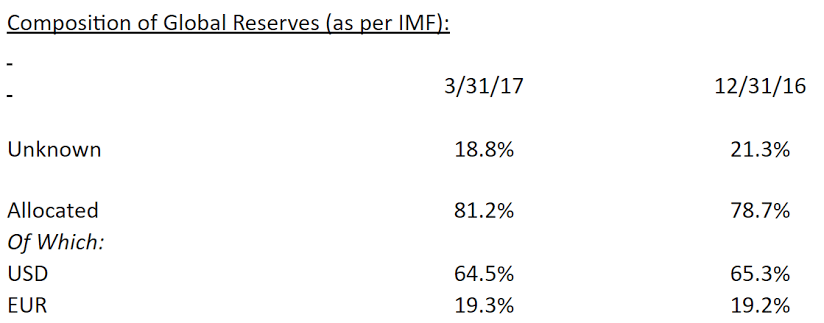
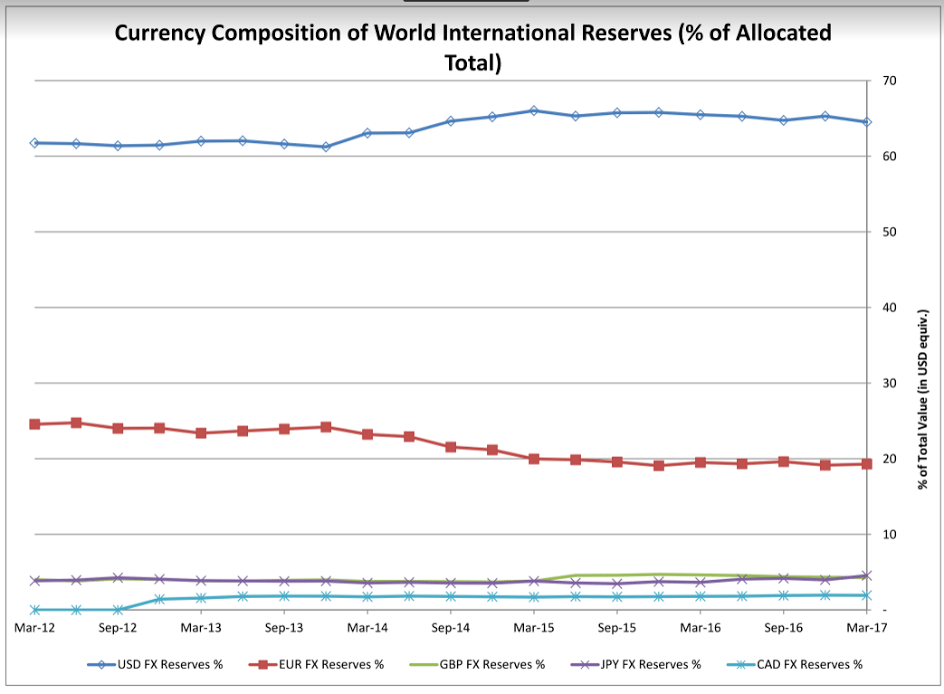
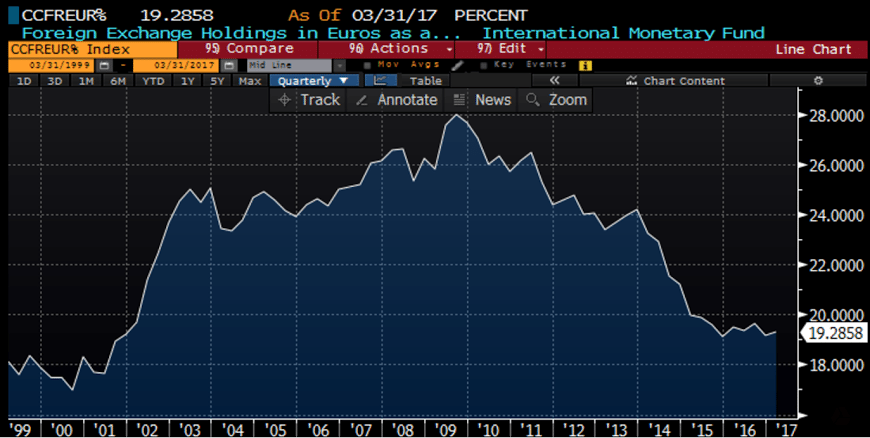
Another chart that may be indicating the euro liquidations have run their course:


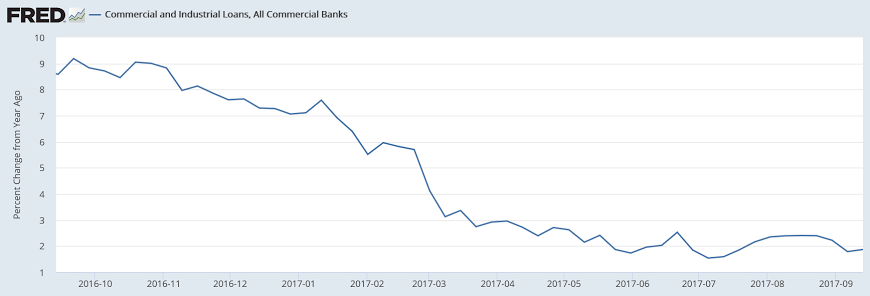
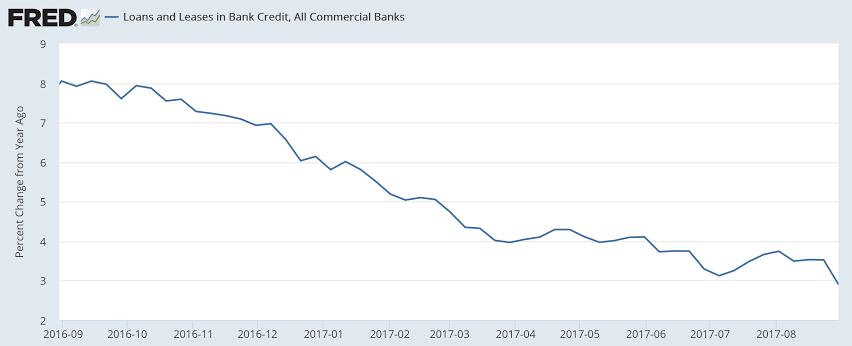
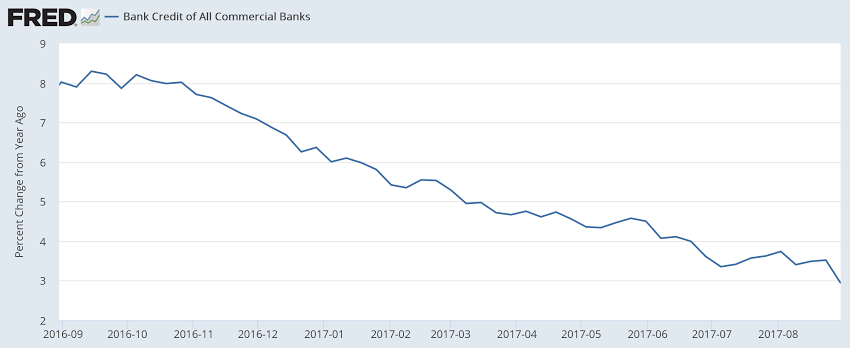
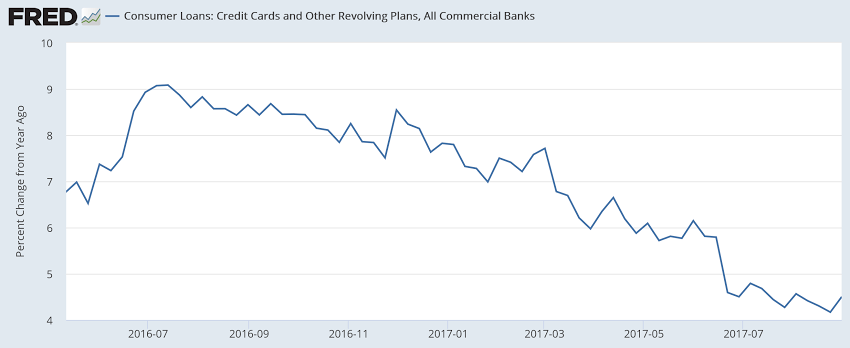
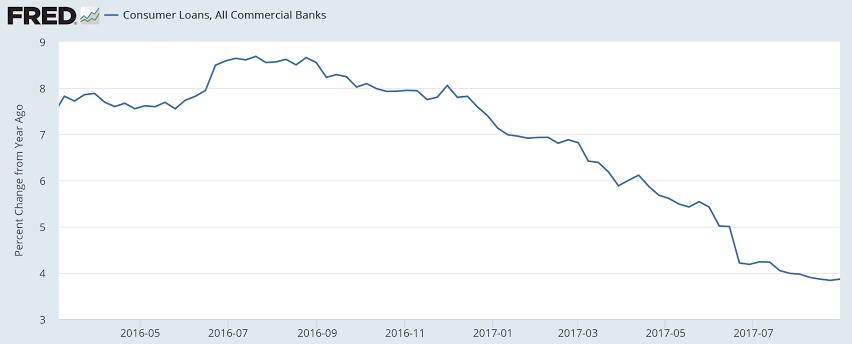
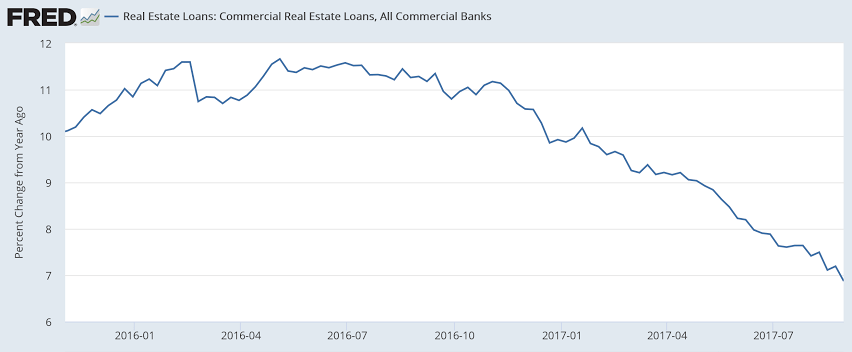
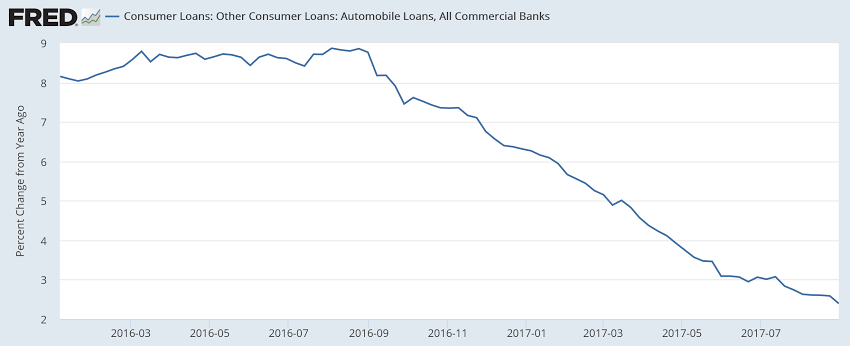
Note that the slowdown started in November, about the same time the loan demand deceleration increased:

Chicago Fed, Small business optimism, NY Fed comments

Note the shift:

From NY Fed’s Dudley. I added a chart after several of his statements so you can see
what he sees as support for his statements. Looks a lot to me like he’s trying to manage expectations?

“The fundamentals supporting continued expansion are generally quite favorable. Low unemployment, sturdy job gains,

and rising wages—even at a pace below previous expansions—

are lifting personal income.

Household wealth has been boosted by rising home and equity prices, and household debt has been growing relatively slowly, contributing to a healthy household balance sheet. Thus, consumer spending should continue to advance in coming quarters.

(the will likely be revised lower as the latest retail sales reports was lower than expected and revised the prior month lower)

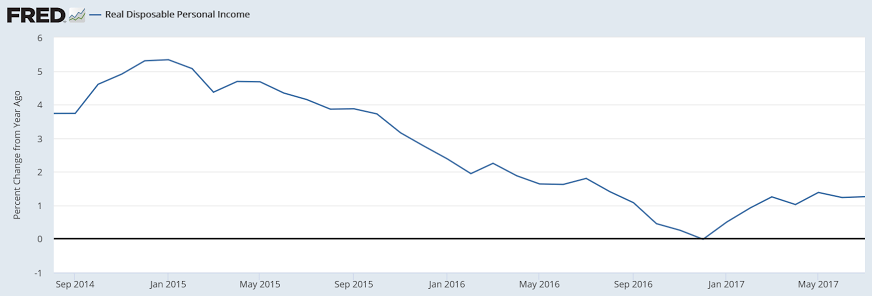
Also, this doesn’t show any signs of turning around and contributing more to consumer spending?

Business fixed investment outlays are also likely to continue to rise.

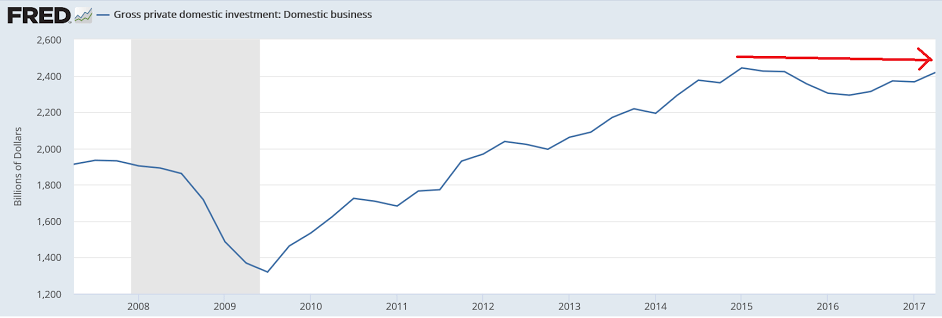
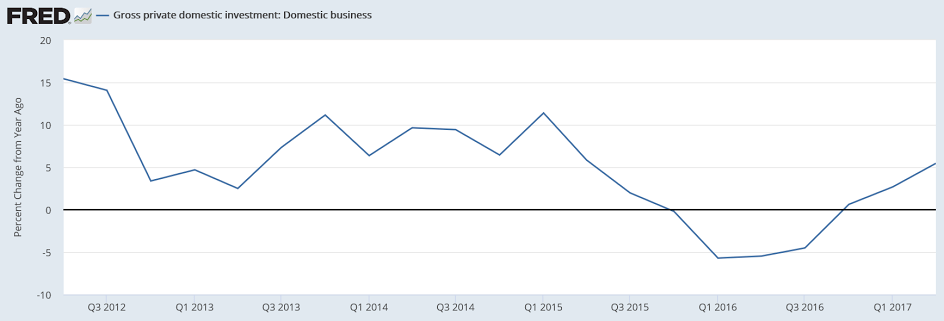
Why? Looks more like it’s flattened out after a dip from the oil capex collapse, especially with the recent softness in consumer spending and personal income:

With the supply of labor tightening, there are greater incentives for businesses to invest in labor-saving technologies.

(There’s been just as large a benefit from investing in labor-saving technologies over the last several years, as real wages aren’t
materially higher than they were.)

Investment spending should also benefit from a better international outlook and improvement in U.S. trade competitiveness caused by the dollar’s recent weakness.

He thinks exports to emerging market nations will pick up?
Again, looks like there’s been a flattening after the collapse of oil capex:

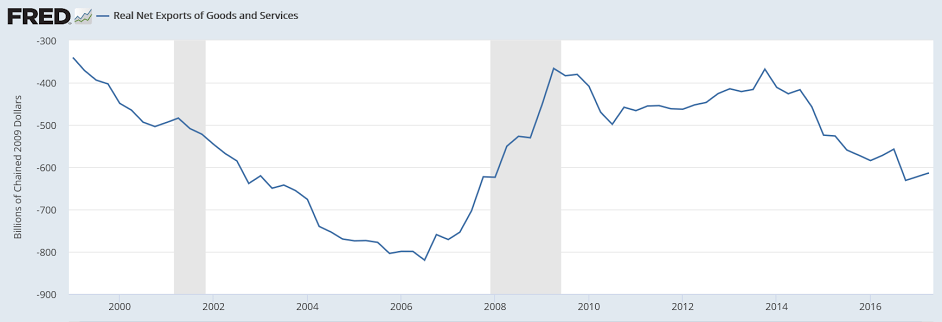
The softer dollar and solid growth abroad also suggest that the trade sector will no longer be a significant drag on economic growth.

Except we have to first get past the J curve effect and the recent higher prices for imported oil before the current trend reverses:

With a firmer import price trend and the fading of effects from a number of temporary, idiosyncratic factors, I expect inflation will rise and stabilize around the FOMC’s 2 percent objective over the medium term.

Agreed that the higher oil prices and other weaker dollar effects could add a few tenths to headline cpi, but core inflation might stay low for longer.

In response, the Federal Reserve will likely continue to remove monetary policy accommodation gradually.

No mention of the strong deceleration of bank loan growth when the only channel from rates to growth is credit…

Retail sales, Industrial production, Euro area trade, Rail week

The story is the weakness is weather related, as was the cpi increase, though not the downward revision for the prior month. (I suppose getting control of the weather would be a useful policy tool for the Fed to hit its targets?)

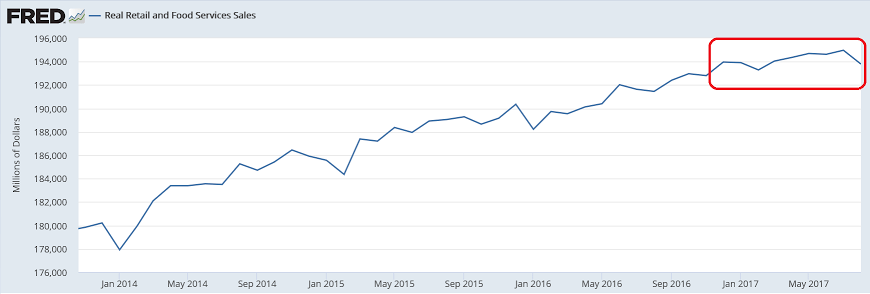
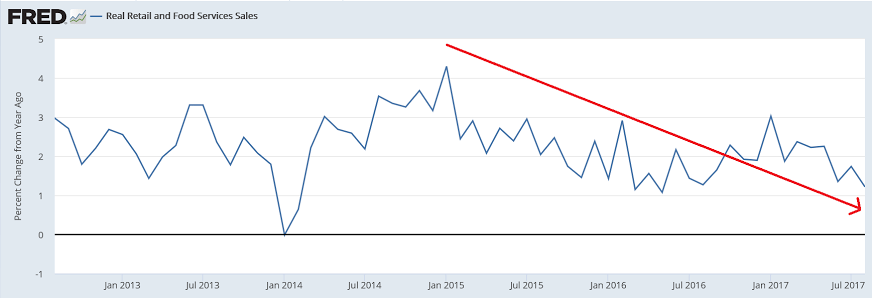
The economy is to some degree path dependent, which in this case means that a slowdown in sales = a slowdown in income which can reduce future sales even after the weather issues clear up, especially given the declining growth rate real disposable personal income, the drop in the growth of borrowing, and the consumer dipping into savings to sustain spending.

In fact, with this month’s report and the downward revisions, as per the chart it looks like consumer spending has gone flat, and is now more in line with the deceleration of the credit aggregates previously discussed:

US retail sales fell 0.2% in Aug, vs 0.1% increase expected

“The Commerce Department said while it could not isolate the impact of Harvey on retail sales, it had received indications from companies that the hurricane had “both positive and negative effects on their sales data while others indicated they were not impacted at all.”

from Morgan Stanley:

  • Eight of thirteen major categories saw increases in retail sales in August, while five categories saw substantial weakness that dragged down the overall sales figures. Weakness in retail sales in August was seen in motor vehicles and parts (-1.6%), electronics & appliance stores (-0.7%), building materials, garden equipment & supply dealers (-0.5%), clothing & accessory stores (-1.0%), and nonstore retailers (-1.1%). Positive results in the report were seen in miscellaneous store retailers (+1.4%), general merchandise stores (+0.2%), sporting goods, hobby, book & music stores up 0.1%, health & personal care stores (+0.1%), food & beverage stores (+0.3%), gasoline stations (+2.5%), and food services & drinking places (+0.3%).
  • While auto sales and sales at home improvement stores were weaker in August, we expect to see some bounceback in September. Early industry figures for September point to a large bounceback in auto sales, even before hurricane-related tailwinds kick in. We also expect that sales at home improvement stores will rebound in September as post-hurricane rebuilding efforts begin.
  • Core retail sales came in well below assumptions built into our 3Q GDP tracking, and combined with downward revisions to prior months. These factors led to a significant downward revision to our 3Q GDP tracking estimate to 2.4% from 2.8% previously, with 3Q consumption now tracking at 2.0% vs 2.8% previously.
  • Moreover, weakness in the home improvements category led to a downward revision in our tracking for 3Q residential investment to -3.6% from -2.8% previously.

  • Down due to weather issues, but otherwise probably chugging along at a modest pace:

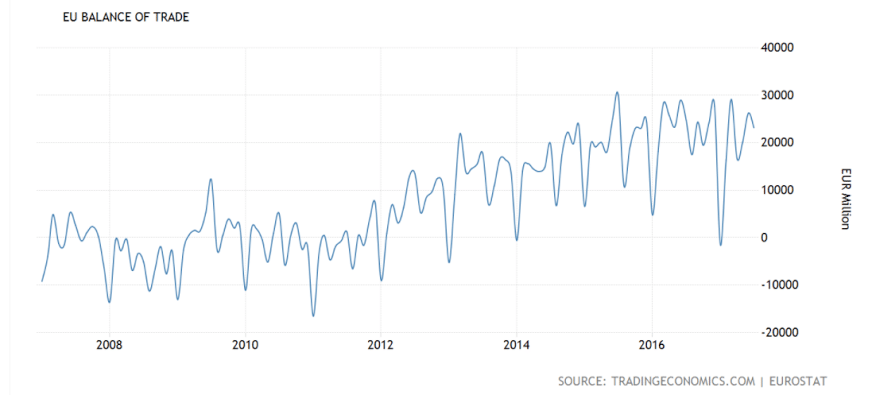
    Still a large and persistent trade surplus, which is fundamentally euro friendly:

    The Euro Area trade surplus narrowed to EUR 23.2 billion in July 2017 from EUR 24.8 billion in the corresponding month of the previous year. Still, the reading came in above market expectations of EUR 21.4 billion.

    Exports of goods to the rest of the world increased by 6.1 percent to EUR 177.7 billion from EUR 167.6 billion in July 2016, while imports advanced at a faster 8.2 percent to EUR 154.6 billion from EUR 142.8 billion. Intra-euro area trade rose to EUR 145.6 billion, up by 5.6 percent compared with July 2016.

    In the the seven months to July, the trade surplus narrowed to EUR 130.2 billion from EUR 154.1 billion in the same period of 2016.

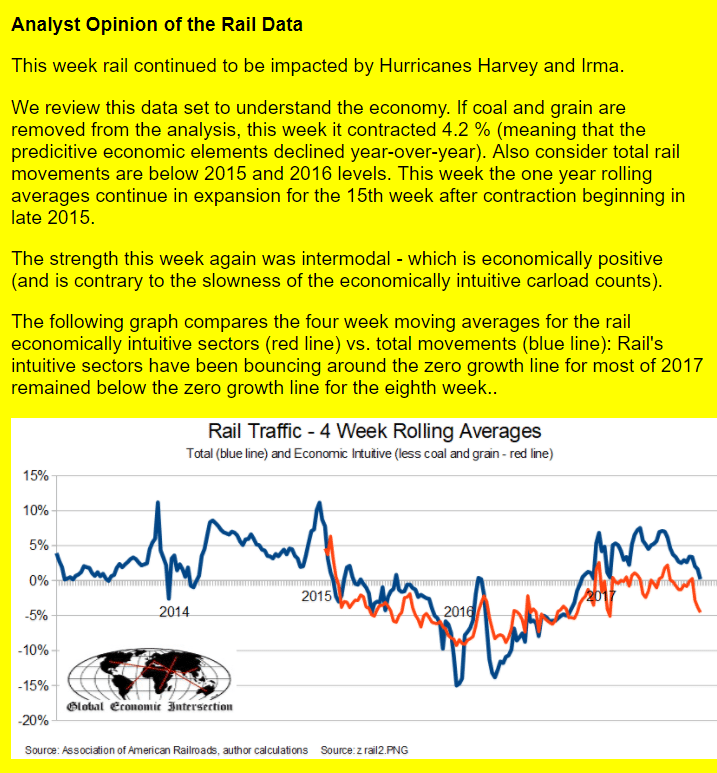
    Rail Week Ending 09 September 2017: Intuitive Sector Decline Continues

    Week 36 of 2017 shows same week total rail traffic (from same week one year ago) improvedaccording to the Association of American Railroads (AAR) traffic data. The economically intuitive sectors are in contraction.

    Euro reserves, Small business survey, Municipal revenues


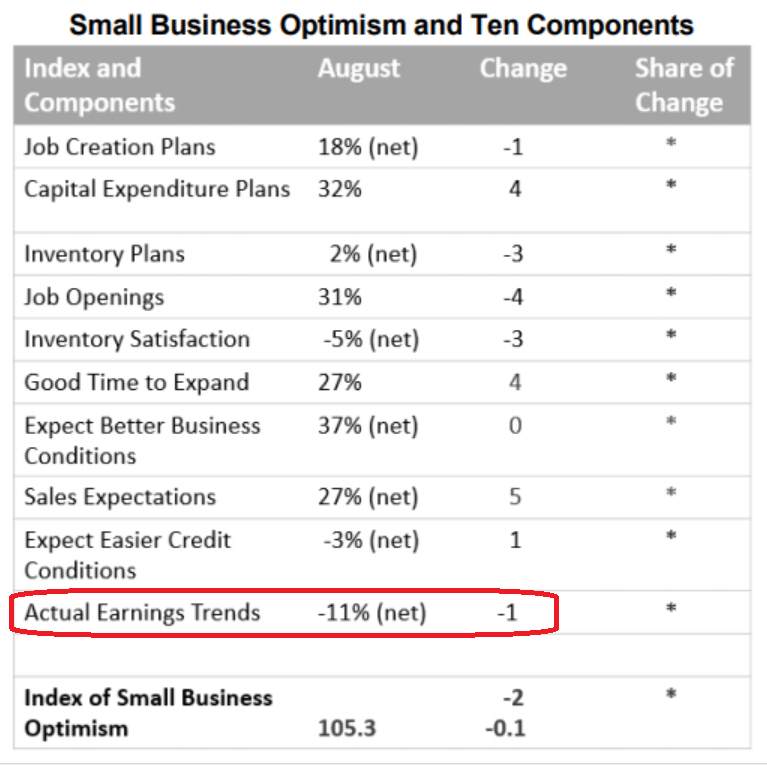
    Trumped up expectations continue even as earnings deteriorate:

    As U.S. Economy Improves, Cities May Be Headed for Another Downturn

    Cities may be facing a new period of economic stress — even as the national economy continues to improve.

    According to a National League of Cities (NLC) report released on Tuesday, municipal finance officers are expecting minimal growth this year — less than 1 percent — after dealing with slower revenue growth last year. If that happens, NLC Research Director Christiana McFarland says it would “be the first time we are seeing two consecutive years of slowing growth since the start of the recession.”

    The report also reveals a decline in public officials’ confidence in their cities’ finances. This year, 69 percent said they are better able to meet the financial needs of their communities — down from at least 80 percent in each of the last three years.

    This all may be “the start of fiscal contraction” for municipalities, the report concludes, and city revenues may never fully recover from the recession before the next economic downturn hits.

    The wary outlook this year comes after a disappointing 2016. Last year, city revenues were expected to finally rebound from the Great Recession. But the reality fell short: City revenues (accounting for inflation) reached just under 98 percent of what they were in 2006 — the year before the recession started. While property tax revenue increased by a healthy 4.3 percent, sales and income tax revenue growth were slower than normal.

    Now, city officials are expecting much lower rates of growth in property tax revenue — 1.6 percent for fiscal 2017 — and budgeted for an outright decline in sales and income tax revenues.

    JOLTS, Redbook sales, Rig count, Credit check, NK comment, PMC jersey

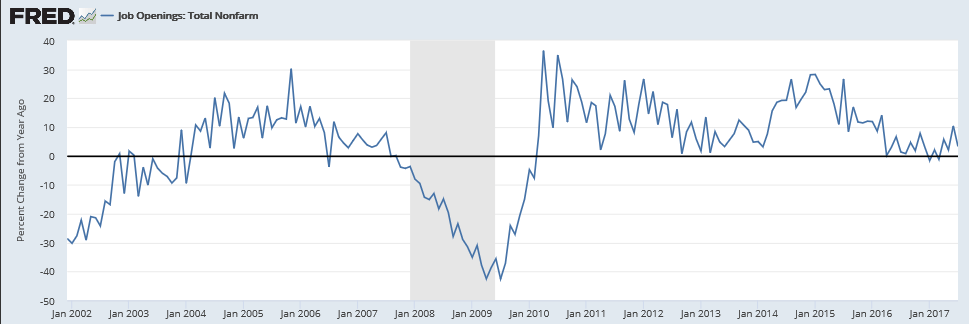
    Openings higher than hires tells me employers don’t want to pay up, which is also suggested by low wage growth:

    Highlights

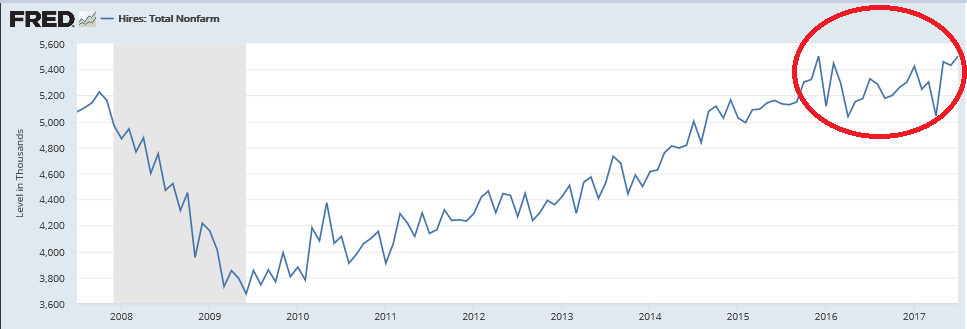
    In the latest indications of strong, tight conditions in the labor market, job openings rose to a higher-than-expected 6.170 million in July for a 0.9 percent increase from June. Hirings also rose, up 1.3 percent to 5.501 million which, however, is 669,000 below openings. Openings have been far ahead of hirings for the past several years to indicate that employers are having a hard time filling positions.

    Other indications are steady to higher with the separation rate at 3.6 percent, the quits rate at 2.2 percent, and the layoff rate at 1.2 percent. The only employment data that aren’t strong, in data however that are not part of the JOLTS report, are wages, yet job openings in this report are certain to catch the eye of the more hawkish FOMC policy makers who continue to warn that wage-push inflation is inevitable.

    The growth rate of new openings is at stall speed:


    The new hiring has stalled:


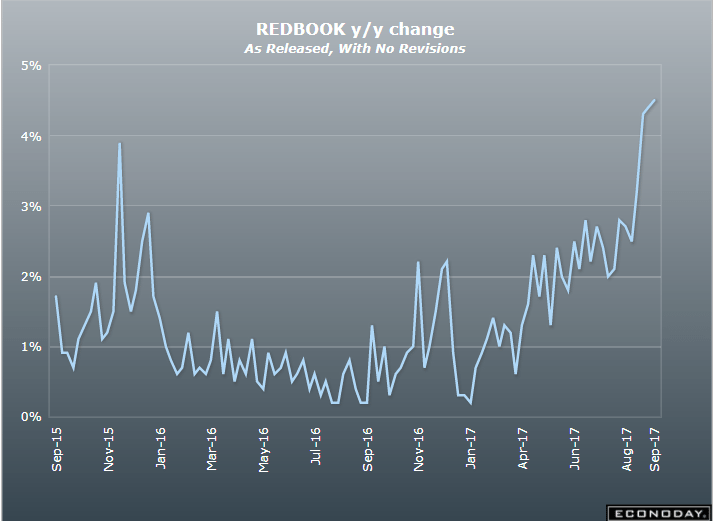
    Moving higher again, as previously discussed:


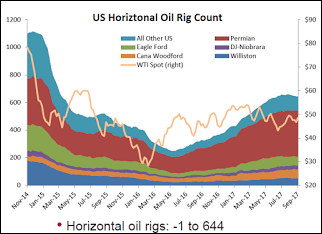
    Looks like the increases in new drilling are behind us, and new wells are costing a lot less than before the shale bust, so it’s all adding that much less to GDP:


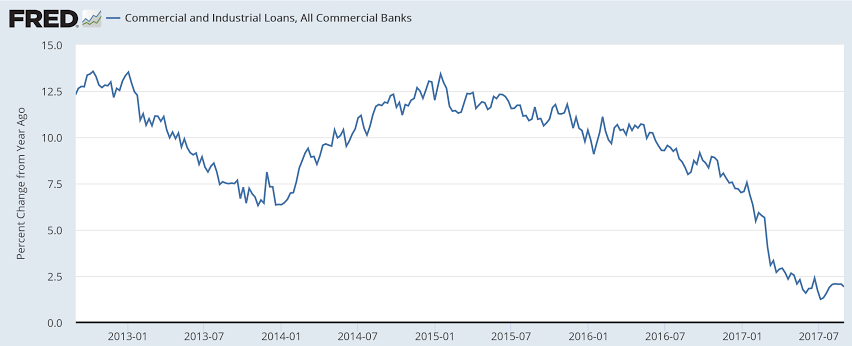
    Not to kick a dead horse, but gdp growth is getting less support from credit growth than it did last year. And that reduction appears to be over 2% of GDP. So far GDP has held up from consumers dipping into savings, which looks to me to be an unsustainable process:


    I’m thinking I’d tell North Korea that if they don’t abandon their nukes will give China a green light to annex them… ;)

    China urges North Korea to ‘take seriously’ bid to halt nuclear program

    Sept 12 (Reuters) — China’s U.N. Ambassador Liu Jieyi called on North Korea to “take seriously the expectations and will of the international community” to halt its nuclear and ballistic missile development, and called on all parties to remain “cool-headed” and not stoke tensions. Liu said relevant parties should resume negotiations “sooner rather than later.” To kick-start talks, China and Russia have proposed a dual suspension of North Korea’s nuclear and ballistic missile testing as well as U.S. and South Korean military exercises. U.S. Ambassador to the United Nations Nikki Haley has called the proposal insulting.

    Factory orders, Euro charts, Oil prices

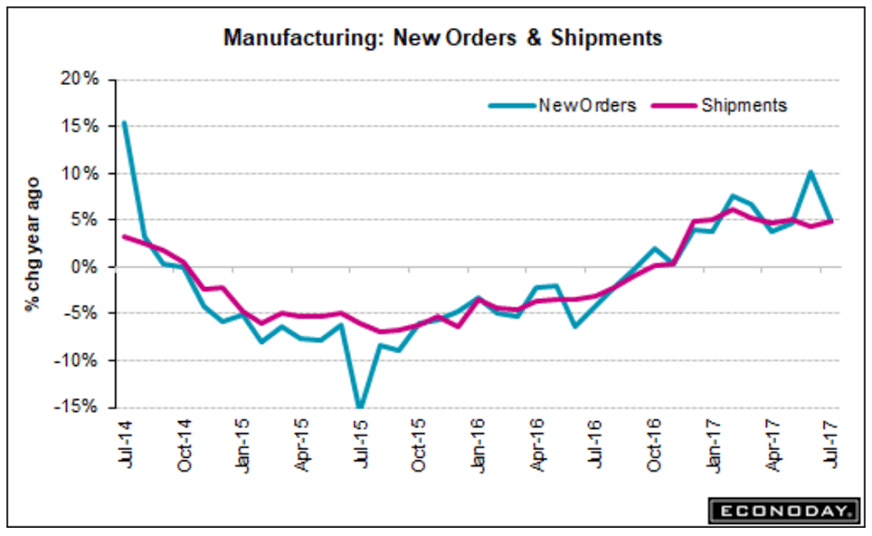
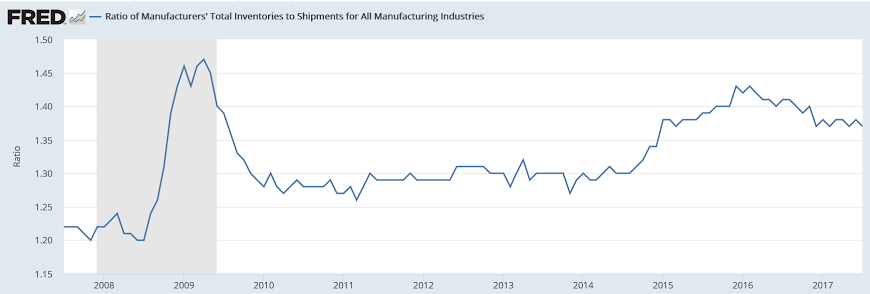
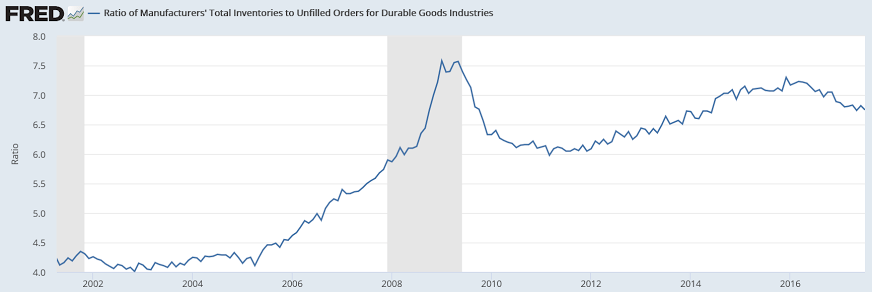
    Manufacturing continues to muddle through:

    Highlights

    There’s really only good news in the July factory orders report where the headline, at minus 3.3 percent, reflects a slowing in what were strong prior gains for aircraft orders. The best news is a 6 tenths upward revision to core capital goods orders (nondefense ex-air) to a 1.0 percent gain and a 2 tenths upward revision to core shipments, now at 1.2 percent. These numbers point to accelerating strength for third-quarter business investment.

    Total shipments rose a moderate 0.3 percent in the month with inventories up only 0.2 percent. This takes the inventory-to-shipments ratio to a more lean and positive 1.37 from 1.38. Unfilled orders are not a positive, falling 0.3 percent after however a giant 1.3 percent build in June.

    The split between the report’s two main components shows a 0.4 percent gain for nondurable goods — the new data in today’s report where strength is tied to petroleum and coal — and a 6.8 percent dip for durable orders which is unchanged from last week’s advance report for this component. The total ex-transportation gain is a strong 0.5 percent vs June’s 0.1 percent increase.

    The core strength was posted despite weakness at the heart of capital goods and that’s machinery where orders fell 0.9 percent though shipments of machinery did rise 0.2 percent. Today’s factory orders report closes the book, one that includes a 0.1 percent decline in the manufacturing component of the industrial production report, on what was a mixed month for the factory sector.


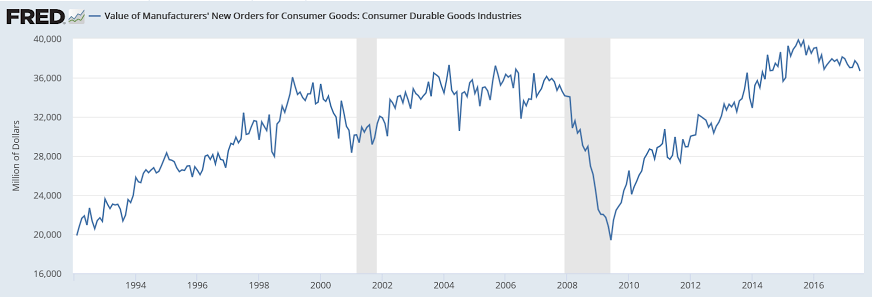
    Consumer demand not looking so strong:


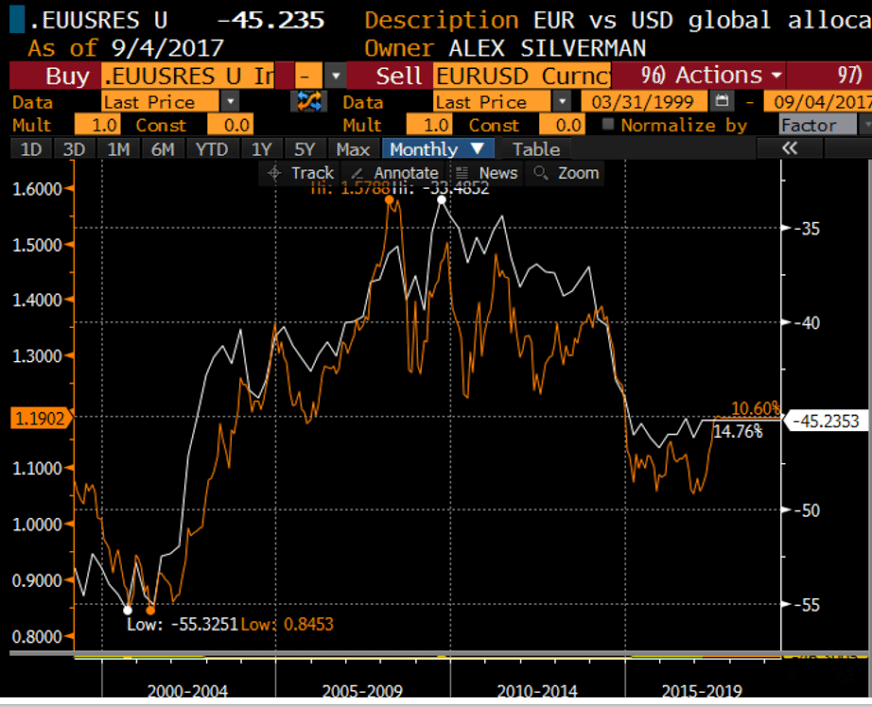
    Charts indicating underweight euro holdings:


    Seems Saudis are hiking prices, perhaps due to weaker $:

    Aramco Raises All October Oil Pricing to Asia, Mediterranean

    By Anthony DiPaola, Sharon Cho and Serene Cheong

    Sept 4 (Bloomberg) —

  • State-run Saudi Aramco sets official selling price of Arab Light crude for Oct. sales to Asia at 30c/bbl premium to Oman-Dubai benchmark, according to emailed statement
  • Grade’s OSP differential increased by 55c/bbl for Oct. vs Sept.
  • That’s a larger increase than +35c m/m forecast in Bloomberg survey
  • READ: Saudis May Raise Oct. Arab Light Crude Price to Asia: Survey
  • Arab Super Light official price for Oct. set at $4/bbl premium to benchmark prices, +70c m/m
  • Arab Extra Light at $1.40/bbl premium to benchmark prices, +80c m/m
  • Arab Medium official price at 55c/bbl discount to benchmark prices, +35c m/m
  • Arab Heavy official price at $1.65/bbl discount to benchmark prices, +30c m/m
  • Aramco raises most pricing for buyers in U.S., Medium crude unchanged
  • Extra Light at $3.30/bbl premium to Argus Sour Crude Index benchmark, +50c/bbl m/m
  • Light at $1.30/bbl premium, +10c m/m
  • Heavy at $1.30/bbl discount to benchmark, +20c m/m
  • Aramco raises Extra Light pricing to NW Europe by 65c/bbl m/m to discount of 45c/bbl to ICE Brent crude benchmark; co. cuts rest of grades
  • Light to $2.15/bbl discount, -10c m/m
  • Medium to $3.10/bbl discount, -10c m/m
  • Heavy to $4.40/bbl discount, -30c m/m
  • Aramco raises all grades to Mediterranean region
  • Extra Light to 40c/bbl discount to ICE Brent, +95c m/m
  • Light to $2.10/bbl discount, +30c m/m
  • Medium to $3.20/bbl discount, +20c m/m
  • Heavy to $4.15/bbl discount, +5c m/m
  • Misc. charts, Cryptocoin hedge funds, Bank loans

    Interesting charts:


    Over 50 hedge funds attracting investors who want to go long bitcoin and the rest. Helps explain why the prices are going up even as there is no intrinsic or conversion value whatsoever, which, presuming that to be the case, also means that at some point the mania ends and the price goes all the way back to 0:

    Hedge funds are cashing in on bitcoin mania — there are now 50 dedicated to cryptocurrencies


    Digital currencies, such as Bitcoin, are powered by distributed ledger technology and are not controlled by a centralized authority. The market for such currencies has exploded with over 800 coins on the market with a combined marketcap of $166 billion.

    Autonomous NEXT, a fintech analytics firm, released a list of 55 cryptocurrency hedge funds on Tuesday, illustrating the mounting interest in the space.

    Protecting their investors…
    ;)

    Bitcoin price drops $200 after new ruling from Chinese regulators

    Another interesting chart:


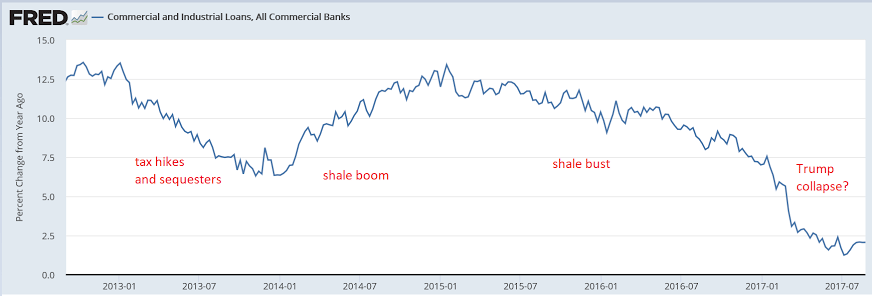
    Still no pick up in site:

    Employment, Construction spending, Auto sales, Tax plan and debt ceiling

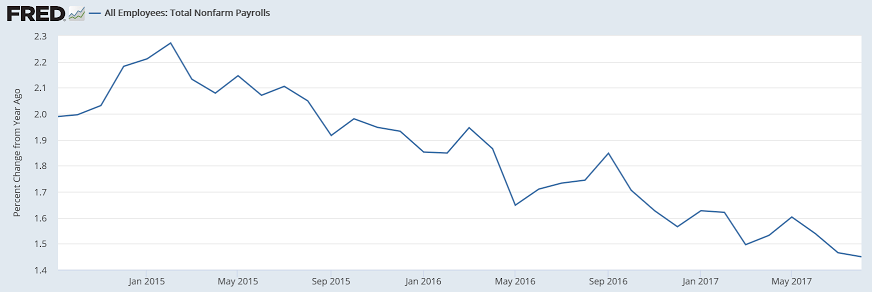
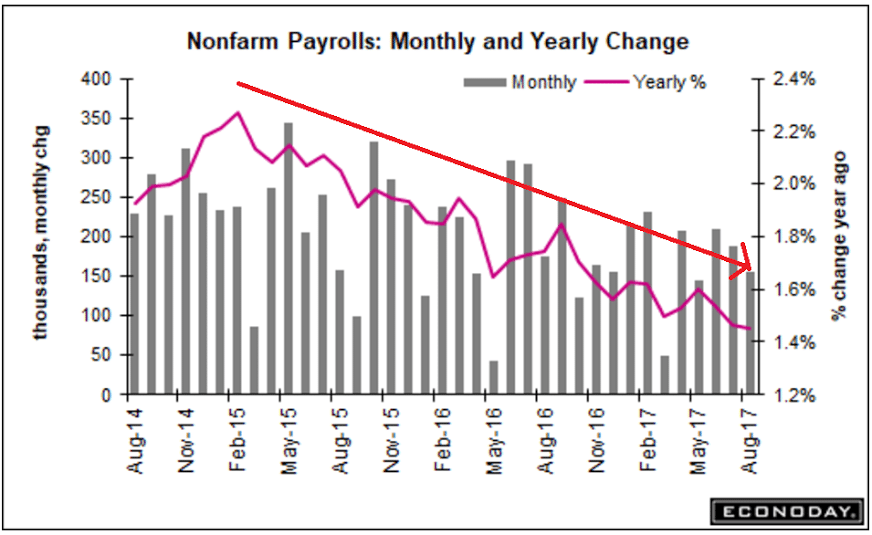
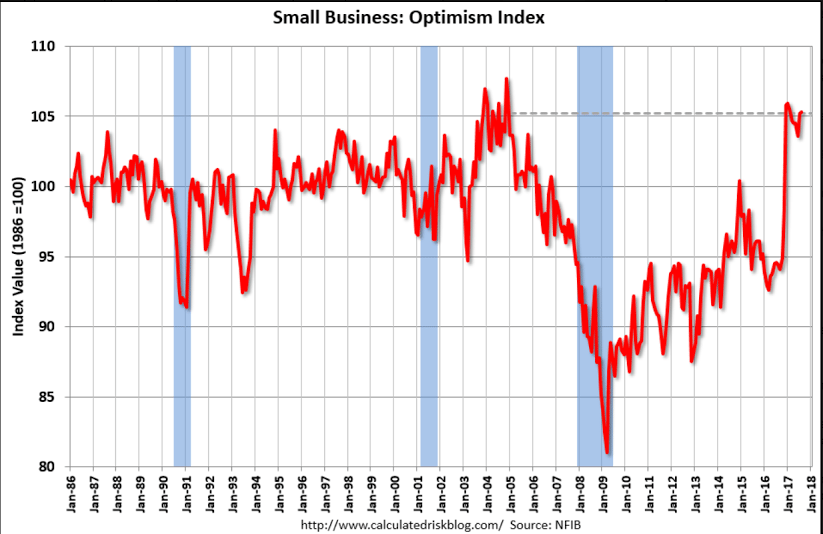
    Weaker than expected, downward revisions, depressed earnings growth and participation rate. And note how the year over year growth has been going down now in, for all practical purposes a straight line, for over 2 1/2 years, when the shale boom ended and oil capex collapsed:

    Highlights

    August payroll growth, though solid, missed expectations while wage data clearly disappointed. Nonfarm payrolls rose 156,000 in the month vs Econoday’s consensus for 180,000. Revisions are negative with July revised 20,000 lower to 189,000 and June down 21,000 to 210,000. The unemployment rate reflects the softness, rising 1 tenth to 4.4 percent.

    Average hourly earnings barely rose at all, up a monthly 0.1 percent with the year-on-year rate at 2.5 percent. These are both 1 tenth below expectations.

    But a major positive in the report, and one correctly signaled by regional factory reports, is a 36,000 surge in manufacturing payrolls that includes a 10,000 upward revision to July to a 26,000 increase and a 9,000 upgrade to June to a gain of 21,000. Construction payrolls are also solid, up 28,000 in August following a 3,000 decline in July. An offset to manufacturing and construction is weakness in retail which, after six straight monthly declines, added only 1,000 jobs despite Amazon’s plans to hire 50,000.

    And government payroll growth is below expectations, falling 9,000 for the third decline in four months. Excluding government payrolls, private payrolls in August came in at 165,000 which is 9,000 above the headline total but still 15,000 short of expectations.

    Weekly hours are also soft, down 1 tenth to 34.4 with manufacturing, in contrast to the hiring, down 2 tenths to 40.7 hours which points to a second straight monthly disappointment for the manufacturing component of the industrial production report.

    But it’s the wage data that, for policy makers, may be the greatest disappointment and will provide the doves, who are concerned about the economy’s lack of inflation, serious arguments to delay the beginning of balance-sheet unwinding at this month’s FOMC.

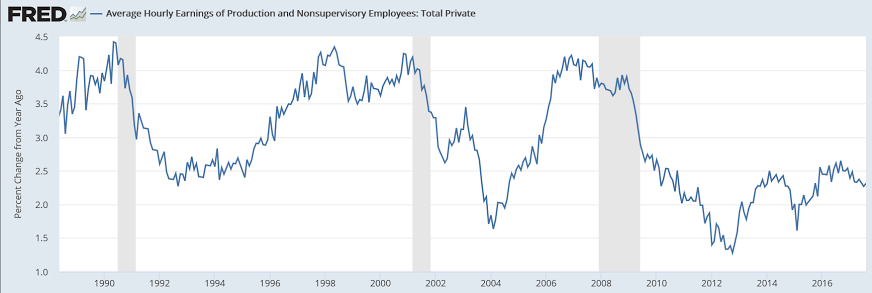
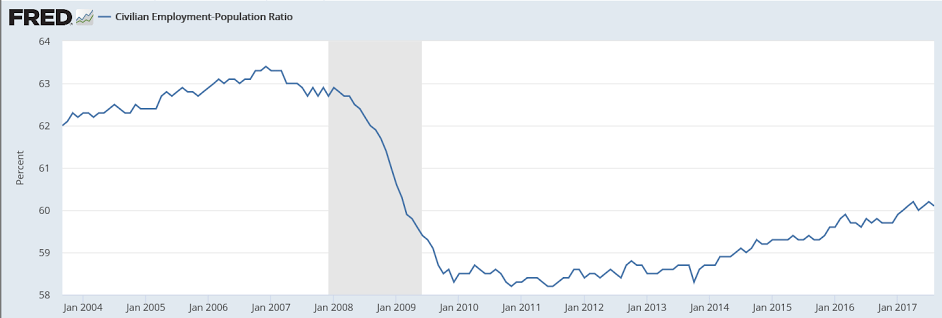
    Flattening out at very low levels:

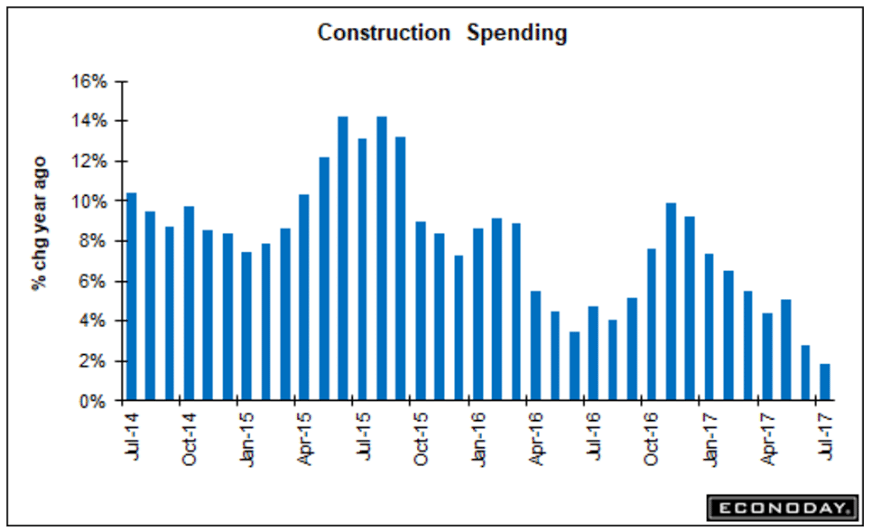
    Worse than expected as year over year growth continues to decelerate:

    Highlights

    Strength in residential building makes for a better construction spending report than indicated by the headline 0.6 percent July decline. Driven by single-family homes, residential construction rose a very solid 0.8 percent in the month for a year-on-year gain of 11.6 percent that contrasts markedly with the 1.8 percent overall rate. Home improvements, up 1.4 percent in the month, were also very strong. Spending on multi-family construction continues to moderate, down 0.8 percent in the month for only a 2.6 percent yearly gain.

    The real weakness in the report is on the nonresidential side where private spending, reflecting weakness across all components and especially commercial building, fell 1.9 percent for a yearly decline of 3.6 percent. Public building is likewise soft with the educational category down 4.4 percent in July.

    Though housing permits have been flat, the residential numbers in this report are solid. And strength for construction payrolls in this morning’s employment report might be hinting at better results for construction spending in the August report. Note that the unfolding effects from Hurricane Harvey will be difficult to gauge based on mixed results following prior hurricanes.

    A lot worse than expected:

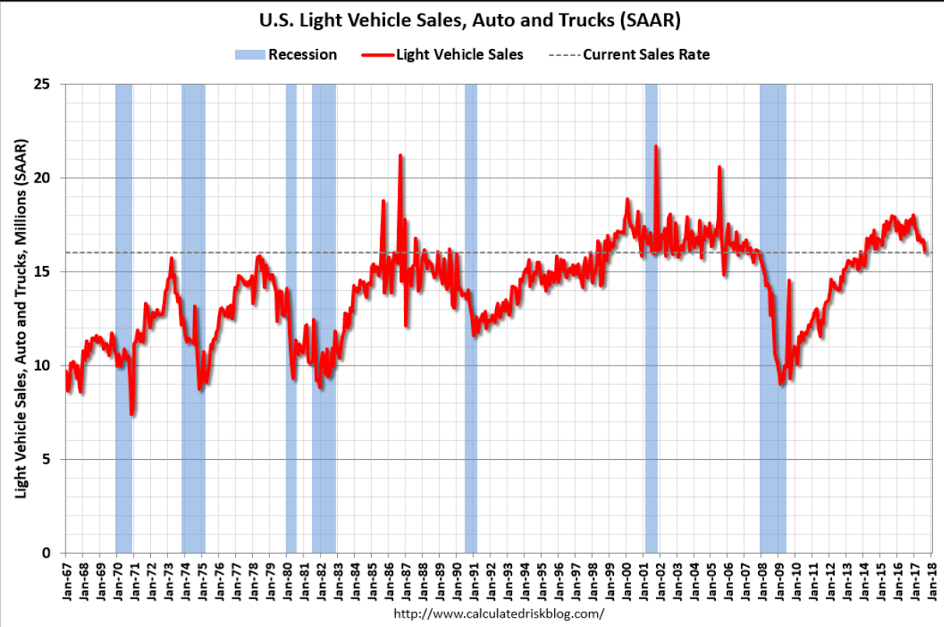
    U.S. Light Vehicle Sales at 16 million annual rate in August

    Based on an estimate from WardsAuto, light vehicle sales were at a 16.03 million SAAR in August.

    That is down 6% from August 2016, and down 3.9% from last month.

    Read more at http://www.calculatedriskblog.com/#i7LI02KP7LwY0m6L.99

    Interesting headline- speaks to current level of credibility.
    Nor does anyone seem to understand what happens if the debt ceiling is hit, and, to the contrary, there are likely hundreds in Congress who believe going ‘cold turkey’ into a balanced budget is ultimately a very good thing to let happen. Fact is, curtailments of spending cause growth to slow, and tax receipts to fall. Under normal circumstances, that just means the Federal deficit is that much higher, which acts counter cyclically to moderate the slowdown. However, after hitting the debt ceiling, falling revenues automatically induce further spending cuts, as the by law the Federal deficit can’t be allowed to increase, which induces a further slowdown in GDP and, again, tax receipts fall further, and it all goes into an out of control collapse like nothing anyone’s ever seen before:

    Steve Mnuchin insists there is a tax plan (Axios) — U.S. Treasury Secretary Steve Mnuchin says that details should become publicly available by the end of September with a bill passed by year-end. Mnuchin says that President Trump is “absolutely committed to revenue neutrality” in the tax plan, but that only applies under the White House’s optimistic economic growth projections. Mnuchin reaffirmed that Sept. 29 is when the U.S. will reach the current debt ceiling, although says it could move a few days in either direction due to both Hurricane Harvey and Sept. 15 corporate tax receipts. He also reaffirmed his preference for a “clean” debt ceiling increase.