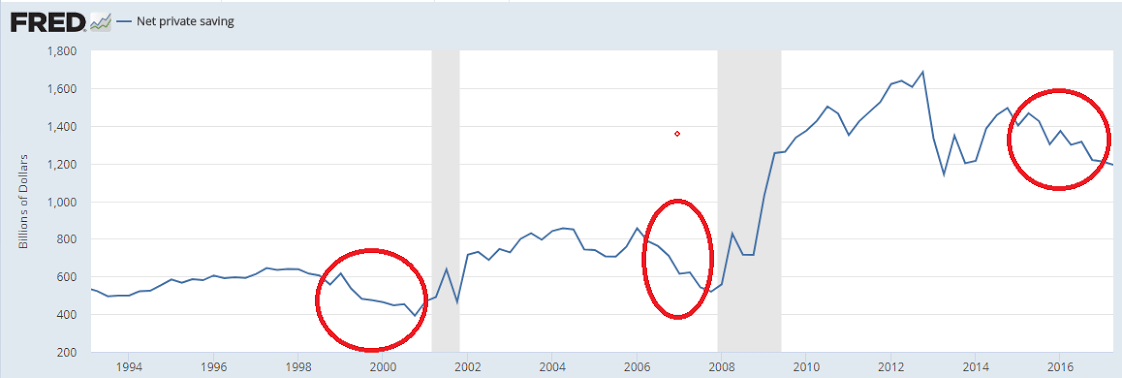
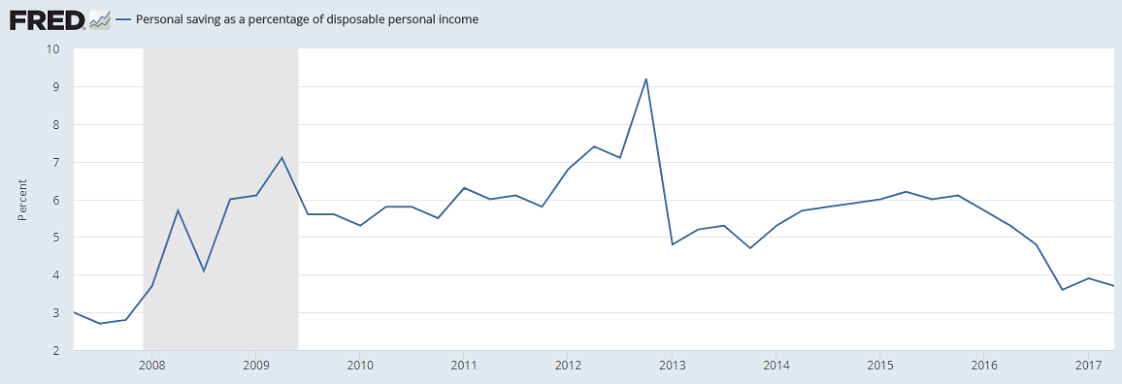
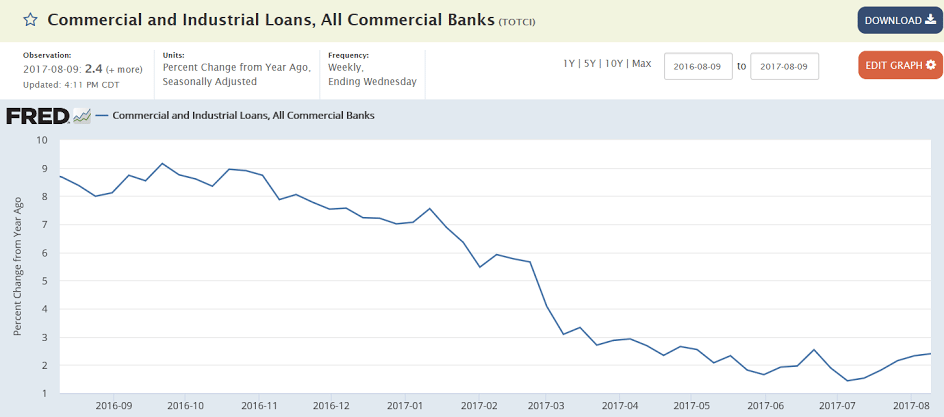
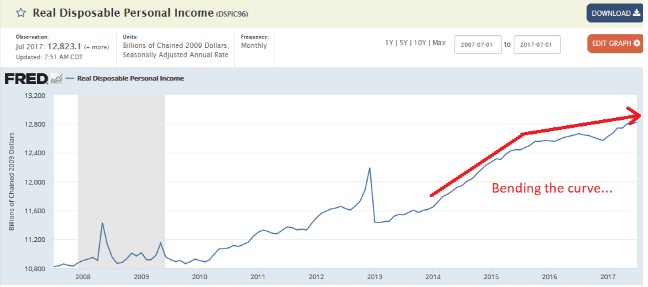
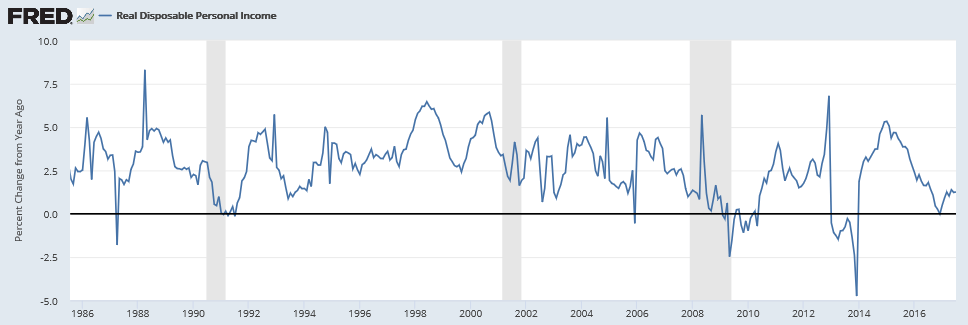
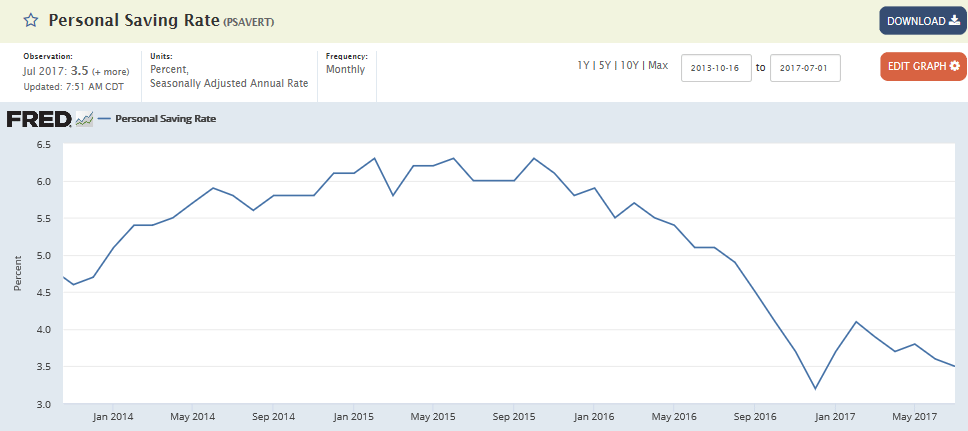
Personal income growth remains weal as per the charts, which also showed a sharp drop in the personal savings rate, which generally forecasts reductions in spending:
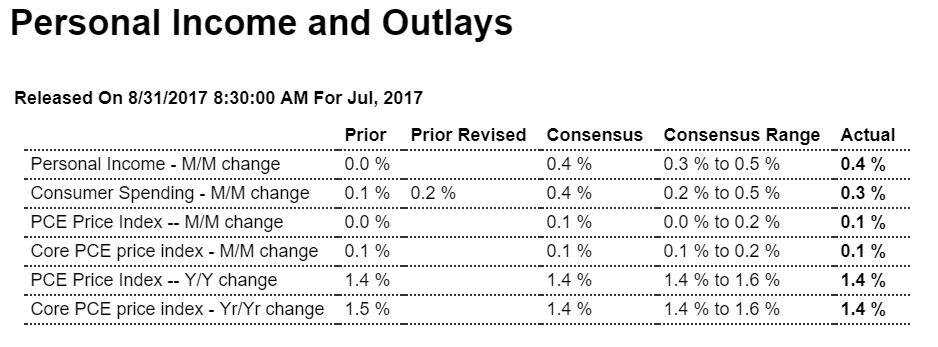
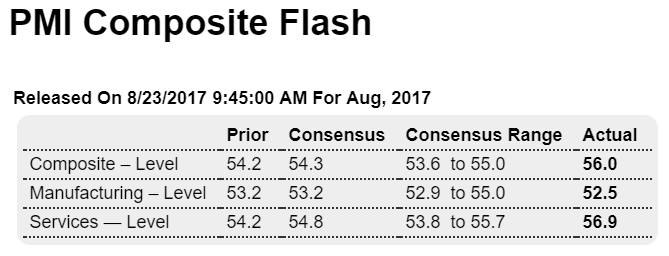
Highlights
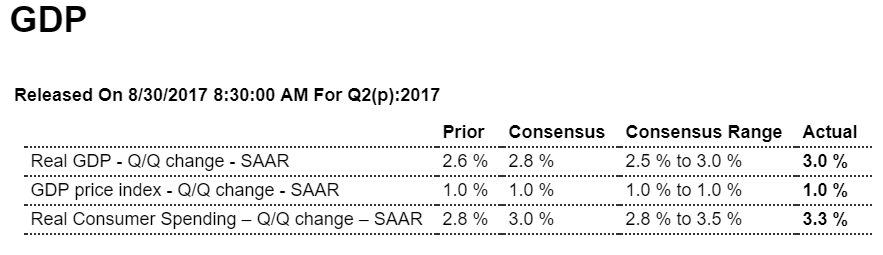
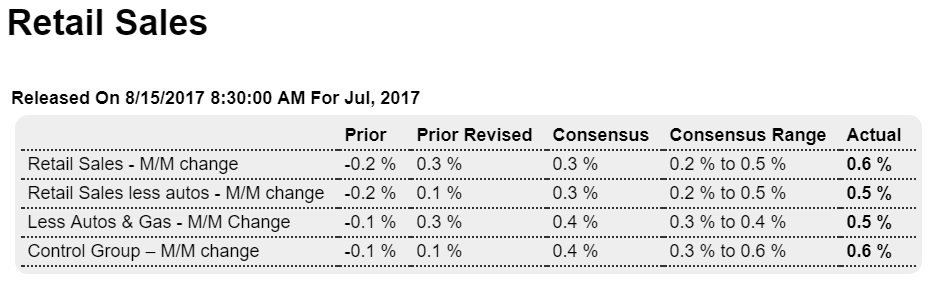
Vital signs for the consumer are strong but inflation is completely lifeless, based on a mixed personal income & outlays report for July. Income is the highlight, up 0.4 percent in the month including a second straight 0.5 percent gain for wages & salaries in what is an important and emerging sign of wage traction.
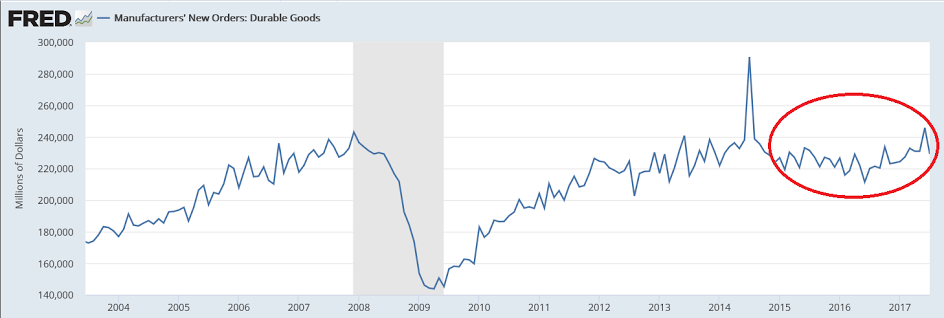
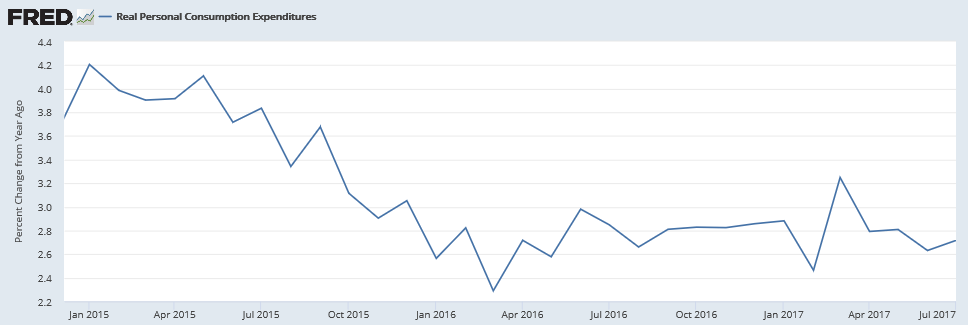
Consumer spending rose 0.3 percent in the month, 1 tenth below expectations as spending on services managed only a 0.2 percent gain to offset strength for durables, up 0.6 percent, and non-durables, up 0.5 percent. The spending gain represents a moderate start for the major component of third-quarter GDP.
Inflation readings, however, remain a major trouble spot, up only 0.1 percent both overall and for the core (less food & energy). Year-on-year rates are 1.4 percent both overall and for the core, the latter edging down 1 tenth in a result that won’t be raising the odds for the beginning of balance-sheet unwinding at September’s FOMC meeting.
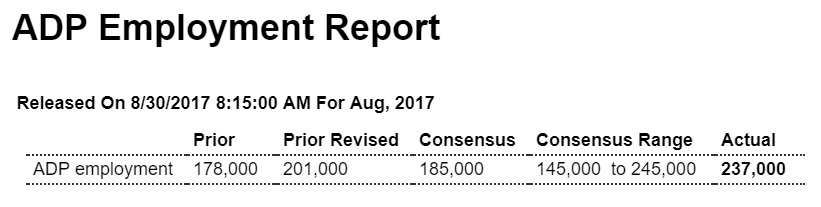
Employment is very strong and may finally be reflected in strength in wages, but gains here have yet to boost inflation readings which in this report are central to Federal Reserve policy. Nevertheless, the gain in income will put the focus on average hourly earnings for August in tomorrow’s employment report which, however, are not expected to show much strength.
Below stall speed:
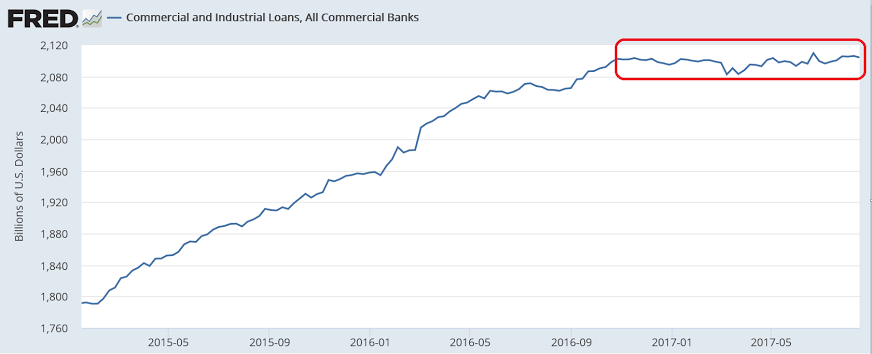
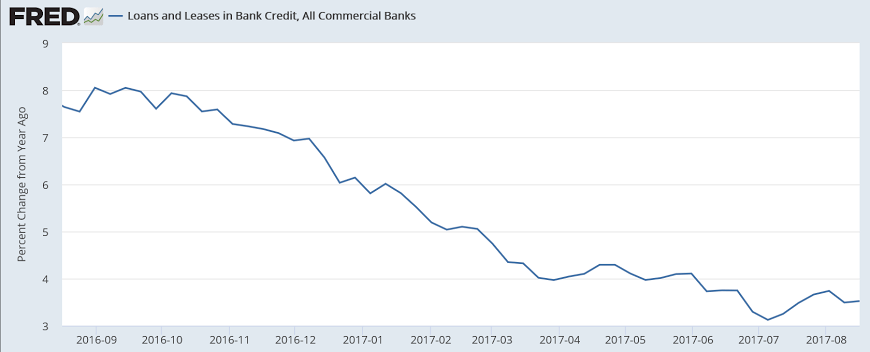
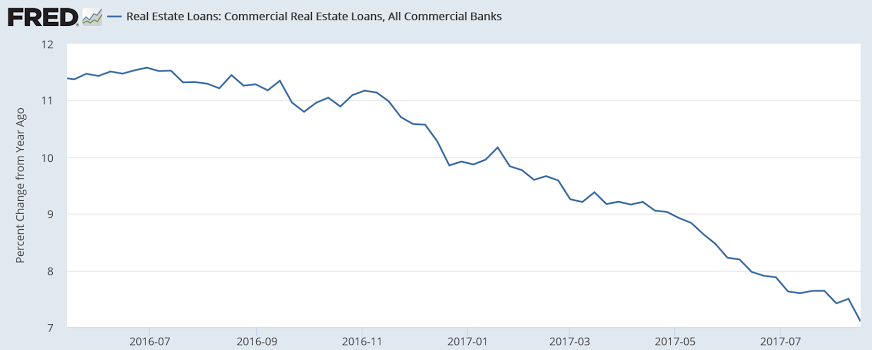
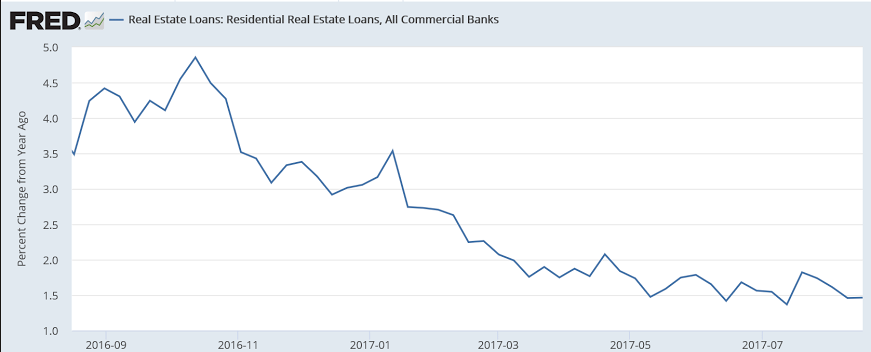
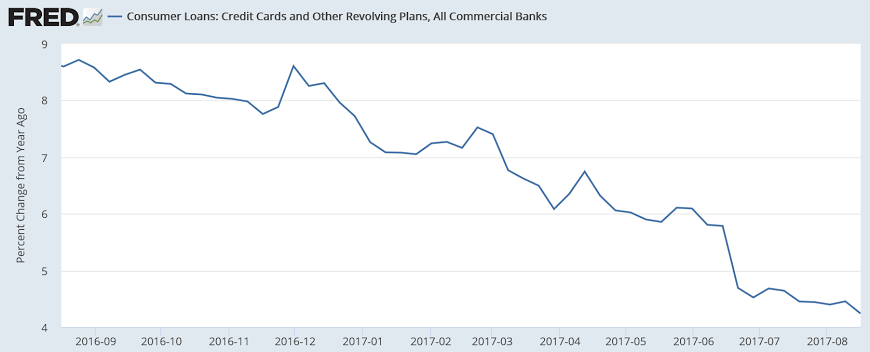
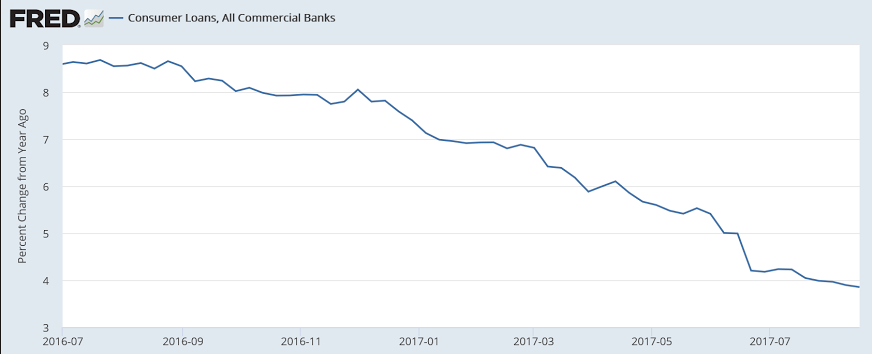
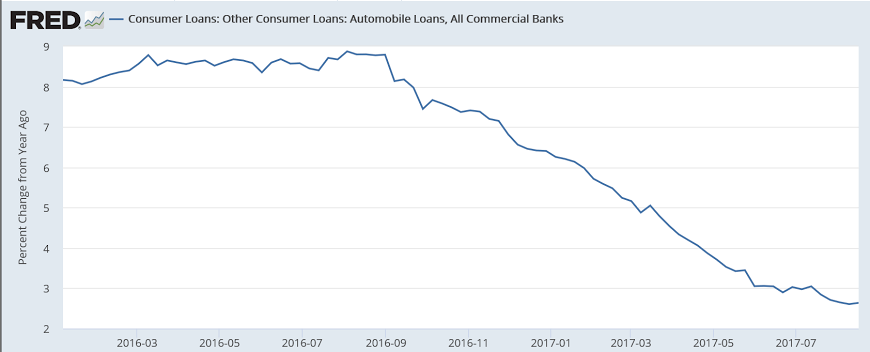
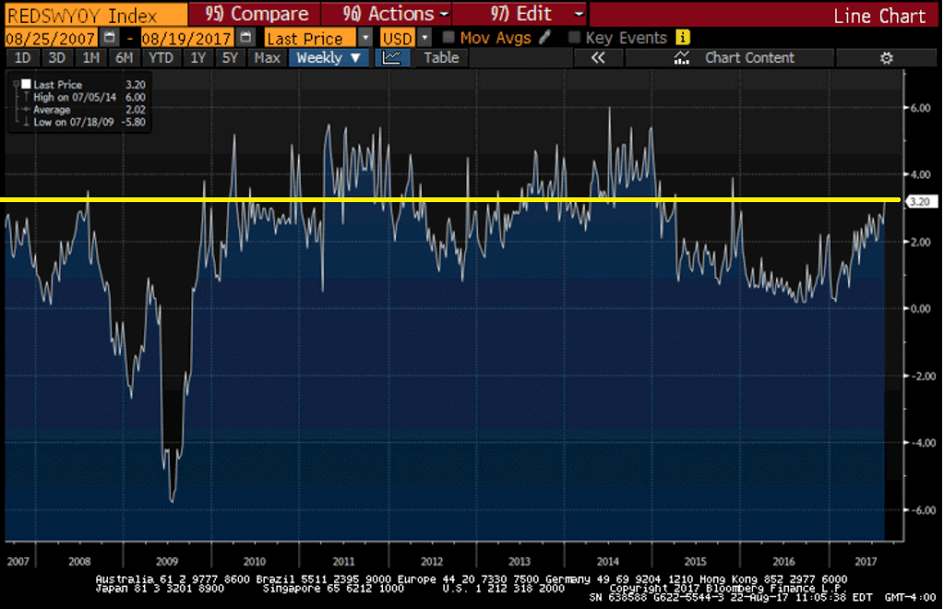
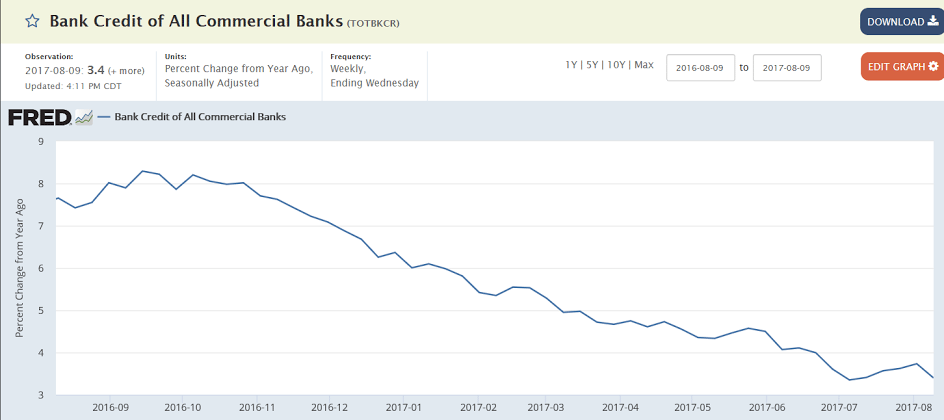
Consumers are both dipping into savings to spend and slowing the growth of their borrowing as well- an historically unsustainable combination:
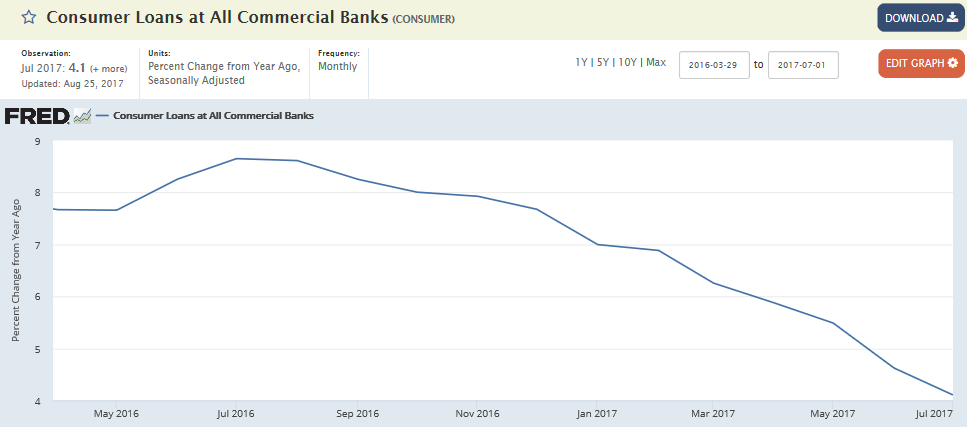
Low personal income growth and a consumer that’s been spending out out of savings even as consumer credit growth slows can quickly translate into a further reduction of spending:
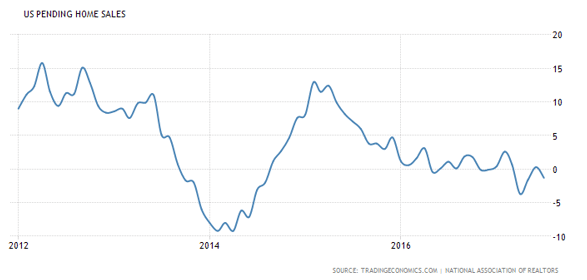
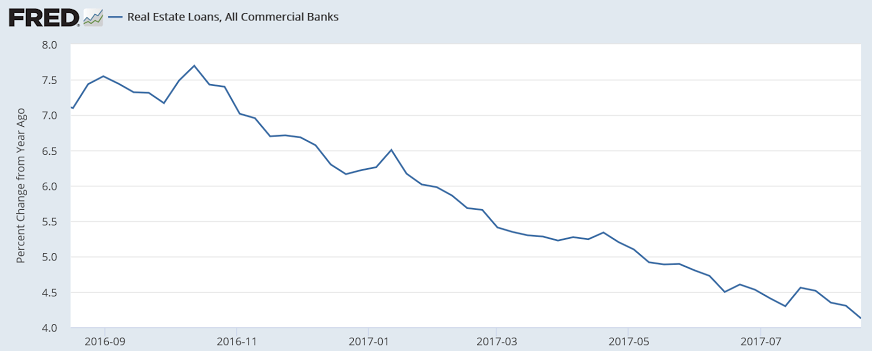
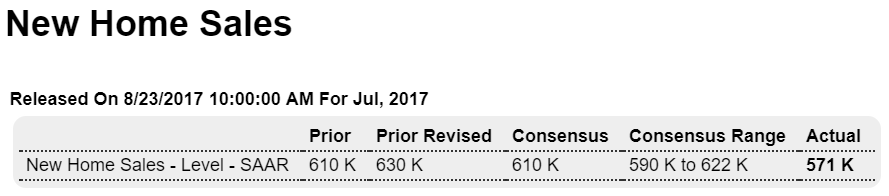
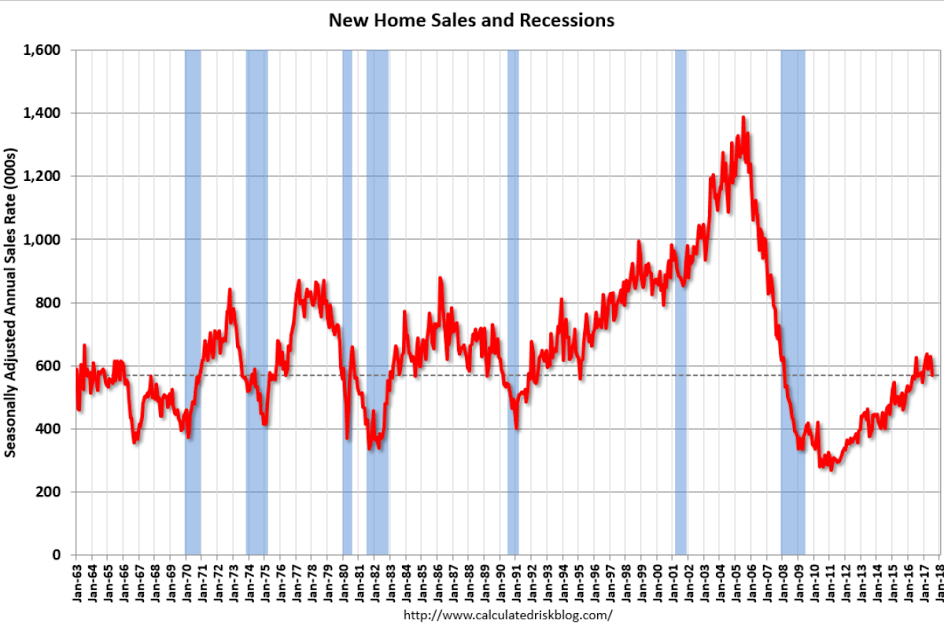
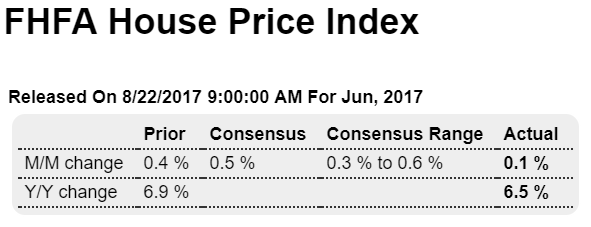
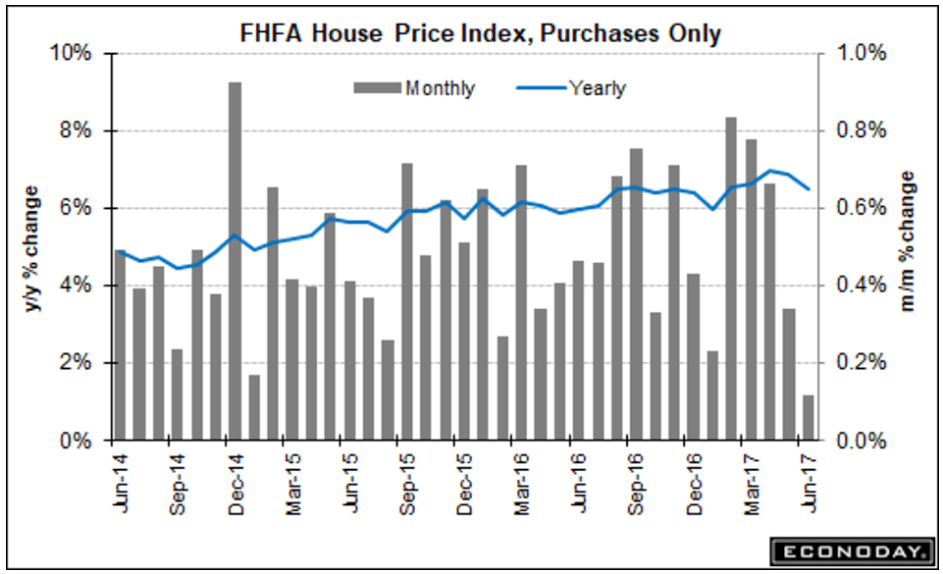
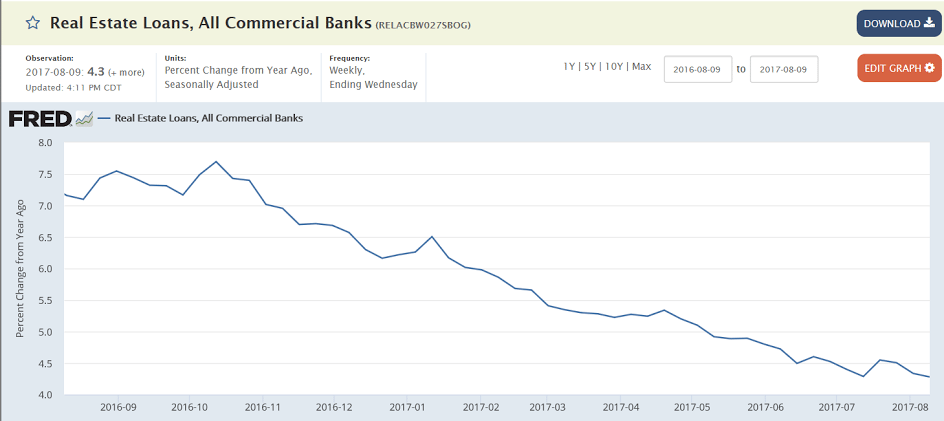
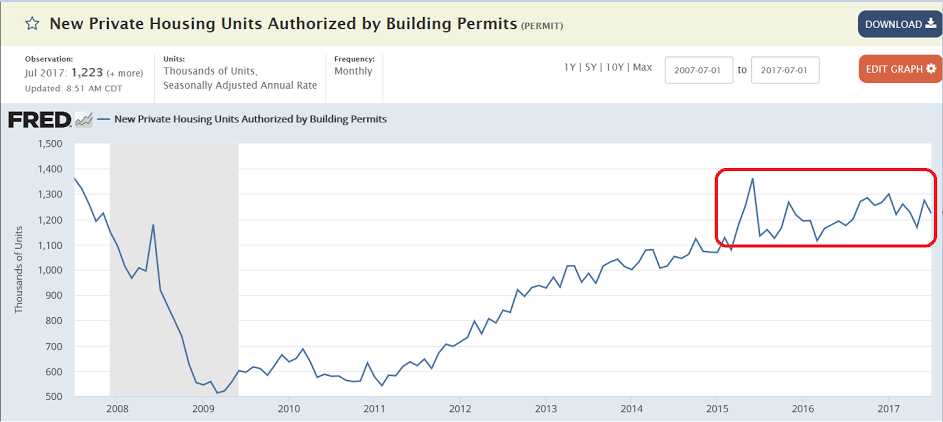
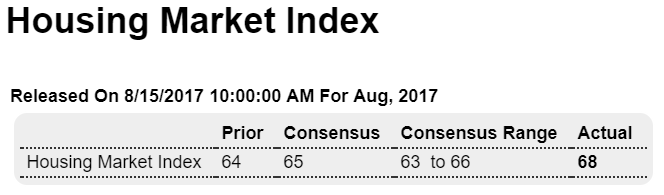
Further confirmation of weakness in real estate sales:
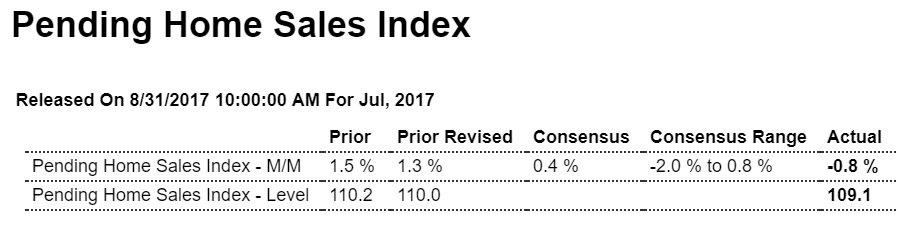
Highlights
For the fourth time in five months the pending home sales index fell, down 0.8 percent in July to signal weakness for existing homes sales which have fallen in three of the last four reports. The regional breakdown shows the South, which is the largest housing region, falling 1.7 percent in the month with the West, at plus 0.6 percent, the only one in positive ground. Pending sales take about a month or two to close which points to trouble for both the August and also the September existing home sales reports. Housing opened the year with strength before fizzling during the Spring selling season and limping through the Summer months. Also note that Hurricane Harvey is certain to depress home sales in the South in coming housing reports.