Trade, Manufacturing new orders, Redbook retail sales, GDP forecasts

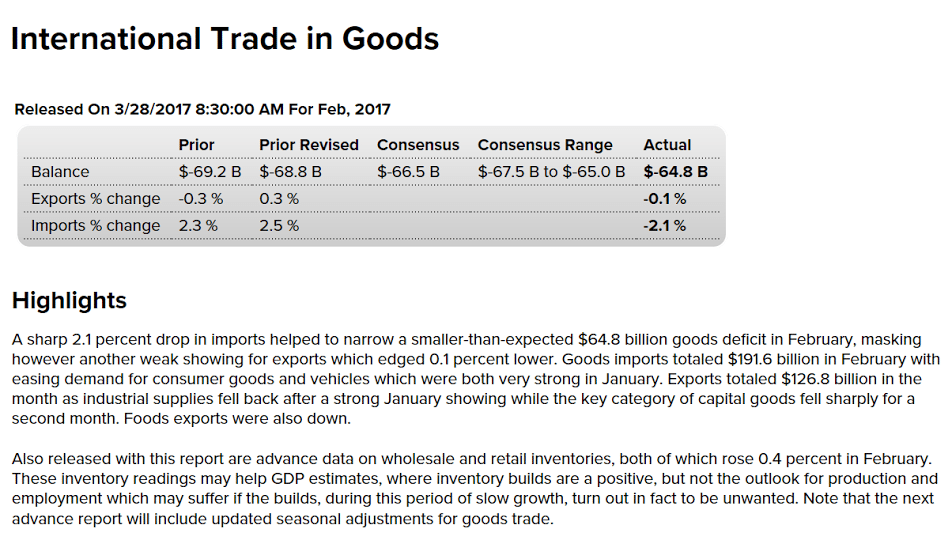
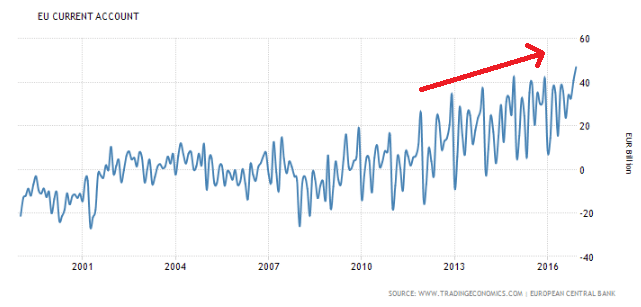
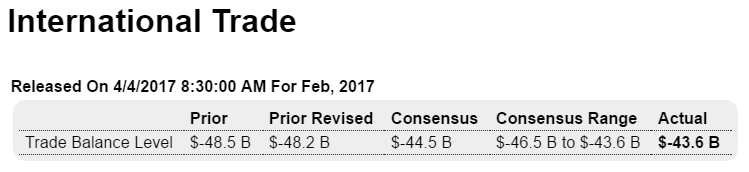
The trade deficit was a bit less than expected, all due to lower imports. The question is whether this means there were more domestic purchases, whether this is an indicator of lower aggregate demand:

Highlights
In favorable news for first-quarter GDP, the nation’s trade gap hit Econoday’s low estimate in February at $43.6 billion and reflects a 1.8 percent drop in imports but only a 0.2 percent gain for exports. The goods deficit came in at $65.0 billion vs $64.8 billion in last week’s advance report for February with the services surplus at $21.4 billion which is unchanged from January (there’s no advance report for services).

It has been strong demand for foreign consumer goods and foreign autos that has been a central factor behind the nation’s trade deficits, and the news in February, at least in terms of the deficit, is positive. Imports of consumer goods fell to $49.0 billion which is down a very sizable $3.1 billion from January. Imports of autos fell to $29.1 billion for a $2.7 billion decline. Offsets include a $1.3 billion rise in crude oil imports to $13.0 billion reflecting a sharp monthly increase of $1.31 per barrel to $45.25 along with a slight rise in volumes per day.

The export side, despite the fractional gain, is less constructive. Exports of capital goods extended their flat-to-lower trend, down $0.6 billion in the month to $42.9 billion and due entirely to civilian aircraft. Exports of foods fell $0.7 billion with nonmonetary gold down $0.4 billion. A positive is a $0.7 billion upturn in exports of consumer goods to $17.1 billion. Less positive, however, is a flat month for services where exports were unchanged at $64.4 billion with the surplus relative to $43.0 billion in service imports once again flat at $21.4 billion. Services have been the strength of the U.S. trade picture.

Country data show the trade deficit with China at $23 billion in the month followed by the EU at $9.4 billion, Mexico at $5.8 billion, Japan at $4.7 billion and Canada at $2.1 billion. Note that country data are unadjusted which makes monthly comparisons difficult especially given February’s 28 days vs January’s 31 days.

For GDP these data are very positive and help offset not only January’s large trade deficit but also what’s evolving as a weak quarter for domestic consumer spending. For cross-border trade, this report is not upbeat, showing less demand for goods and services both here and abroad.

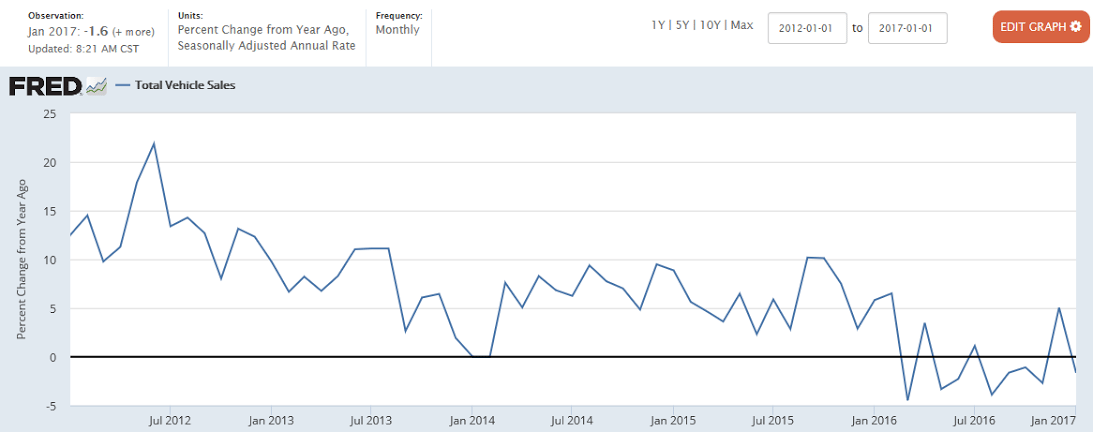
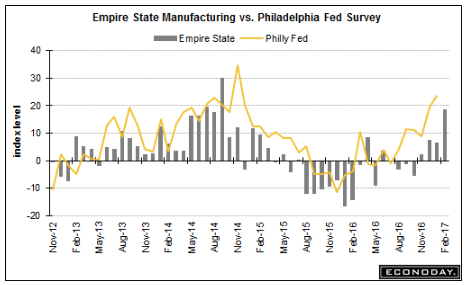
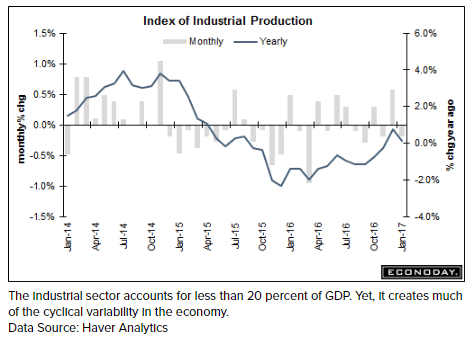
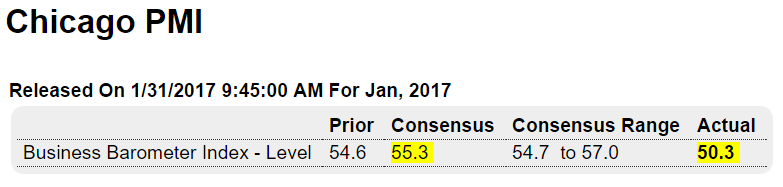
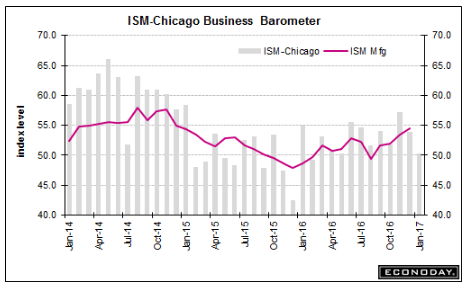
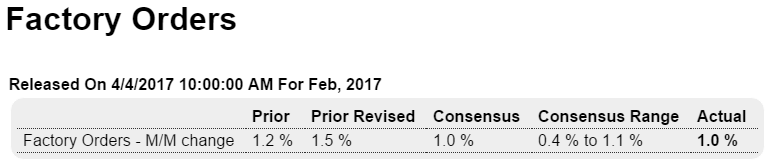
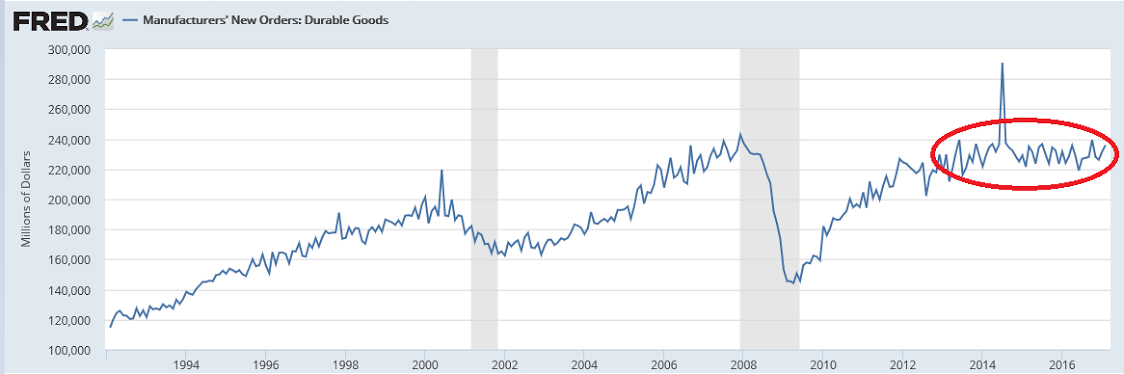
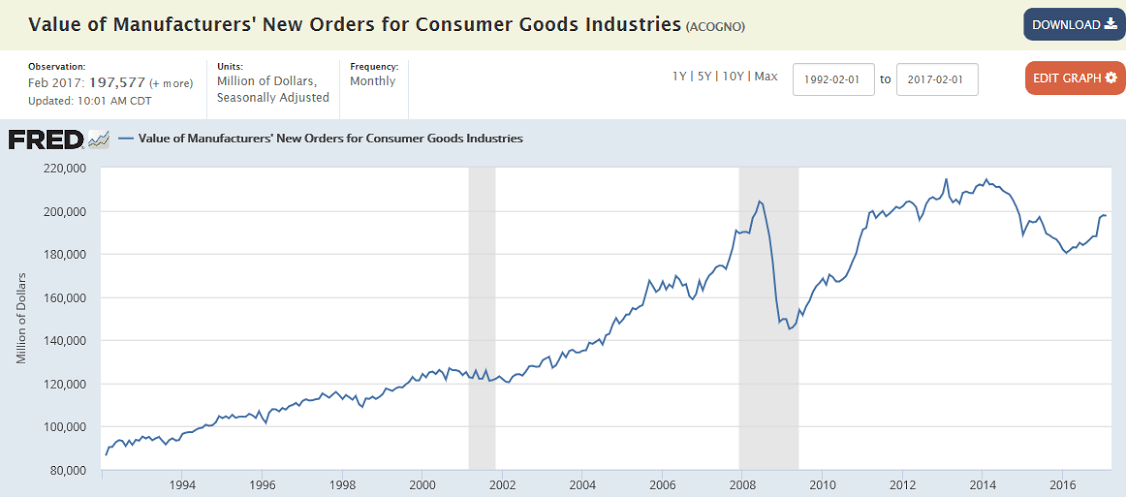
Manufacturing continues to drift sideways, as per the chart. And note that vehicle sales have softened considerably since this report and aircraft orders are likely to revert:
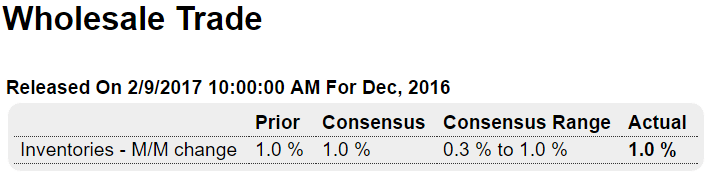
Highlights

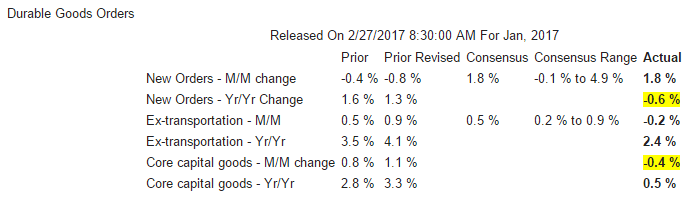
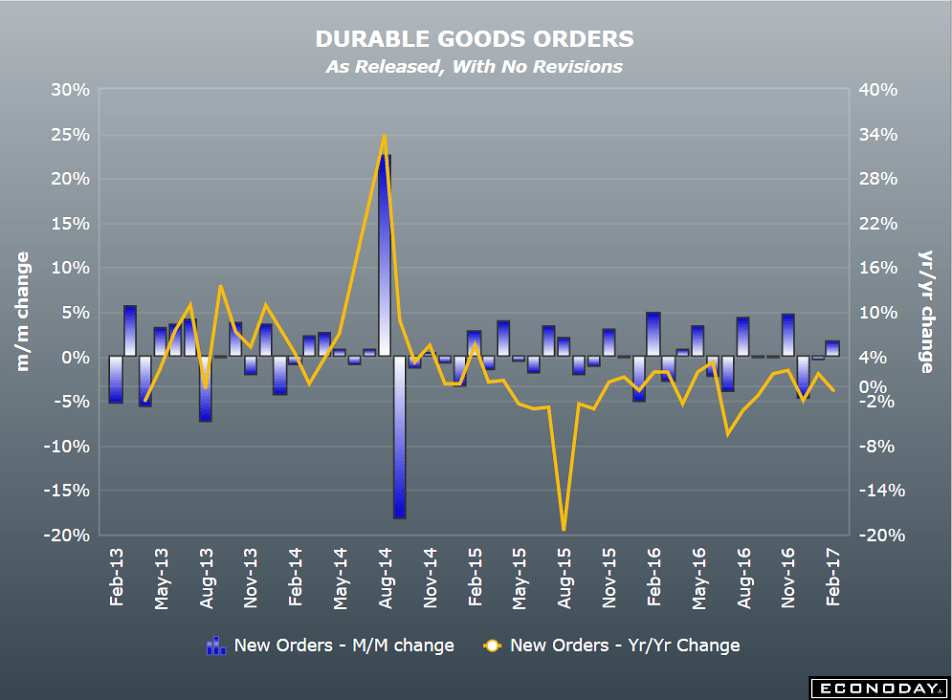
Factory orders may not be showing the same kind of strength that the ISM and Philly Fed are pointing to but they are solid, hitting Econoday’s February consensus at a 1.0 percent gain. Adding to the strength is a 3-tenth upward revision to January which is now at a 1.5 percent gain that follows December’s unrevised 1.3 percent rise.

The durables side of the report, up 1.8 percent in the month (revised from 1.7 percent in last week’s advance data), reflects a second month of outsized strength for aircraft, at a 56 percent monthly gain vs January’s 188 percent surge. But durables also include a respectable 0.3 percent gain for vehicles. Nondurable goods inched 0.2 percent higher on strength in chemicals (there is no advance report for nondurables).

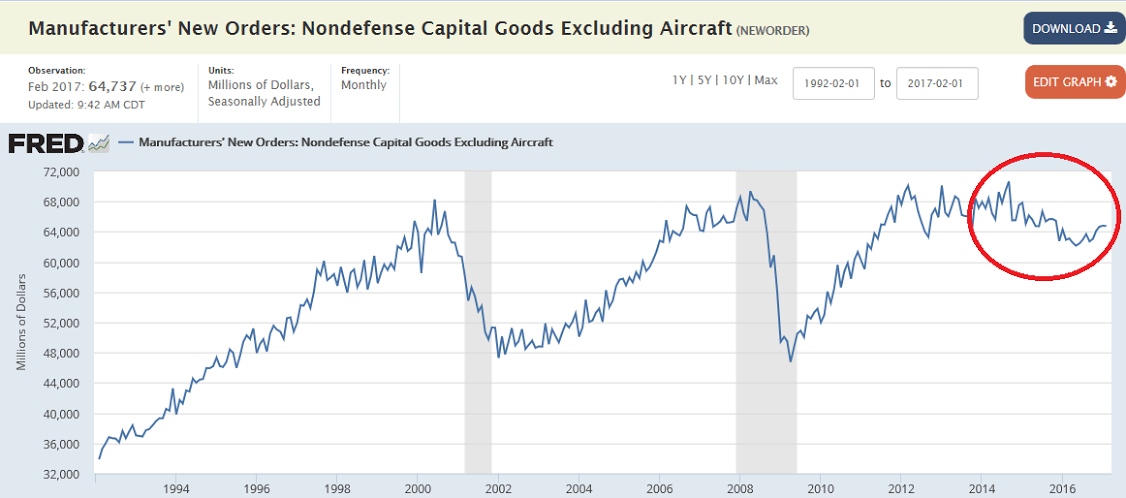
But there are cracks that perhaps betray the strength and one is a second weak month for core capital goods (nondefense ex-aircraft) where orders fell 0.1 percent after managing only a 0.2 percent gain in January. Yet given strength of prior orders, shipments of core capital goods — which are an input into first-quarter GDP — rose a very solid 1.0 percent to help offset January’s disappointing 0.4 percent decline. This is an important positive for first-quarter GDP which had been slipping.

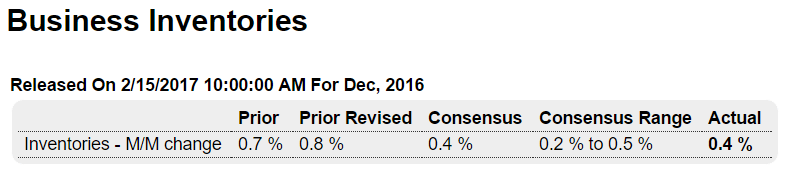
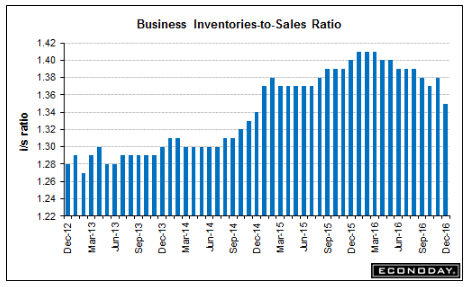
Turning back to weaknesses, total unfilled orders were unchanged in February to extend a nearly yearlong streak of disappointment. Lack of unfilled orders will not spark demand for factory hiring. Inventories rose 0.2 percent in line with a 0.3 percent rise in total shipments to keep the inventory-to-shipments ratio unchanged at 1.31.

Another question in this report is the two months of reliance on aircraft orders where strength cannot be expected to extend indefinitely, to say the least for this volatile component. And this morning’s trade report poses further questions especially for capital goods exports which have been stubbornly flat. Still, on a total basis, factory orders are showing the directional lift that advance anecdotal reports have been signaling with rare strength.

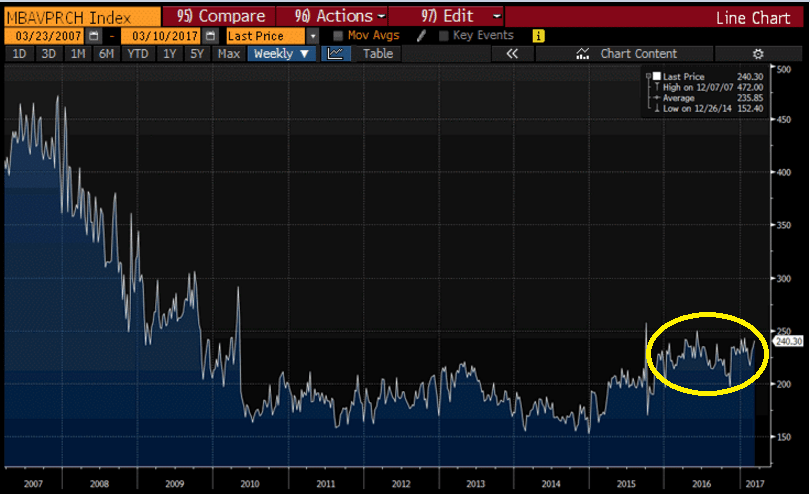
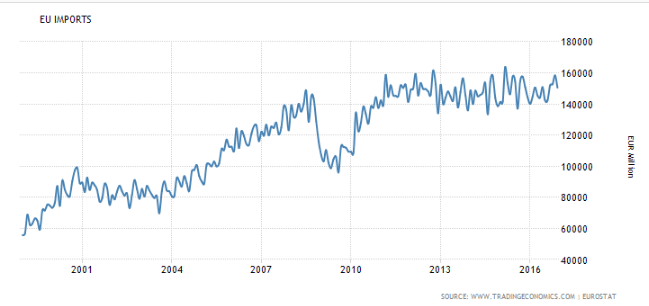
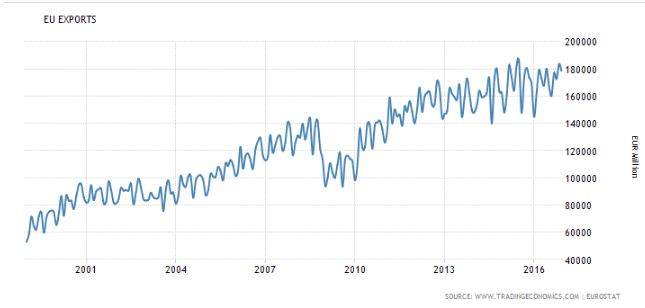
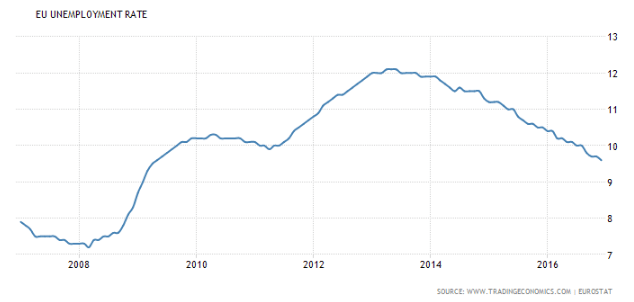
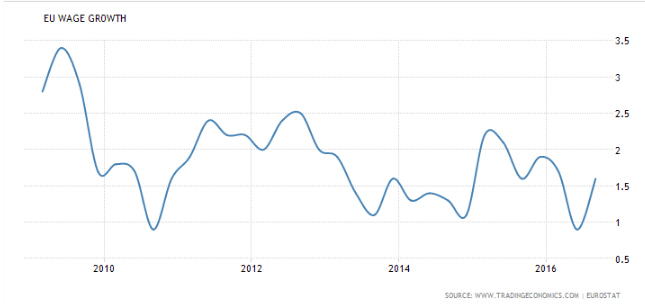
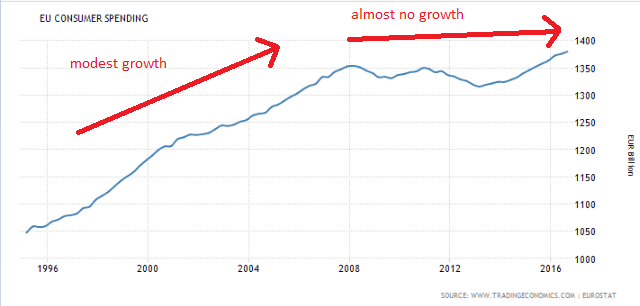
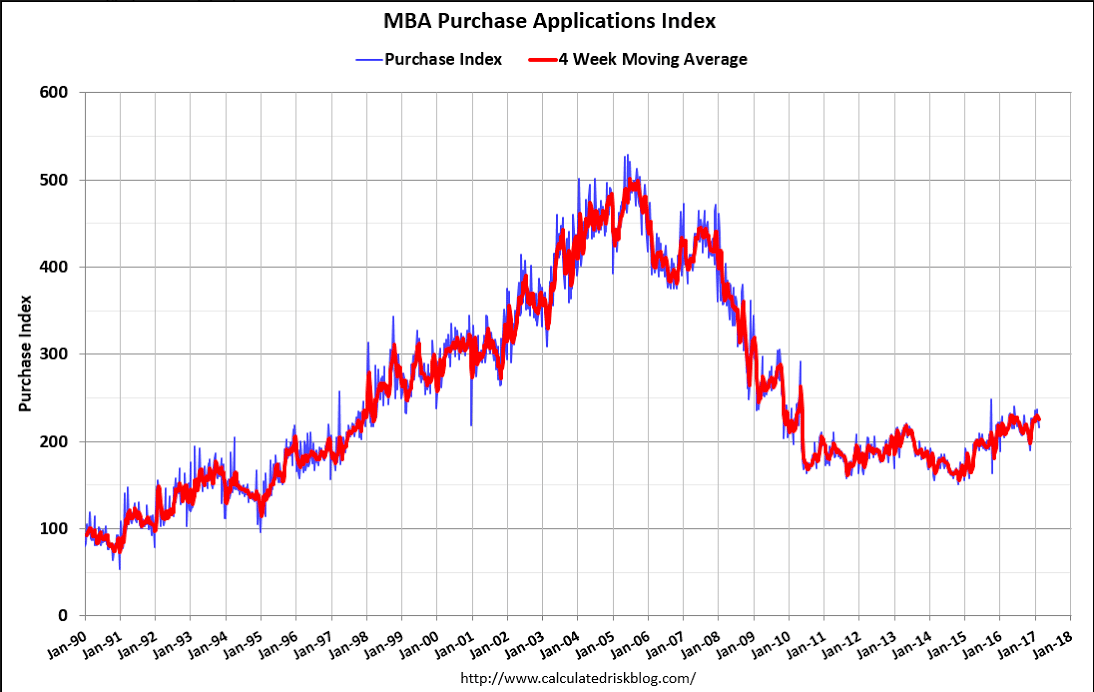
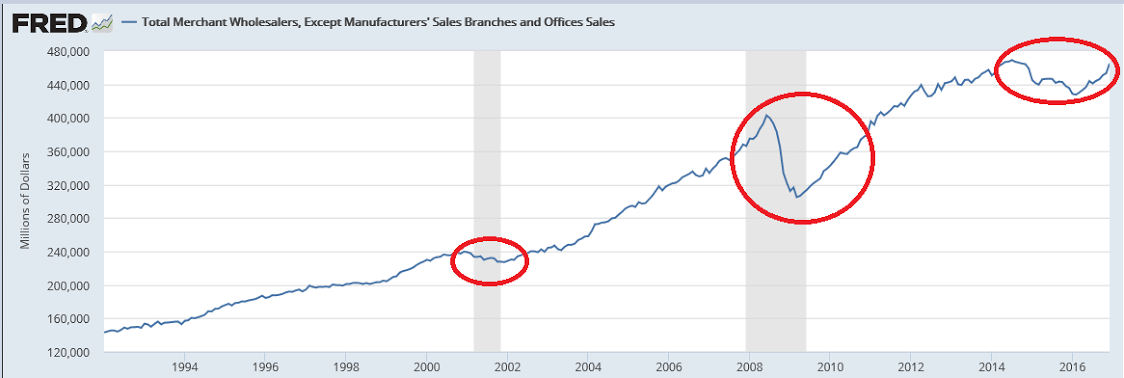
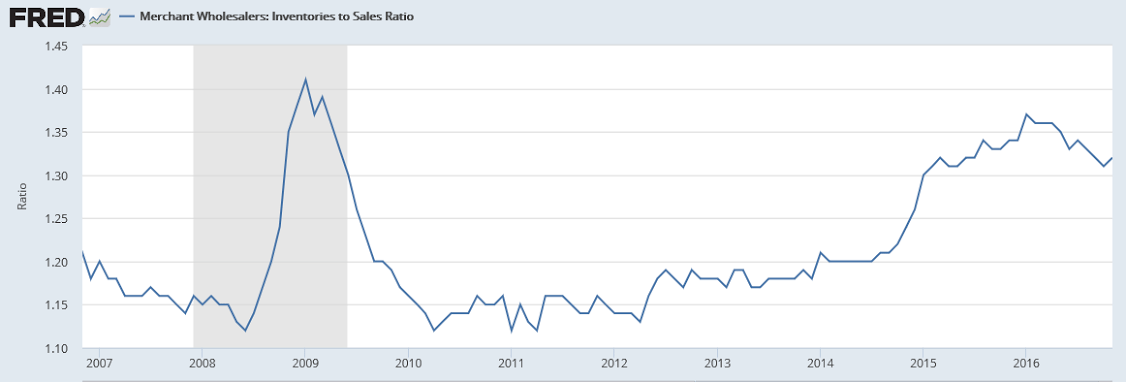
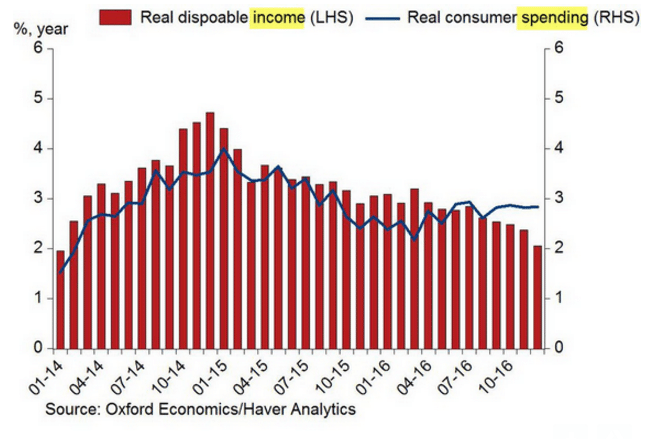
Note how the charts show we’ve yet to recover to 2008 levels, and these numbers are not adjusted for inflation:


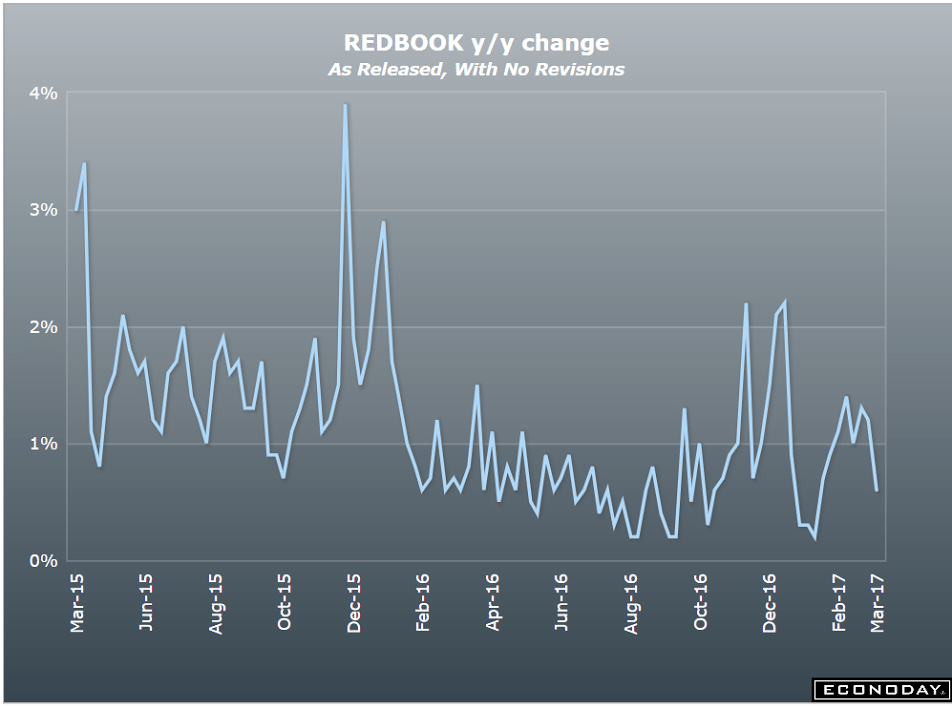
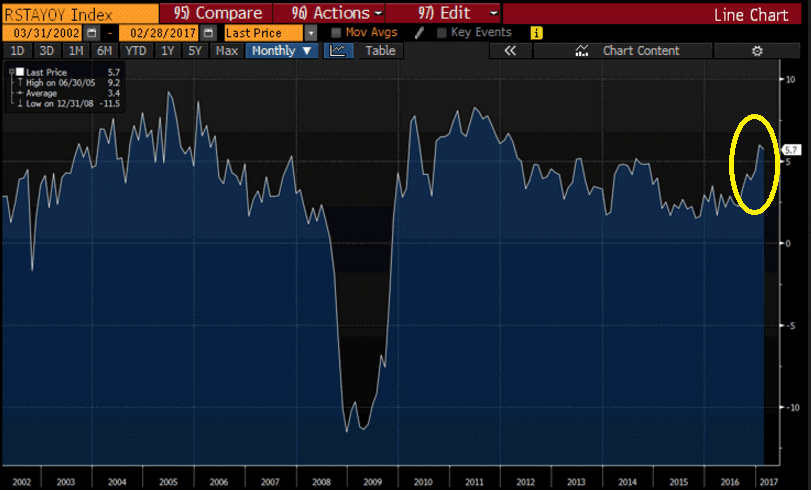
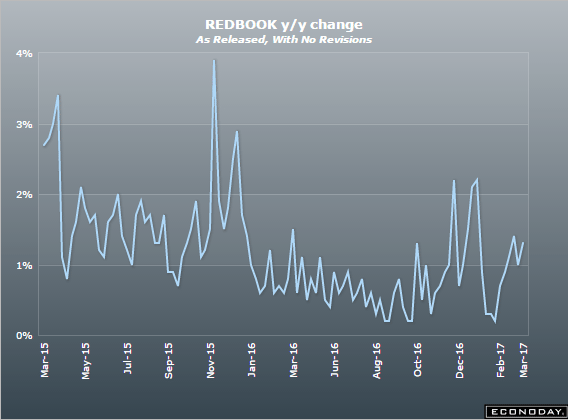
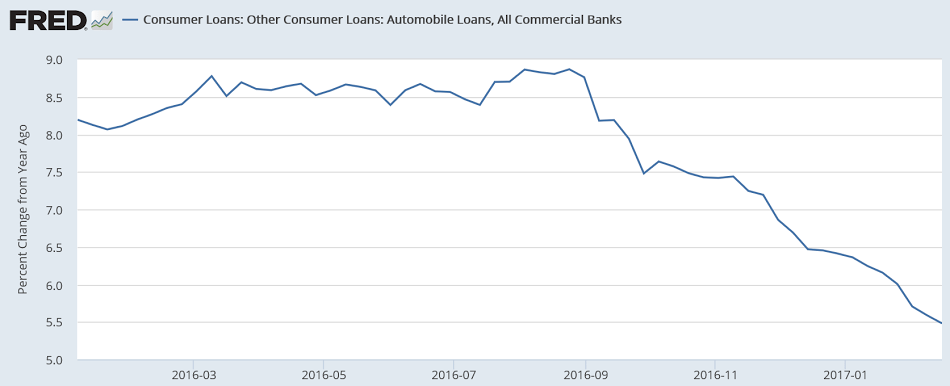
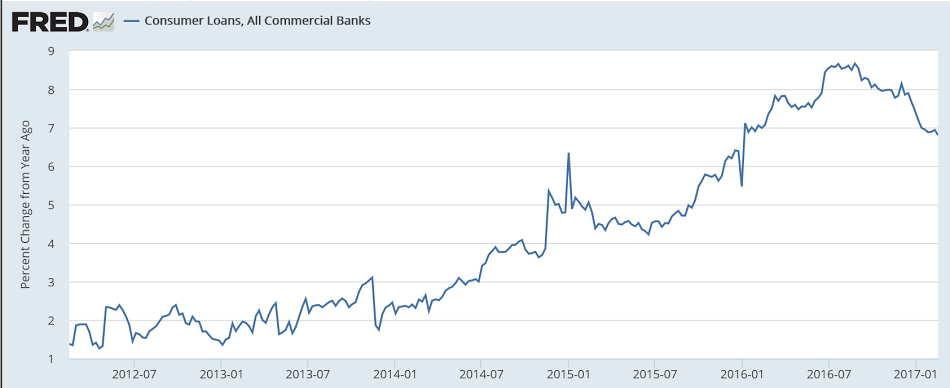
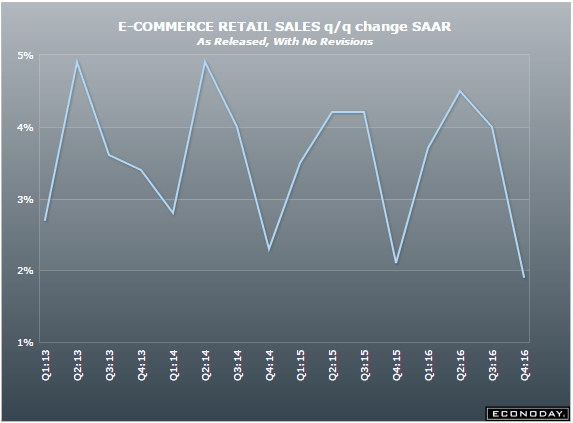
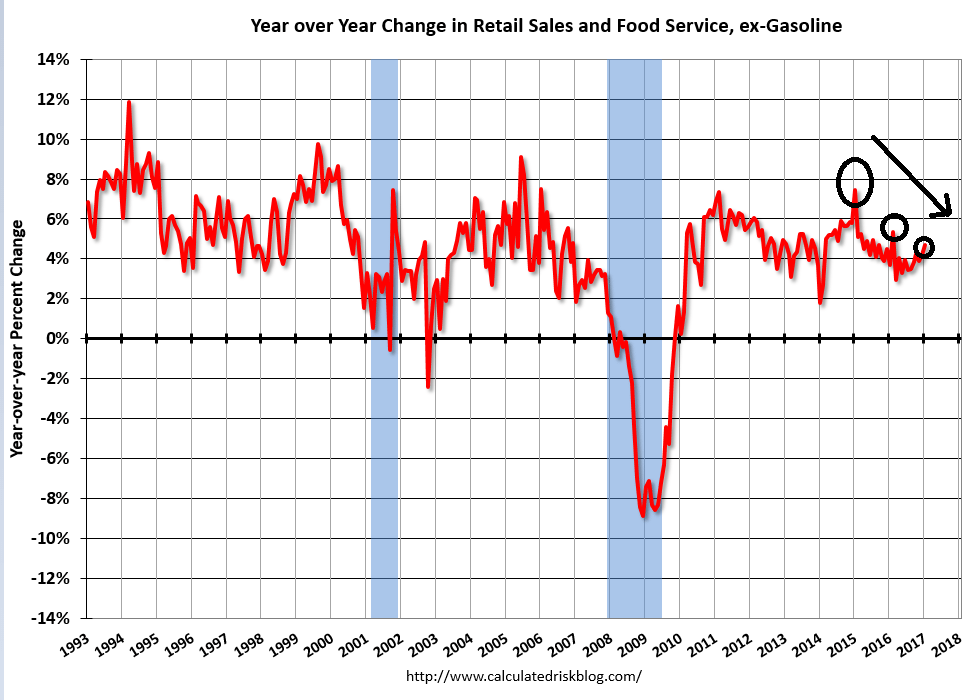
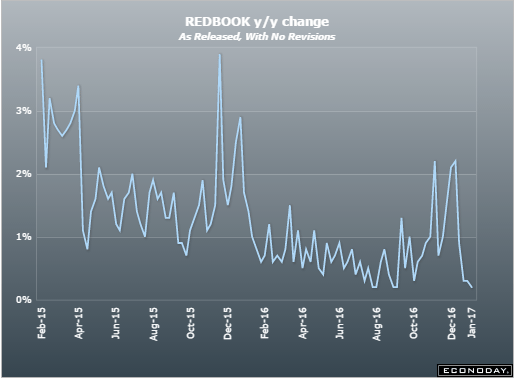
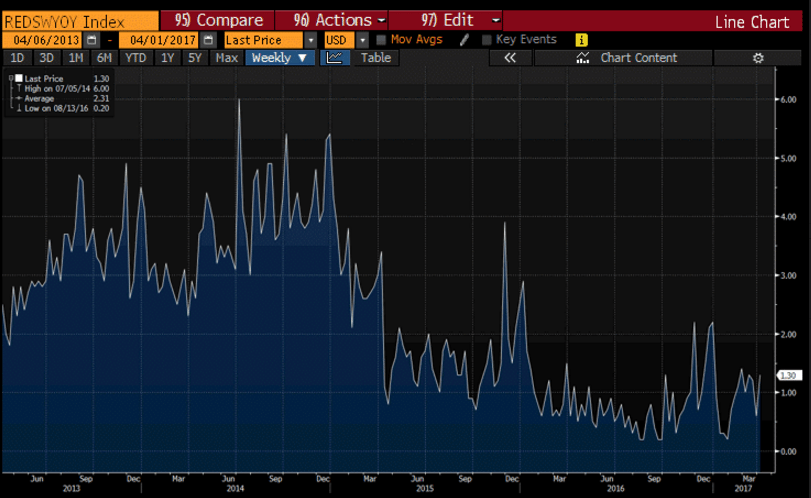
This measure of retail sales growth collapsed when oil capex collapsed and remains depressed:


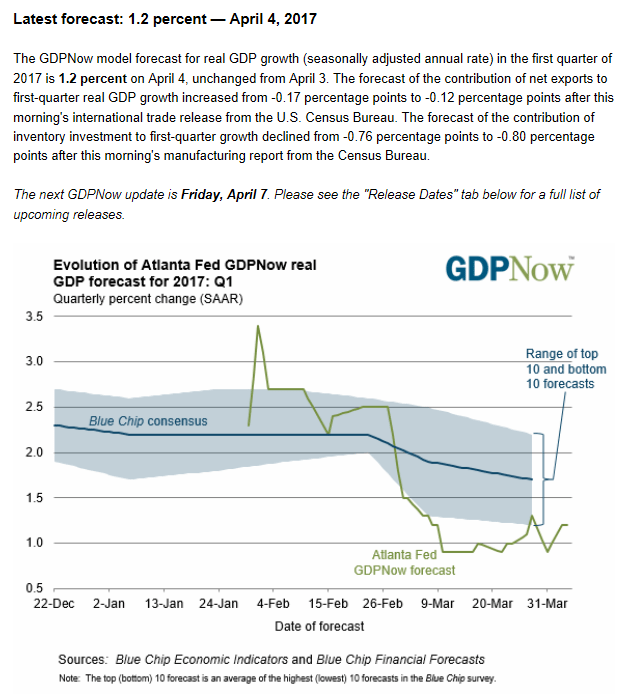
Note how the other forecasts have been working their way down towards the Atlanta Fed’s forecast:

Border tax comments, Redbook retail sales, International trade, Consumer confidence

So they used to tell the story about a guy who claimed he could make cars out of wood, and he started a company in Oregon that brought trees into one door of his giant building with new cars coming out of another door, and he wouldn’t let anyone inside to see how it was done. He was given a award for innovation and widely acclaimed, until one day someone got inside and saw he was shipping the trees out the back to Japan and bringing in new Korean cars. He was then arrested and jailed, etc. etc.

Point is, for the macro economy it didn’t make any immediate difference what was going on behind those closed doors, and that for purposes of understanding one can think of a nation’s foreign trade as similar to a company that takes in all that it can export and delivers back whatever is imported.

This model also promotes the understanding of how, in real terms, exports are the costs of imports, and optimizing real terms of trade is about getting the most cars for the fewest trees, which is likewise what first-pass productivity is all about for the domestic economy.

What about the jobs lost due to increased productivity? Well, history shows it used to take 99% of the workforce to grow the food we need to eat to live, and today in the US it takes maybe 1% of the workforce to grow enough food to eat with a lot left over to export. Yet unemployment isn’t necessarily any higher today than it was back then. Why? Because there’s always a lot more we think needs to get done than there are people allowed to do it, and unemployment comes from a lack of funding, and not a lack of things to day. Today the service sector dominates, and more so every day, with no lack of services we’d like to have done as far as the eye can see. And unemployment, as currently defined, is necessarily the evidence that for a given level of govt. expenditure the economy is that much over taxed, as a simple point of logic. Not that policy makers understand that, of course…

Now let’s add a border tax to the model, for the purpose of creating jobs, not withstanding how that premise is categorically ridiculous, as per the prior discussion. But, to quote Don Rumsfeld, ‘We’ve got to fight with the army we’ve got.’ Anyway, a border tax would put a tax on importing the cars to attempt to keep us from buying them so we would have more jobs building cars domestically, and reduce the tax on exporting the trees so we would have more jobs cutting down and shipping out trees.

Let’s assume that that’s what happened and then look at the consequences. First, we would be shipping out more trees and getting fewer cars. This makes the nation as a whole worse off due to those reduced real terms of trade. The next step is to identify the winners and losers, recognizing the losses to our standard of living are higher than the gains. Best case: we put more people to work growing more trees so we have just as many trees for ourselves, and we’d put more people to work building cars so we’d have just is many cars as before. So what we accomplished is that we are working more to be left with the same amount for ourselves.

That’s called a drop in productivity, and a decline in our standard of living, since work is an input and a real cost of production. Work itself is not an economic benefit. The economic benefits of work is the output produced. And the whole point of producing output is consumption of some type, either for immediate use or for future use. That is, it makes no economic sense to work and produce output for the purpose of immediately throwing it away.

So with the above ‘best case’ assumptions, the border tax does work to create jobs, and unemployment is a political problem, which is why the border tax has that element of political appeal. Not that it matters, but my first choice for job creation would be a fiscal adjustment, either a tax cut or spending increase, large enough to promote sufficient spending to increase sales, output, and employment, in order to produce that additional output. That way we have that much more domestic output to consume plus all the imported cars we were buying before the border tax, and we don’t have to give away the extra trees due to the border tax proposal.

And how does it look from the government’s point of view?
First, the government expects extra revenue from the tax on the imported cars, net of the revenue lost from tax benefits for exporters. This means less spending power for consumers paying the tax, presumably offset by new tax cuts, making it all revenue neutral, which – through some presumed channels – is theorized to have its own positive consequences.

So in this ‘best case’ scenario Americans work more and get less, while consumer taxes go up while other taxes go down. Once thought through, that whole topic hardly seems worth a second look?

But that is only the economic best case scenario. All kinds of other things can happen, with the same model used for purposes of analysis.

More later…

This used to run between 3% and 4% before the collapse In oil capex:


A bit ‘better’ than expected, to use mainstream values, and note the details in the narrative are not so ‘good’:


Seriously trumped up consumer expectations continue:

Mtg purchase apps, Retail sales, Business inventories, Housing index

The seasonally adjusted Purchase Index increased 2 percent from one week earlier. The unadjusted Purchase Index increased 3 percent compared with the previous week and was 6 percent higher than the same week one year ago.
Read more at http://www.calculatedriskblog.com/#rYAGsCBZRKvRLYa4.99

Depressed and moving sideways for over a year:

Prior month revised up, but current month worse than expected, and I suspect the seasonal adjustments a nominally small increase in sales to translate into a much larger seasonally adjusted number, to be reversed later in the year:

Highlights

February and January have to be averaged but together they confirm strength in the consumer. Retail spending could manage only a 0.1 percent gain in February but January, which was already solid, is now revised 2 tenths higher to 0.6 percent.

A surprising point in this report is that these headline gains, though less than astonishing, were made despite weakness in the motor vehicle component which had been strong late last year and makes up about 1/5 of total retail spending. Auto sales fell 0.2 percent in February and 1.3 percent in January. Excluding autos, February retail sales rose 0.2 percent with January showing a standout 1.2 percent surge which is the strongest monthly gain in 5 years, since February 2012.

Gasoline pulled down February’s results, falling 0.6 percent after rising 2.1 percent in January. When excluding both autos and gasoline, sales rose 0.2 percent vs January’s very strong 1.1 percent. And control group sales, which are another core measure, inched only 0.1 percent in the month but follow an outstanding 0.8 percent gain in January, one that initially posted at 0.4 percent.

It’s the January revision that is most striking and which points to an upward revision for total consumer spending in the national accounts, one that came in at only 0.2 percent in the initial January report. Yet even the two months together, retail sales, though solid, are far from the astonishingly strong readings underway in consumer confidence, a mismatch that will play out in the months ahead. Another factor to note is that January and February are the two slowest months for retail sales, which makes for an outsized effect from seasonal adjustments.


Still high and still coming down and thereby weakening output and gdp. Auto inventories are particularly bloated due to lower sales:

Highlights

Inventory growth looks moderate and stable, at an expected 0.3 percent in January and roughly in line with underlying sales growth which came in at an even more moderate 0.2 percent. The inventory-to-sales ratio is unchanged at 1.35.

Heavy auto inventories at dealerships are key right now in the inventory picture, and weakness in auto sales (posted this morning in the retail sales report) doesn’t point to much of a draw for auto inventories in February. Dealership inventories in January surged 2.4 percent with total retailer inventories at plus 0.8 percent. Excluding autos, however, retail inventories were unchanged. Manufacturer inventories rose a steady 0.2 percent in January with wholesalers reporting a 0.2 percent draw.


Trumped up expectations:

Highlights

Strong optimism is the theme of so many reports including the housing market index which is up a very sharp 6 points in March to 71 for the best reading of the economic cycle. Home builders peg current sales at an index of 78, up 7 points from February, and see future sales also at 78, for a 5 point gain. And their assessment of traffic is perhaps most telling, at 54 for an 8 point gain. This is the 3rd plus 50 score for this reading in the last 4 months and it suggests that first-time buyers, who have held down the housing sector this cycle, are also optimistic and are looking to buy a new home.

This report points to strength for permit data in tomorrow’s housing starts report and also to strength in next week’s report on new home sales. But optimism doesn’t always translate into immediate strength for hard economic data and it’s important to remember that new home sales have been struggling in recent months.

NFIB index, Redbook retail sales, Oil

Trumped up expectations falling off some,
and the details don’t look so good:


Highlights
The small business optimism index fell 0.6 points in February to 105.3, retreating slightly from the lofty levels reached in the previous months after the post-election surge in November and the largest increase in the history of the survey in December that shot the index to the highest reading since December 2004. The small decrease was in line with expectations and the fact of the index remaining above 105 for three consecutive months indicates the continuation of a very high level of optimism for small business owners.

Of the 10 components of the index, 3 slightly increased, 6 modestly declined and 1 remained unchanged. Current inventories rose 3 points to minus 2 and plans to increase inventories increased by 1 point to 3. Current job openings also rose by 1 point to 32, the highest level since December 2000. But plans to increase employment fell 3 points to 15, as did expectations of higher real sales, which fell to 26, and the view that now is a good time to expand, which also dropped 3 points to 22.

NFIB noted that business owners are being squeezed, on the one side by historically tight labor markets, where the scarcity of qualified workers pressured 26 percent of owners to raise compensation, the highest reading in 10 years. At the same time, owners are limited in how much they can increase compensation since they are not so confident of their ability to pass on the costs by raising prices for consumers. Although business owners reported higher sales in February, which rose to the first positive reading since early 2015, expectations of future higher sales did fall 3 points. And earnings trends, the outlier negative among the components, remain quite weak and weakened further in the month by 1 point to minus 13.

Though an exceptionally large net 47 percent of small business owners still expect the economy to improve, a decrease of only 1 point from the January survey, the question remains whether small business owners will turn their optimism into action. According to NFIB, this will happen when their two biggest priorities, health care and taxes, are addressed.


Marginally better but nowhere near the 3-4% gains from before oil capex collapsed:


No telling what they might do next:

Pending home sales, Durable goods orders, Dallas Fed, Bank loans, Japan

Same story, expectations trumped up but actual numbers not so good:

Bad:

Highlights

Just when existing home sales seemed to be showing lift the pending home sales index, which tracks initial contract signings, is down 2.8 percent in the January report. This points to weakness for final resales in February and March.

The West is the culprit in January’s data, with contract signings down 9.8 percent in the month for year-on-year contraction of 0.4 percent. The Midwest is also weak, down 5.0 percent in the month for 3.8 percent on-year contraction. The South and the West both show no better than low single digit monthly and yearly gains.

Adding to the bad news is a sharp downward revision to the December index, now at plus 0.8 percent vs an initial 1.6 percent. This hints at less strength for February existing home sales, sales that proved strong in last week’s January report which however is now a memory. This setback for resales follows last week’s sharp downward revision for December new home sales and together they point to a housing sector where growth is suddenly struggling.

Bad:

Highlights

Throw out the all the advance indications that show unusual acceleration in the factory sector, because the meat of the January durable goods report only shows the usual volatility behind which are sagging numbers for key readings. Aircraft, both domestic and defense, skewed durable goods orders sharply higher in January, up 1.8 percent to hit the Econoday consensus. Not hitting the Econoday consensus, however, are orders that exclude aircraft as well as all other transportation equipment. This reading fell 0.2 percent to come in well below Econoday’s low estimate for a 0.2 percent gain.

The worst news in the report is a 0.4 percent decline in orders for core capital goods (nondefense ex-aircraft). This ends 3 months of strength for this reading and pulls the rug out from expectations for a first-quarter business investment boom as indicated by business confidence readings.

Pulling the rug out from the whole factory outlook is yet another contraction for unfilled orders, down 0.4 percent and which have now fallen in 7 of the last 8 months. This is the deepest contraction since the recession and points squarely at lack of hiring for the factory sector. In other data, shipments are down 0.1 percent and inventories are unchanged to keep the inventory-to-shipments ratio unchanged at 1.61.

But aircraft is a big positive in this report though monthly gains are not likely to extend far, if at all. Upward revisions to December are a plus for fourth-quarter revisions while another positive is a 0.2 percent January gain for motor vehicles where the outlook however, given the strength of prior sales gains, is uncertain and will pivot on Wednesday’s release of February unit retail sales. Weak exports have been the Achilles heel of the factory sector and today’s report points to continued lack of demand for U.S. factory goods. Watch for advance data on goods exports in tomorrow’s trade report for January.


Ok, but check out the highlights:

Highlights

Yet another advance report, in yet another contrast with definitive data, is showing significant strength. Readings are very positive in the Dallas Fed February report including a nearly 5 point gain in production to a very strong 16.7 and a nearly 2-1/2 point gain for general activity to 24.5.

New orders, however, slowed by just more than 4 points to what is a still solid 11.6. Delivery times are taking longer and inventories of inputs are higher, both positive indications of demand. Input costs are up with wage growth solid. Selling prices are even showing traction.

This report may be getting a general lift from easy comparisons as the Dallas factory region is just emerging from 2 years of energy-related weakness. But the wider risk for anecdotal surveys like this one is that, in their low key methodology where respondents often offer general, not numerical, answers to questions, they are picking up improvement in sentiment as opposed to actual measurable improvement in dollars or volumes.

Still in deceleration mode:

Who would’ve thought ‘monetary policy’ doesn’t work (anywhere):

The World’s Most Radical Experiment in Monetary Policy Isn’t Working

Feb 26 (WSJ) — Japan is nearly four years into a Central Bank stimulus effort involving printing trillions of yen and guiding interest rates into negative territory. Bank of Japan governor Haruhiko Kuroda’s shock-and-awe stimulus, launched in April 2013, fizzled after a short-lived spurt of growth and rising prices. Japan fell back into deflation last year. In November, Mr. Kuroda postponed his goal of reaching 2% inflation. He said in a series of speeches last year that an entrenched “deflationary mind-set” stifled hope that wages or prices will rise, limiting the impact of monetary policies such as negative rates.

Euro area current account, E commerce retail sales, Tax refunds

This is very euro friendly stuff.

Euro Area Current Account

Eurozone’s current account surplus widened sharply to EUR 47.0 billion from EUR 41.4 billion in the same month of the previous year. The primary income surplus increased firmly to EUR 18.2 billion from EUR 13.0 billion a year ago and the goods surplus rose to EUR 32.8 billion from EUR 31.4 billion, while the services surplus was nearly unchanged at EUR 6.4 billion. Meanwhile, the secondary income deficit rose to EUR 10.5 billion from EUR 9.3 billion in the same month a year earlier. Considering 2016 full year, the current account surplus widened to EUR 361.8 billion from EUR 316.7 billion in 2015.


Imports (real benefits) flat and exports (real costs) growing reduces ‘real terms of trade’ and thereby the real standard of living:


And the trade surplus is good for export industries but at the expense of the macro economy:

Hi unemployment depresses domestic demand, wages, etc. improving ‘competitiveness’:


Lower lows:

Retail sales, Empire manufacturing, Mortgage purchase applications, Industrial production, Builder confidence, Business inventories

First the good news:

Up more than expected and last month revised higher:

Highlights

Consumer spending data have been surprisingly moderate given the unusual strength in consumer confidence, but today’s retail sales report, which includes an important revision, now moves spending more in line with confidence. Retail sales rose 0.4 percent in January which tops Econoday’s very modest 0.1 percent consensus and the top estimate of 0.3 percent. Importantly December, which is the most important retail month, is now revised a sharp 4 tenths higher to a very strong plus 1.0 percent.

Vehicles were the special strength of the December report, at a revised plus 3.2 percent vs an initial 2.4 percent, and in a give back are really the only weakness in the January report at minus 1.4 percent. Excluding vehicles, retail sales jumped a very sharp 0.8 percent in January which again beats the top forecast. Ex-auto for December is also part of the good news, revised 2 tenths higher to 0.4 percent.

Electronics & appliance stores show a big January gain at 1.6 percent with restaurants at 1.4 percent and department stores up 1.2 percent. Sporting goods, clothing, health & personal care and building materials all show gains.

But gasoline, where prices are up, have been adding to the gains the past two months and excluding which sales in January show a less impressive gain of only 0.2 percent. This reading for December, however, is a much more impressive plus 0.8 percent.

But gasoline only dims the strength of the report for January which, next to February, is the slowest month on the retail calendar. Today’s data point to momentum for consumer spending, which is by far the economy’s most important sector.

I’m waiting to see if the spikes keep getting lower as in the prior cycle:


Now the not so good news:


As previously discussed, it was weather related elevated utility output that supported the higher than expected report.

Now last month has been revised lower and this month has reversed as utility output ‘normalizes’:

Highlights

A swing in utility output skewed what is, however, no better than a modest industrial production report for January. Industrial production, reflecting a 5.7 percent weather-related drop for utilities, fell 0.3 percent which is below Econoday’s no-change consensus.

But the real disappointment in the report is the manufacturing component which could muster no better than a consensus gain of 0.2 percent. This reading hasn’t been able to build any momentum to speak of and was held down in January by a sharp 2.9 percent monthly downswing in vehicles. Excluding motor vehicles, manufacturing volumes rose 0.5 percent which is really the highlight of today’s report. Also a highlight though is mining which is the report’s third and smallest component. Mining continues to show new life with a very sharp 2.8 percent jump in January.

Overall capacity utilization reflects the general softness of the industrial sector, at 75.3 percent for a 3 tenths decline in the month and 4.6 percentage points below its long run average. Manufacturing utilization is likewise soft at 75.1 percent.

The industrial economy, held down by weak global demand, has been running below average the past 2-1/2 years, when energy prices first collapsed in mid-2014. But advance indicators, including this morning’s Empire State report, are almost uniformly pointing to a rebound ahead, a rebound however that has yet to appear in the government’s definitive data.

Highlights

The big post-election surge in home builder optimism is over as the February housing market index is down 2 points to a much lower-than-expected 65. This is still well above breakeven 50 and points to confidence but marks a noticeable drop from 67 and 69 in January and December.

Builder confidence in the market for newly-built single-family homes declined two points in February to a level of 65 on the National Association of Home Builders/Wells Fargo Housing Market Index (HMI).
Read more at http://www.calculatedriskblog.com/#d255y1KsUy63VrWh.99

All three HMI components fell in February. The component gauging current sales conditions dipped one point to 71, and the index charting sales expectations in the next six months registered a three-point decline to 73. The component measuring buyer traffic dropped five points to 46.
Read more at http://www.calculatedriskblog.com/#d255y1KsUy63VrWh.99

Inventory/sales ratio came down but watch for a reversal in Jan as vehicle and other sales were down. And in any case they remain elevated:

Wholesale inventories and sales, Trump comments

20901

Highlights

Inventories have been on the climb raising the risk of unwanted overhang. But overhang isn’t the story of the December wholesale trade report where a large 1.0 percent build is far outmatched by a 2.6 percent surge in sales. The results pull the stock-to-sales ratio down sharply to 1.29 from 1.31. Wholesale auto inventories rose 2.0 percent in December, a month that proved very strong for retail auto sales and was also very strong for wholesale sales where autos jumped 5.5 percent in the month. Watch for business inventories on Wednesday of next week’s calendar which will wind up the year-end inventory picture.

Interesting that dips in sales like we’ve experienced over the last couple of years previously happened only during recessions:

20902
This chart was updated Jan 13, and even with the drop to 1.29 reported today inventories remained elevated:

20903

Trump lashes out at Sen. John McCain again, this time for criticizing Yemen mission

The Arizona Republican, who was briefed on last month’s mission, told NBC News on Wednesday that he cannot call it a success “when you lose a $75 million airplane and, more importantly, an American life is lost.” In a series of tweets Thursday, Trump argued that McCain “talking about the success or failure of a mission” only “emboldens the enemy.”

20904

McCain’s office in a statement: “Senator McCain will continue to execute his oversight duties as Chairman of the Senate Armed Services Committee and support brave men and women serving our nation in uniform.”

McCain, who was a prisoner of war during the Vietnam War, came under attack by then-candidate Trump in July. “He’s not a war hero. He’s a war hero because he was captured. I like people who weren’t captured,” Trump said.

Chain store sales, Saudi output and pricing, Publication notice

More weak hard data:

20201

Highlights

Chain stores are reporting mostly lower sales rates in January than December, in line with Redbook data and hinting at possible trouble for the ex-auto ex-gas reading of the January retail sales report. Looking at the total retail sales report, unit auto sales proved very soft compared to December (data released yesterday) though gasoline stations likely got a January lift from a moderate increase in prices. Yet gasoline makes up only a small part of retail sales which on net, and despite very strong readings for consumer confidence, look to have underperformed during January.

Saudi output down, maybe due to a net drop in residual demand globally as new production came online:

20202
Looks like Saudi policy is now to push prices higher:

20203

‘Maximizing Currency Stability in a Market Economy’ that I co authored with Professor Damiano Silipo is now posted online. This could be the first time an ‘MMT’ author has been published in a ‘mainstream’ economics journal? The download costs $35- can’t say it’s worth anywhere near that much… ;)

We are pleased to inform you that the final corrections to your proofs have been made. Further corrections are no longer possible. Your article is now published online at:

http://authors.elsevier.com/sd/article/S0161893817300017

Trumped up expectations, Chicago PMI, Consumer sentiment, Redbook retail sales, Executive orders, GDP comment, Trump comments, Income and spending chart

Trumped up expectations vs ‘hard data’:

13101

13102

Highlights

January was a flat month for the Chicago PMI which could manage only 50.3, virtually at the breakeven 50.0 level that indications no change from the prior month. New orders have now joined backlog orders in contraction in what is a negative combination for future production and employment. Current production eased but is still solid though employment is clearly weakening, in contraction for a 3rd straight month. One special note is pressure on input costs which are at a 2-1/2 year high. Business spirits and consumer expectations may be high, but they have yet to give the Chicago economy much of a boost. Watch for the consumer confidence report later this morning at 10:00 a.m. ET.

13103
Trumped up expectations starting to cool:

13104

Highlights

Consumer confidence held strong and steady in January, at 111.8 for only a slight decrease from December’s 15-year high of 113.3 (revised). Details are positive including a noticeable decline in those saying jobs are hard to get right now, at 21.5 percent vs December’s 22.7 percent, combined with a solid rise in those who say jobs are plentiful, at 27.4 vs 26.0 percent.

But the outlook is less upbeat with more saying there will be fewer jobs 6 months from now and fewer saying there will be more. Confidence in income prospects is also down.

And there’s red flags in the details, including a nearly 2 percentage point drop in buying plans for autos. This suggests that auto demand, after several months of very strong sales, may have understandably flattened. Home sales have been less strong than auto sales, but here too buying plans are down sharply.

Back to the lows:

13105

Inventories and Low Deflator Boost Low GDP Estimate

By Rick Davis

Jan 29 (Econintersect) — The BEA’s “bottom line” (their “Real Final Sales of Domestic Product”, which excludes the growing inventories) recorded a sub 1% growth rate (+0.87%), down over 2% (-2.17%) from 3Q-2016.

Real annualized household disposable income was reported to have grown by $177 quarter-to-quarter, to an annualized $39,405 (in 2009 dollars). The household savings rate decreased by -0.2% to 5.6%.

For the fourth quarter the BEA assumed an effective annualized deflator of 2.12%. During the same quarter (October 2016 through December 2016) the inflation recorded by the Bureau of Labor Statistics (BLS) in their CPI-U index was 3.41%. Under estimating inflation results in correspondingly over optimistic growth rates, and if the BEA’s “nominal” data was deflated using CPI-U inflation information the headline growth number would have been much lower, at a +0.62% annualized growth rate.

Trump gives an inaccurate explanation of how pipelines are built and shipped

By Tom DiChristopher

Jan 30 (CNBC) — President Donald Trump on Monday gave an inaccurate explanation of how foreign-made pipes are made and shipped to the United States.
The president made the comments as part of his case to convince oil and gas pipeline makers to use U.S. materials and equipment rather than imported parts.

Speaking to a group of small business leaders, Trump described a process that “hurts the pipe” — suggesting that many miles of America’s pipelines contain substandard parts which presumably would have to be replaced. But he simultaneously indicated that he is not actually familiar with how pipelines are made, using a variation of “I imagine” three times and saying “I assume” as he explained the process.

“These are big pipes. Now, the only way I can imagine they [ship them] is they must have to cut them. Because they’re so big, I can’t imagine — they take up so much room — I can’t imagine you could put that much pipe on ships. It’s not enough. It’s not long enough,” he said.

So I assume they have to fabricate and cut, which hurts the pipe, by the way,” he said.

A spokesperson for the Association of Oil Pipe Lines said he had never heard of foreign pipe makers cutting segments into portions to send them overseas. Manufacturers create pipes in lengths that can be shipped rather than chopping up vast lengths of pipe.

TransCanada, the company behind the controversial Keystone XL pipeline, also told CNBC that pipes it buys from overseas are not cut into smaller segments before being shipped.

So it’s rule by executive orders and tweets supported by alternative facts:

How Islamophobes and “Alternative Facts” Shaped Trump’s Muslim Ban

And as previously discussed, looks like a weak dollar policy is in the works:

Obama

>Euro spikes after Trump’s trade adviser says Germany is using ‘grossly undervalued’ currency

Germany is using a “grossly undervalued” euro to gain advantage over the United States and its own European Union partners, Donald Trump’s top trade adviser told the Financial Times, echoing a sentiment he gave last week on CNBC.

Peter Navarro, the head of Trump’s new National Trade Council, told the newspaper that the euro was like an “implicit Deutsche Mark” whose low valuation gave Germany a competitive advantage over its main partners.

Navarro said that Germany was one of the main hurdles to a U.S.-EU trade deal and that talks over a Transatlantic Trade and Investment Partnership (TTIP) were dead, the newspaper reported.

As previously discussed, weak income tends to drag down spending:

As previously discussed, weak income tends to drag down spending:

13106