Mtg apps, Redbook retail sales, Industrial production, Housing market index, CPI, Euro zone and US sectoral balances

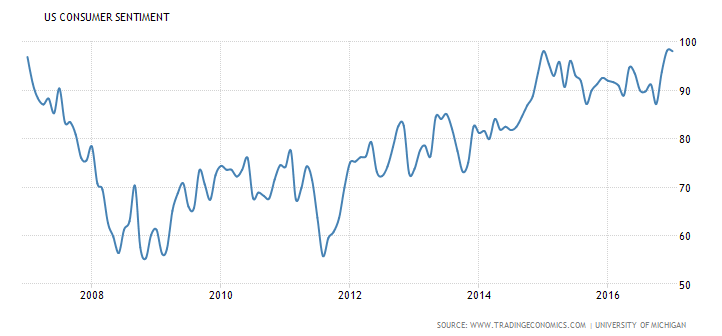
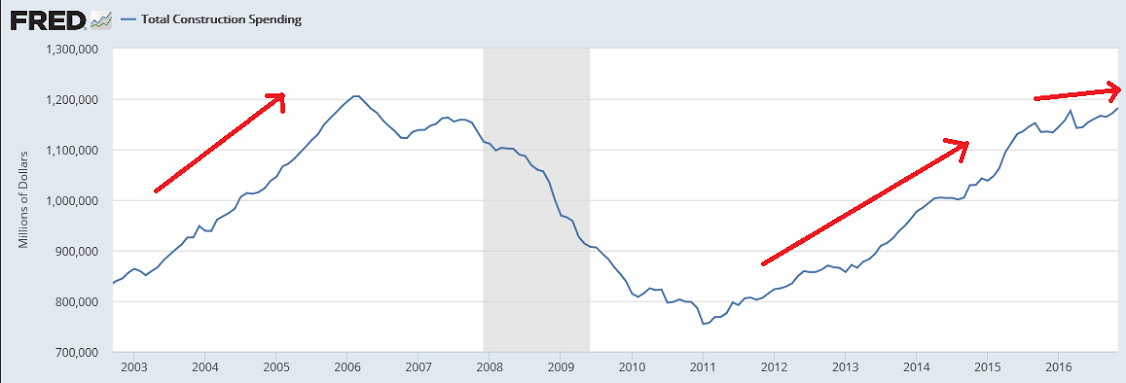
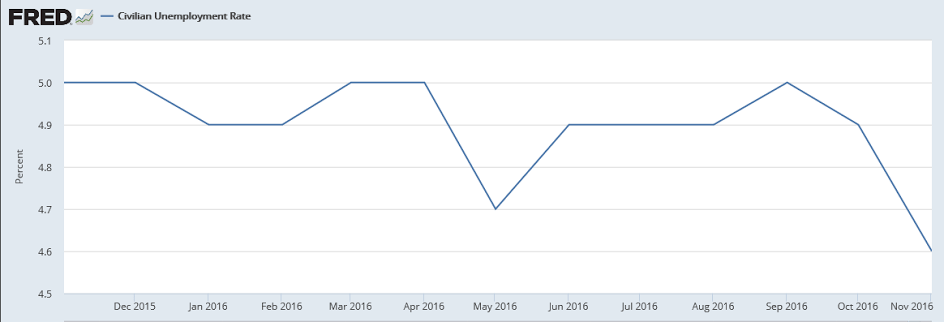
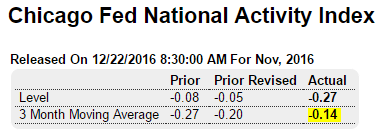
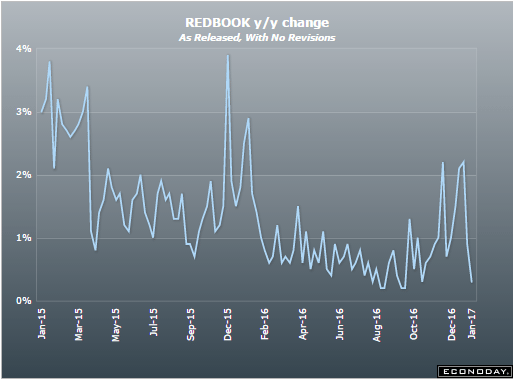
Back down again, in spite of Trumped up expectations, and going nowhere:

11801

Highlights

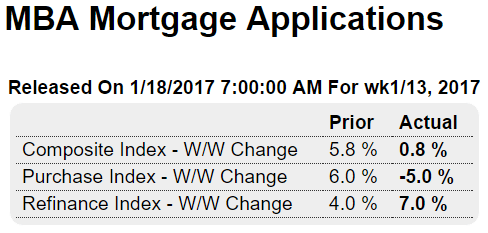
Purchase applications for home mortgages fell a seasonally adjusted 5.0 percent in the January 13 week, while applications for refinancing rose 7 percent. Unadjusted, the purchase index increased 25 percent compared to the previous week, however, taking the year-on-year comparison up 17 percentage points from the prior week to minus 1 percent, a strong recovery but still sharply below the 10-percent plus readings seen in October.

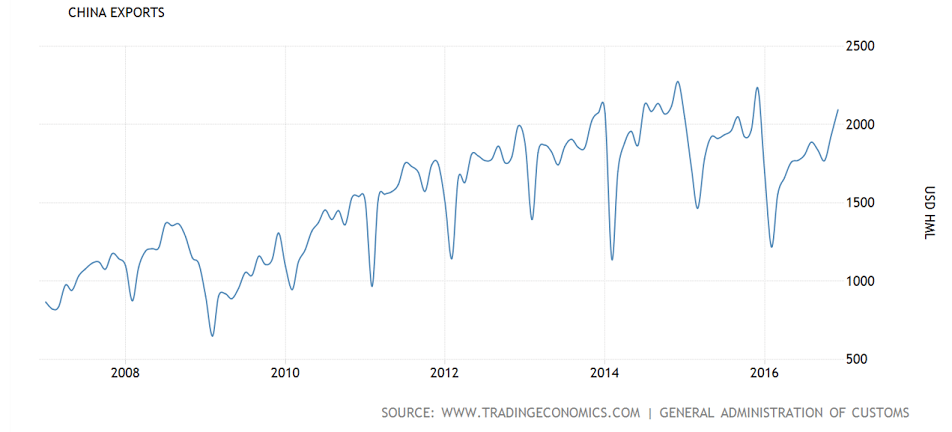
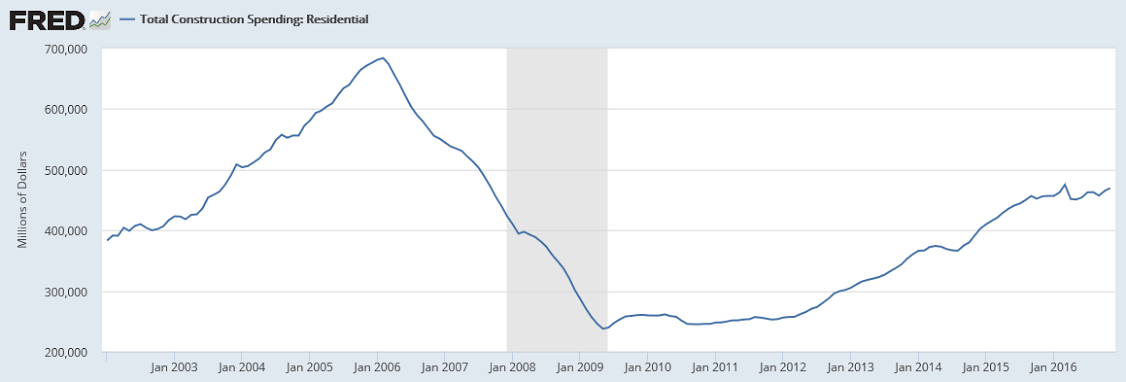
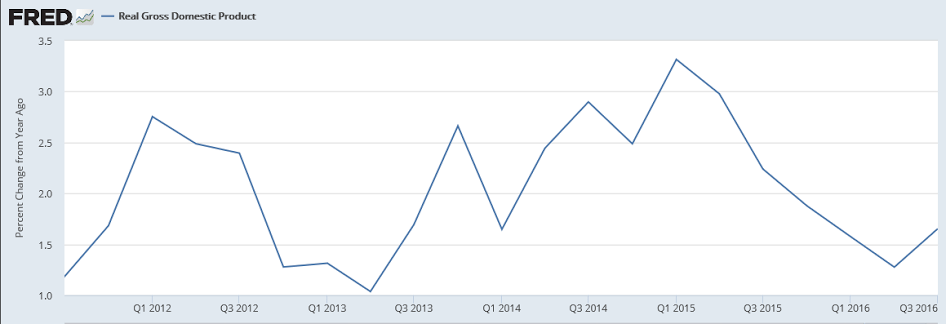
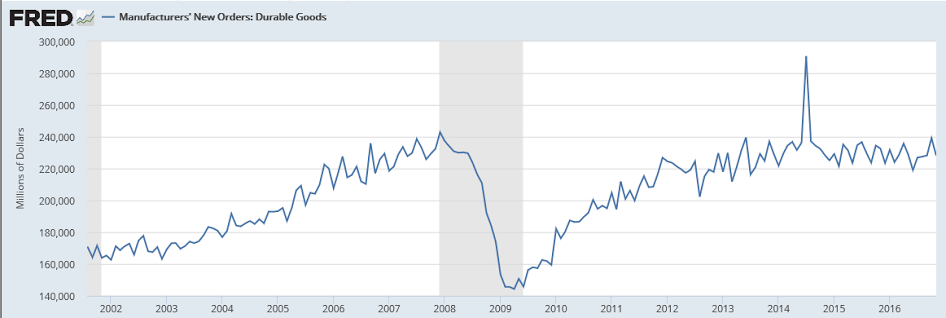
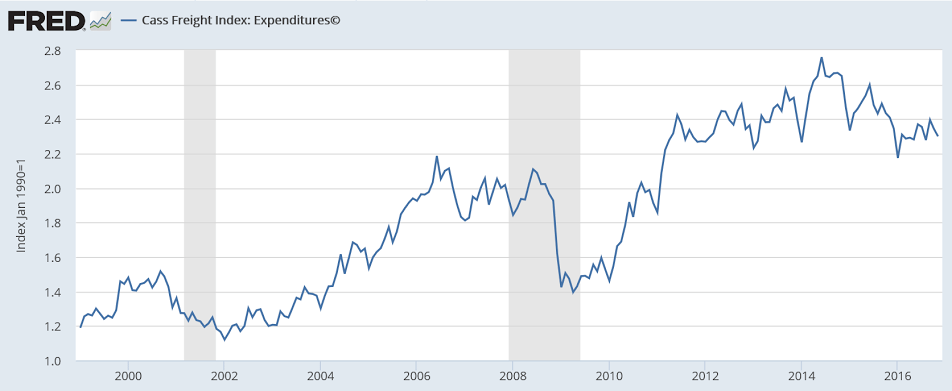
All the way back down, as previously discussed:

11802
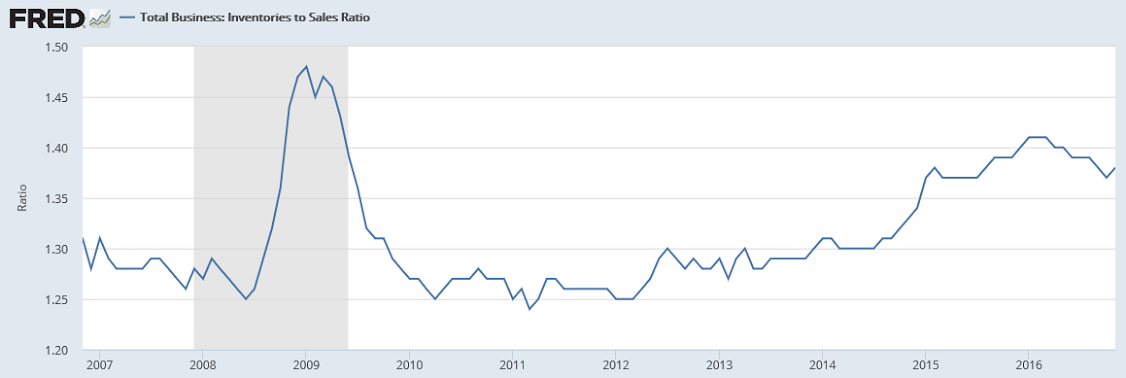
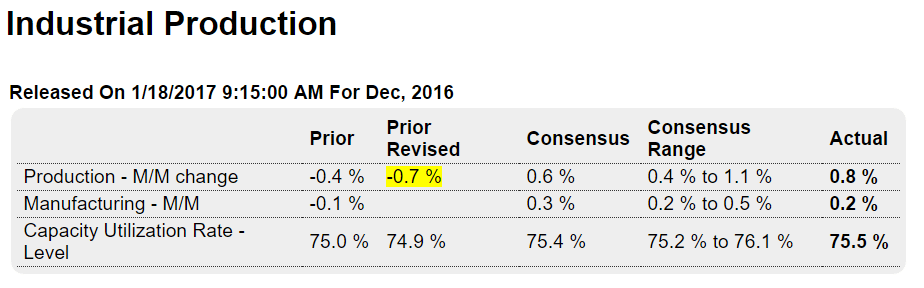
There are Trumped up expectations and undesired auto inventory building, and then there’s the reality of a very weak economy:

11803

Highlights

A weather-boosted 6.6 percent surge in utility output fed an outsized 0.8 percent gain in industrial production for December, one that follows however a downward revised and very sharp 0.7 percent decline in November. The monthly surge for utilities is the greatest since December 1989.

The big story in this report, however, is another soft reading for manufacturing production where volumes rose only 0.2 percent in the month. And if it wasn’t for a sharp 1.8 percent gain in the vehicle subcomponent, manufacturing would have shown no change at all.

Mining, which together with utilities and manufacturing, is a main component of the report, and production here was unchanged. Year-on-year rates show mining still at the rear at minus 2.8 percent with utilities at plus 6.2 and manufacturing no better than December’s monthly rate, only 0.2 percent higher.

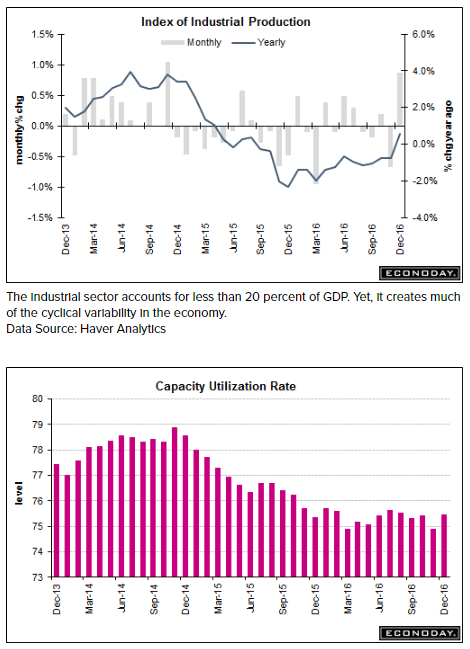
Overall capacity utilization rose a sizable 6 tenths to 75.5 percent with the manufacturing component, however, up only 1 tenth to a still subdued 74.8 percent rate in a reminder that excess capacity holds down goods inflation.

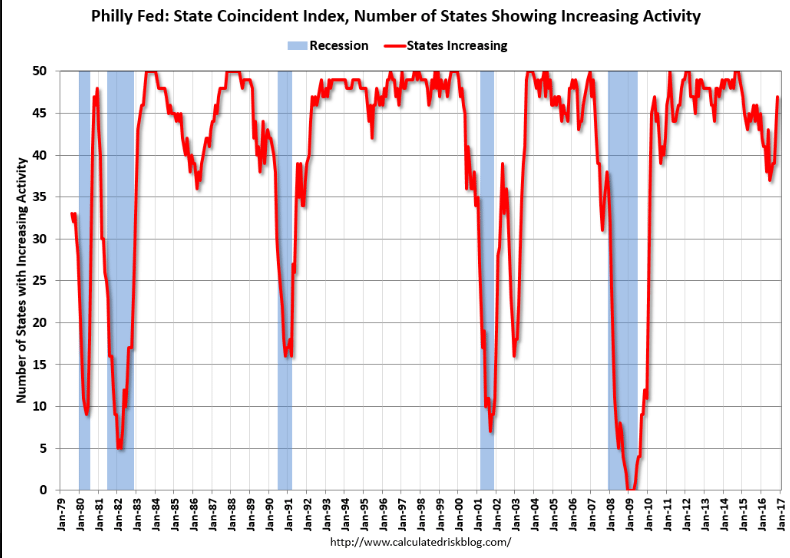
The factory sector, hit by weakness in exports and also energy equipment, struggled through 2016 and apparently could not manage a solid year-end rally. But yesterday’s Empire State did offer a positive advance look on January’s conditions with the next advance look on Thursday from the Philly Fed.

Industrial Production +0.8% and Capacity Utilization 75.5% in Dec. The monthly increase was driven by a jump in consumer durables, mostly autos, which outweighed the drop in home electronics, to fuel a 1.1% gain, after a 1.0% drop in November. The main impact came from changes in Utilities output, which rebounded 6.6% in December following the 4.6% decline for November as colder weather boosted output.

11804

11805
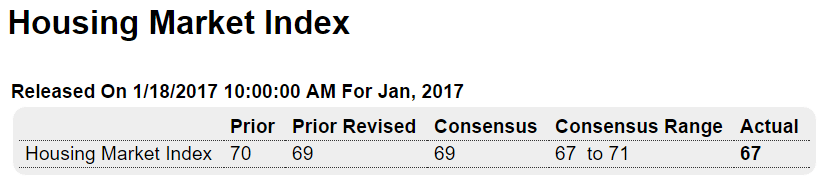
Trumped up expectations starting to fade:

11806

Highlights

Home builders are as confident as they have been since the sub-prime boom 10 years ago. The housing market index in January is 67, down just 2 points from a revised and cycle high of 69 in December.

All the components are strong but strength at the rear is the big story. Traffic held over 50, edging only 1 point lower to 51 for, along with December, the only plus-50 readings in 11 years. Traffic had been very low all cycle and this improvement is an indication of new demand for new homes.

Sales readings remain very high, at 72 for current sales and 76 for sales 6 months out. These readings hint at strength for tomorrow’s housing starts & permits report.

The West remains the favorite region for home builders with a 3-month average score of 79. The South follows at 67, the Midwest at 64, and the Northeast far back at 52 but coming out of sub-50 contraction.

The rise in mortgage rates isn’t denting any of the enthusiasm among home builders for what they see ahead as another strong year, perhaps an even stronger year.

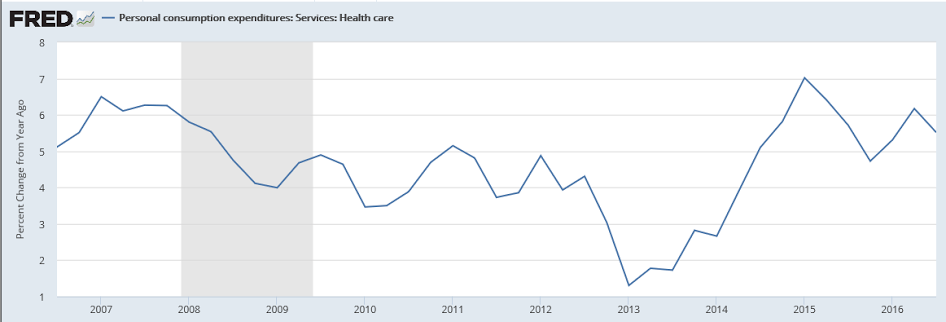
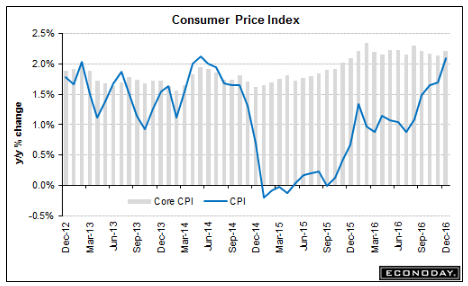
Currently running at about the Fed’s presumed target rate of 2% due to recent hikes in energy prices:
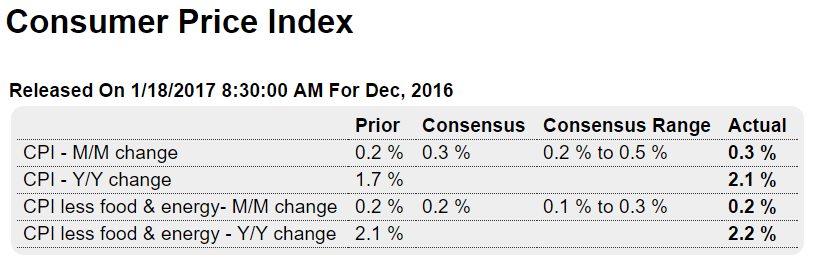
11807

Highlights

Energy prices are moving higher and are lifting the overall rate of consumer inflation, which now nearly matches the core rate (less food & energy). The CPI rose 0.3 percent in December to lift the year-on-year rate by 4 tenths to 2.1 percent. This yearly rate had been badly trailing the core rate for the past 2-1/2 years, since the oil price collapse in the summer of 2014. Now the overall rate compares with 2.2 percent for the core rate which rose a modest 0.2 percent in December.

11808
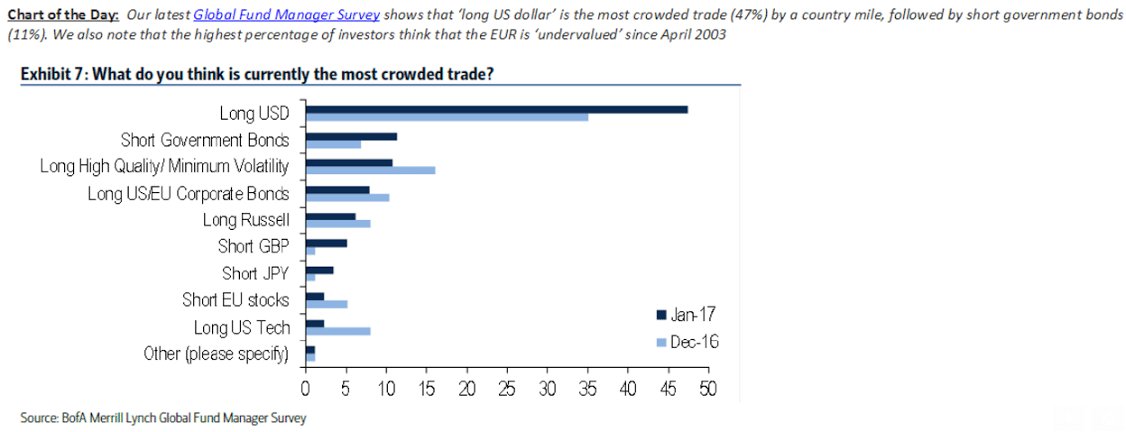
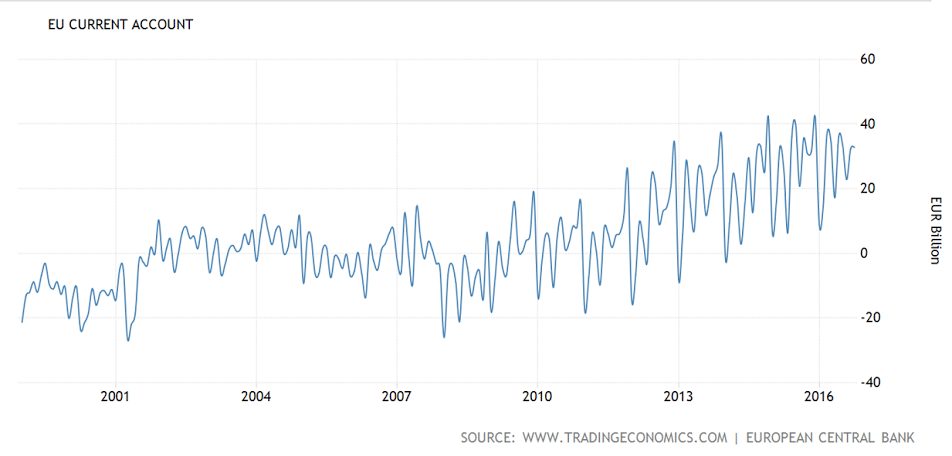
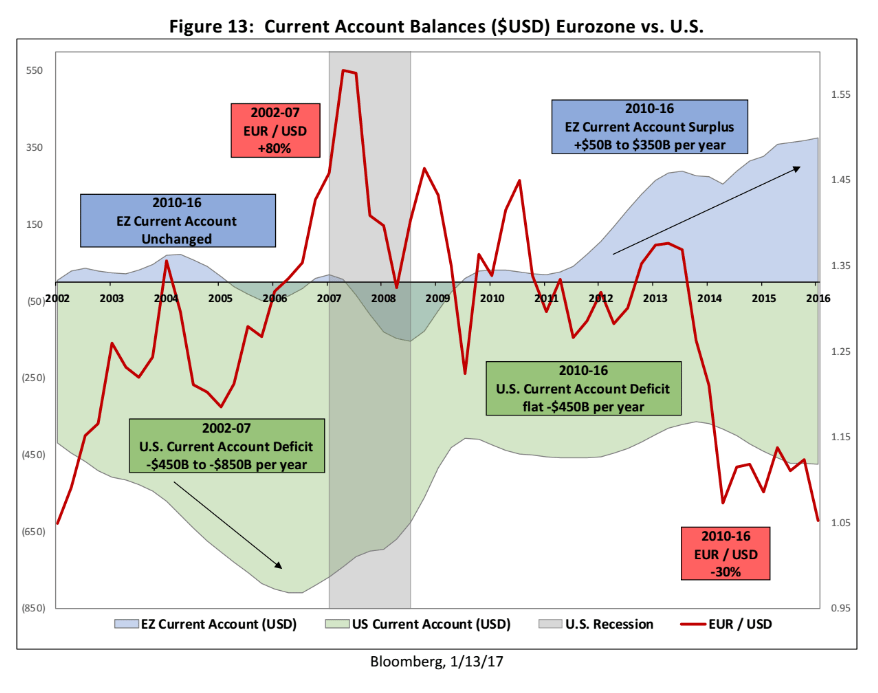
Porfolio managers have driven the euro down to levels that are supporting a large and growing current account surplus, while the US current account deficit has remained elevated even with the decline of oil prices that historically would have reduced the US current account deficit. The difference is due to the decline in domestic oil output and the rise of oil imports that followed the oil price declines.

As long as the current account surplus is sustained, the euro zone economy will have that much support as indicated by the Private Domestic Balance in green below. Likewise, the near 0 US Private Domestic Balance also in green, below, indicates that domestic sector will likely remain depressed.

Should, however, the portfolio shifting run its course, the trade flows will then firm the euro vs the $ until the trade flows reverse course:
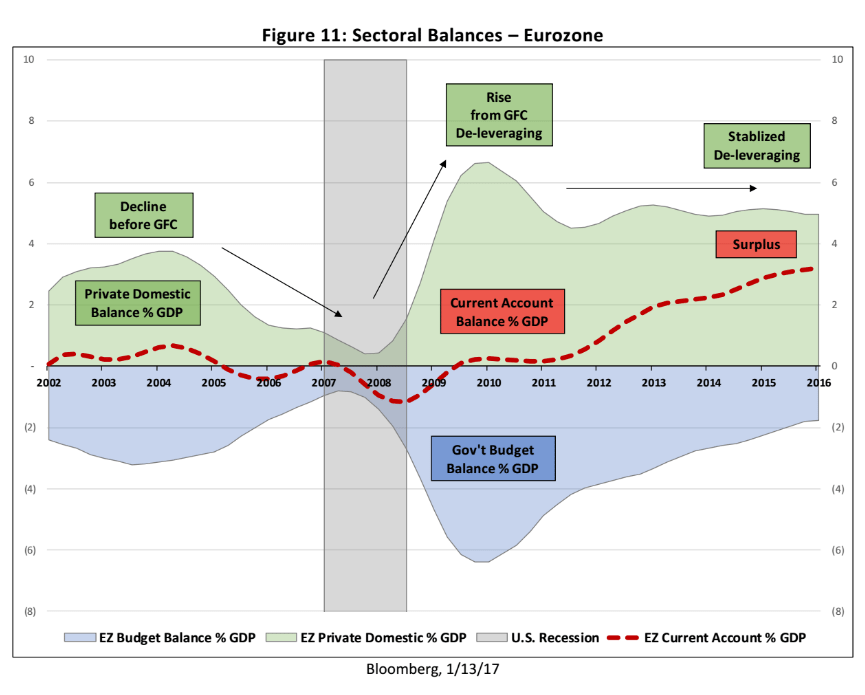
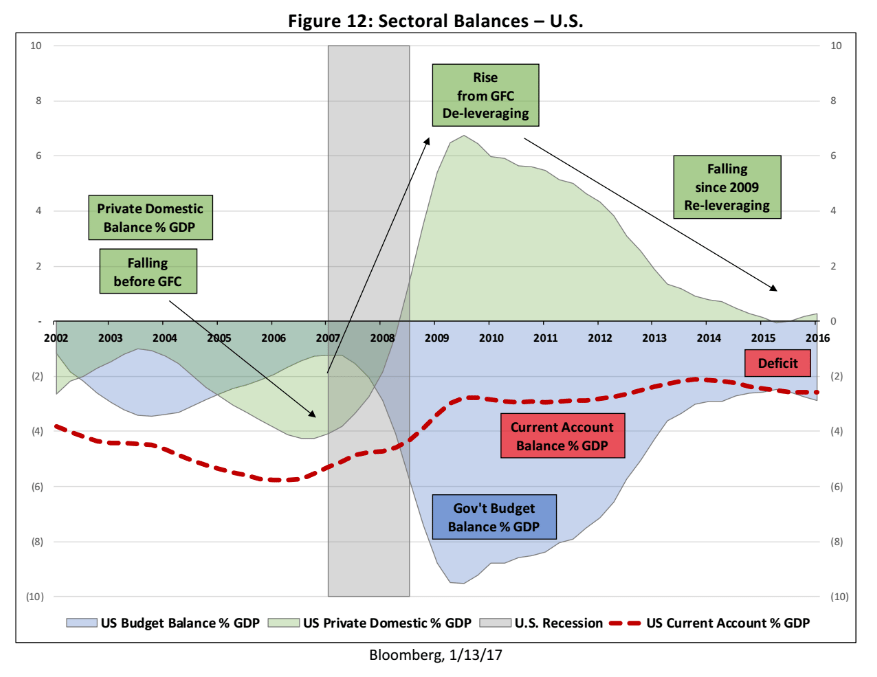
11809

11810

11811

(charts from epc)

11812

Retail sales, Business inventories, Consumer sentiment, China exports, German GDP

Less than expected and held up by vehicle sales which were about flat for the year and are unlikely to be any better than that in 2017, and therefore not contributing anything to growth:

11301

Highlights

Outside of cars, consumers weren’t in much of a spending mood this holiday season. Retail sales did post a very solid gain in December, up 0.6 percent, but without autos the gain falls to only 0.2 percent. And exclude gasoline as well, which isn’t really a common holiday gift, and sales come in dead flat at zero.

And gifts were on the light side this year based on department store sales which fell 0.6 percent in the month and also electronic & appliance stores where sales fell 0.5 percent. And in a clear sign of discretionary weakness, restaurant sales fell 0.8 percent for the largest monthly decline in a nearly year.

Vehicle sales, which jumped 2.4 percent in the month, pull the report to the upside as do gasoline sales which rose 2.0 percent. But retail sales excluding gasoline do show a very solid 0.5 percent vehicle-driven gain and underscore that this report, despite the softness in holiday categories, is still a solid plus for fourth-quarter GDP. And there are positives led once again by ecommerce as nonstore retailers saw a 1.3 percent monthly rise.

The bottom line is best characterized by apparel where sales were flat, posting no change for the second month in a row. Consumer spirits may be very high, and if this benefited retail sales in December it was mostly isolated to vehicles.

11302
More bad news on inventories which were already way too high:

11303

Highlights

Data on fourth-quarter inventories are looking heavy, up 0.7 percent in November in an offset to a revised 0.1 percent draw in October. Both retailers and wholesalers show large 1.0 percent builds in November with manufacturers at a 0.2 percent build. Given weakness in total sales, up only 0.1 percent, the stock-to-sales ratio rose 1 tenth in the month to 1.38.

11304
Still trumped up but moderating some:

11305

Post-election confidence readings have been very high but have not equated to the same proportional punch for consumer spending which, nevertheless, has been respectable. The report notes that partisanship is extreme right now with 44 percent of the sample citing the importance of government policies (whether positive or negative). The cycle average for this reference is 20 percent.

Exports from China declined by 6.1 percent from a year ago to USD 209.42 billion in December of 2016, following a revised 1.6 percent drop in the prior month while markets expected a 3.5 percent drop. Considering the full year of 2016, sales fell 7.7 percent, the second straight year of decline and the worst since the depths of the global crisis in 2009. In yuan-denominated terms, exports rose 0.6 percent from a year earlier, following a 5.9 percent rise in a month earlier. From January to December of the year, sales dropped by 2 percent.

11306
Improving global environment?

German GDP Grows at Fastest Rate in Five Years

By Nina Adams and Andrea Thomas

Jan 12 (WSJ) – Gross domestic product expanded 1.9% in 2016 in inflation-adjusted terms, the Destatis statistics body said on Thursday. This is the highest rate since 2011, beating the government’s own prediction of 1.8% growth. A statistician with Destatis said GDP probably expanded by around 0.5% in the fourth quarter from the third quarter. An official forecast is due Feb. 14. “The restraint seen in the third quarter has been overcome,” the economics ministry said in its monthly report on Thursday, pointing to solid industrial production and an improving global environment.

Interesting divergence?

11307

11308

Small business index, Redbook retail sales, Jolts, Consumer credit, Retail sales forecast

Still Trumped up expectations:

11001

Highlights

The small business optimism index soared 7.4 points in December to 105.8, the highest reading since December 2004. The outsized increase far exceeds expectations and follows a robust 3.5-point rise in November. NFIB said business owners who expect better economic conditions accounted for about half of the overall increase, with a net 50 percent of respondents expecting that the economy will improve, a 38 point leap up from November.

In a magnified repetition of the survey results for November, all but 2 of the 10 components posted gains. The two other optimism components making a big contribution to the index were higher real sales expectations, up 20 points to 31, and the view that now is a good time to expand, which was up 12 points to 23.

Capital outlays also figured prominently, with plans to increase capital spending jumping 5 points to 29 and 63 percent of respondents reporting outlays in December, 8 points more than in November. Even earnings trends were up 6 points, but remained in negative territory at minus 14.

Optimism was somewhat subdued on the jobs front, however, as plans of owners to increase employment rose just 1 point to 16 and current job openings registered a 2-point decline, albeit to a still strong 29. According to NFIB, the labor market is getting tighter, allowing workers to ask for better wages, but small business owners are not yet confident enough to raise prices to offset any increase in labor costs. Higher interest rates apparently accounted for the drop in the other declining component, expected credit conditions, which fell 2 points to minus 6.

11002
As previously discussed, looking like the spike is probably a one off event, same as last year:

11003
Whatever this is, looks like it’s already rolled over…

11004
Looks like the unsold inventory isn’t under control yet, especially autos where productions cuts are underway:

11005

Highlights

Wholesale inventories rose very sharply in November, up 1.0 percent compared to 0.9 percent in the advance report and a draw of 0.1 percent in October. The good news is that November’s build is centered in autos (+3.2 percent) where retail sales proved very strong in December. Sales at the wholesale level rose 0.4 percent which compared to the larger gain in inventories pulled up the stock-to-sales ratio to a less lean 1.32 from October’s 1.31. Excluding autos, however, the ratio held unchanged at 1.27.

Inventories were heavy going into the fourth quarter and though September proved stable, early indications on November inventories (which also include retail and manufacturing) are pointing to a big build. Whether this build will prove a problem for production and employment in the first quarter will depend on how strong consumer spending was during the holidays. Watch for December retail sales on Friday morning followed at midmorning by the business inventories report.

Production cutbacks building as US momentum slows

OEM discipline will be tested as sales growth slows. Already there are announcements of coming production cuts to manage inventory, writes Megan Lam

11006

Total sales (not adjusted for inflation) are still below 2014 levels:

11007

A bit stronger than expected but the year over year rate of growth continues to be trending lower even as the debt to income ratio increases, which could possibly mean consumers are borrowing more to pay monthly bills:

11008

Highlights

A large increase in revolving credit, one of the largest of the cycle, is likely a positive indication for holiday sales. Revolving credit jumped $11.0 billion in data for November to indicate that consumers are increasingly running up their credit-card debt. Non-revolving credit, up $13.5 billion, is also positive, here reflecting demand for vehicle financing and student loans (which are tracked in this report). Total credit rose $24.5 billion in the month, well above the consensus and also above Econoday’s high estimate. Retail sales for December, to be posted Friday, will offer definitive data on the strength of holiday spending.

11009

11010

Labor market conditions index

From the Fed’s research:

10901

Highlights

The economy may be at full employment but it’s not helping the labor market conditions index which remains flat. For the first negative score since May, December’s index comes in at minus 0.3. Based on this report, there may be more slack than suspected and less risk perhaps of wage inflation. Considered experimental, the labor market conditions index, published by the Federal Reserve, is a composite of 19 separate indicators.

10902

Payrolls, Factory orders, Foreign trade, Retailers, Boston rents

The year over year chart continues its 2 year deceleration unabated. No telling where it ends but the end will coincide with increased deficit spending, private or public:

10601

Highlights

Job growth may be the new economic policy but wage inflation may be the risk. Nonfarm payrolls rose a lower-than-expected 156,000 in December but, in an offset, revisions added a net 19,000 to the two prior months (November now at 204,000 and October at 135,000).

But the big story is another outsized 0.4 percent rise in average hourly earnings, the second such gain in three months. The year-on-year rate is now at 2.9 percent which is a cycle high. A 3 percent rate and above is widely seen as feeding overall inflation.

The unemployment rate is very low though it did tick up 1 tenth to 4.7 percent. Keeping the rate down is low labor participation, at 62.7 percent with the prior month revised down 1 tenth to 62.6 percent.

Sector payrolls show another sizable gain for trade & transportation, up 24,000, and a rare gain for manufacturing, up 17,000. Government added 12,000 jobs while a 15,000 rise for professional & business services is not only on the low side for this reading but includes a 16,000 decline in temporary help, a subcomponent that is especially sensitive to changes in labor demand.

There are hints of slowing job growth in this report but the wage pressure underscores the Federal Reserve’s expectations for three rate hikes during the year and raises the question whether the labor market, even before new stimulus under the incoming administration, is at an inflationary flashpoint. Other details include a lower-than-expected workweek, at 34.3 hours in December which is unchanged from a downwardly revised November.

10602

10603
Jobs no longer exceeding up with population growth:

10604
Fewer ‘demographic’ effects here, though the average age of this group has gone up some over time:

10605

10606
You can see that historically wage growth remains depressed, and in any case increased wages are more likely to reduce gross profit margins than to increases consumer prices:

10607
Decelerating back to recession levels:

10608

10609
And, as previously discussed, I expect this get a lot more negative:

10610

Highlights

The nation’s trade deficit widened sharply in November, to a higher-than-expected $45.2 billion and well up from a revised deficit of $42.4 billion in October. Exports fell 0.2 percent in November while imports rose 1.1 percent.

The import side shows a significant rise in oil imports, up nearly $1 billion in the month to $9.9 billion (reflecting both an increase in volume and price). Petroleum is a key element for industrial supplies where imports rose $2.3 billion. Other readings are little changed with capital goods imports ticking lower and underscoring the nation’s lack of investment in new equipment.

And capital goods lead the downtick in exports, down $1.8 billion to underscore the lack of global investment in new equipment. Exports of civilian aircraft, which are a subcomponent of capital goods, fell $1.3 billion in the month. Exports of cars and of food products also moved lower, offset by a petroleum-related rise in industrial supplies.

By country, the deficits with Canada (-$2.6 billion) and the EU (-$14.8 billion) both widened sharply while the deficits with China (-$30.5 billion) and Mexico (-$5.8 billion) both narrowed. The deficit with Japan (-$5.9 billion) was little changed.

Today’s report represents a downgrade for fourth-quarter GDP which more and more will depend on how strong consumer spending was during the holidays. Watch next Friday for the retail sales report and the first definitive indication on December consumer spending.

10611

Retail sector tanks as Macy’s and Kohl’s get crushed by weak holiday sales

By Fred Imbert

Jan 5 (CNBC) – Average Boston-area rent falls for the first time in almost 7 years

Construction spending, Manufacturing surveys, China

A bit of a bump up going into year end. Could be about expiring tax breaks as has happened in prior years:

10301

Highlights

Construction had been lagging through most of 2016 but, like the factory sector, appears to have picked up steam going into year-end. Spending rose 0.9 percent in November which just tops Econoday’s high estimate and is the best reading since June.

Residential spending rose 1.0 percent in the month on top of October’s 1.6 percent gain. The gain here is concentrated in single-family homes which offset a monthly dip for multi-family units which otherwise have been leading the residential sector. Home improvements added to the spending in November.

Non-residential spending was also strong, up 0.9 percent which most categories showing gains led by office construction and transportation construction. Public spending was also solid including a 3.1 percent monthly jump in Federal spending.

The breadth of gains is most impressive in this report, one that will give a lift to fourth-quarter GDP estimates.

These numbers aren’t inflation adjusted, so in real terms spending is still far below what it was. And during this cycle construction spending grew at a slow pace than prior cycles and seems to have flattened out:

10302

10303

10304
Public construction spending for all practical purposes has been flat nominally, and down when adjusted for inflation:

10305
Manufacturing surveys have stabilized at modest levels of growth as previously discussed, and possibly reflecting some post election euphoria:

Market PMI:

10306
ISM manufacturing

10307

Growth in China’s factories, services slows in December: official PMI

Dec 31 (Reuters) — The official PMI stood at 51.4 in December compared with 51.7 in November. Factory output slowed in December, with the sub-index hitting 53.3 compared with 53.9 the previous month. Total new orders were flat at 53.2, logging the same as in November, while new export orders fell to 50.1 from 50.3. Jobs were again lost, with the employment sub-index sitting at 48.9, compared to 49.2 in November. A sub-index for smaller firms fell, and performance for larger companies also worsened. The official non-manufacturing Purchasing Managers’ Index (PMI) stood at 54.5 in December, down from 54.7 in November.

China Caixin manufacturing PMI climbs to 51.9 in December, fastest improvement since January 2013

Jan 2 (CNBC) — In December, the Caixin PMI reading came in at 51.9, up from November’s 50.9. “A further rise in production at Chinese manufacturers supported the higher PMI reading in December. Notably, the rate of output growth accelerated to a 71-month high, with a number of panelists commenting on stronger underlying demand and new client wins,” the Caixin data statement said. “Data indicated that improved domestic demand was the key driver of new business growth, however, as new export sales were unchanged in December.”

Consumer confidence, Housing prices, Dallas and Richmond Fed manufacturing indexes, Moore comments

Apart from the Trumped up future expectations and the sagging retail sales reports, expectations remain elevated:

122701

Highlights

Consumer confidence shows no sign of slowing. The index is up 12.9 points since the November election in gains driven by older consumers. The level for December is 113.7 which is the highest reading since way back in August 2001.

But not all the indications from the December report point to monthly acceleration. December’s gain is centered in expectations, not in current conditions where the index, at 126.1, is still very strong but down from November’s 132.0. Within this, those saying that jobs are hard to get rose a noticeable 1.3 percentage points to 22.5 percent. This is a closely watched reading that will not heat up expectations for the December employment report.

The expectations index is very strong, up 11.1 points to 113.7. Those seeing more jobs in the months ahead jumped 4.9 points to 21.0 percent while the percentage of consumers expecting their incomes to increase rose 3.6 points to 21.0 percent. These readings are very solid.

But there is a curious negative in the report and that is a big drop in year-ahead inflation expectations, down 3 tenths to 4.5 percent which is very low for this reading. The better times that are coming will not be inflationary, at least according to the consumer.

No set of data have been showing the strength of the various consumer confidence readings. Yet this confidence didn’t help November consumer spending and how much it helped December’s spending has yet to be sorted.

Adjusted for inflation housing prices have yet to recover:

122702
Stabilizing at the lower levels as previously discussed. The surveys indicate the number of firms reporting higher or lower numbers than the prior month. They don’t indicate magnitude:

122703

Highlights
The Dallas Fed report joins other advance surveys pointing to year-end strength for the factory sector. December’s readings are broadly higher including a 5.0 point gain for the production index to 13.8 and a 5.3 point gain for general activity to 15.5. Importantly, new orders are up 8.7 points to 7.3 for the first positive score since August.

Held down by weak foreign demand and generally weak demand for new equipment, the factory sector did not enjoy a good year. But momentum has definitely been appearing in what is good news for 2017’s outlook.

122704
Up mainly on Trumped up expectations and even those didn’t extend to capital expenditures:

122705

Highlights

Manufacturing activity in the Fifth district expanded further in December, with the Richmond Fed Manufacturing Index rising 4 points to 8, after coming out of contraction in November with a strong 8-point increase. The biggest gains were registered in the backlog of orders, which rose a sharp 20 points from minus 12 to 8, followed by shipments and capacity utilization, with each rising 11 points, from 1 to 12 and minus 1 to 10, respectively. Vendor lead time lengthened in the month, moving the index component up 5 points to 9. On the employment front, hiring softened somewhat, with the number of employees falling to minus 1 from 5, but the average workweek increased, rising from 4 to 12 points, and wage increases were more widespread, with the index rising from 16 to 19 points.

Looking ahead, manufacturers were optimistic about future business conditions, anticipating robust improvement in nearly all of the conditions during the next six months. The index for expected shipments and new orders rose to a very strong 45 from 41 and to 47 from 38, respectively. Producers anticipate more increases in hiring (from 15 to 22) along with broader wage gains (from 26 to 36) and longer workweeks (from 6 to 14) in the next six months. The only expectations component that declined was capital expenditures, which fell from 27 points to 20.

Prices of raw materials rose at an annualized rate of 1.23 percent, slightly more than in the previous month, but the pace of growth in prices received slowed to a 0.22 percent annualized rate.

2016 has been even more volatile but seems to have been averaging around 0:

122706

Just watched Steve Moore, chief Trump transition team economic advisor, on Fox, talking about ‘trillion dollar deficits as far as the eye can see’ etc. and the need for fiscal responsibility, as he then tied it into supporting the new cabinet as people who knew how to cut waste and fraud and able to run things on paygo, etc. And last week he was talking about how the $trillion of infrastructure spending would be large private infrastructure like pipelines and refineries, etc. to be encouraged by govt. policy, rather than govt. spending per se.

Yes, private sector deficit spending for said capex ‘counts’ just as much as govt. deficit spending, but this kind of effort to create incentives won’t happen overnight, and won’t kick in overnight, and in any case $1 trillion over 10 years is only $100 billion per year or about .5% of GDP per year.

Also, their spending cuts ‘to pay for it all’ will be a force in the other direction. And their proposed tax cuts have far lower multiples than their proposed spending cuts.

GDP revision, Phily Fed state index

The Q3 blip up remains a soybean export, inventory building and healthcare premium story likely to be reversed in q4, as it all continues it’s general deceleration since oil capex peaked a couple of years ago:

GDP 3.5% in Q3. The acceleration in real GDP in the third quarter primarily reflected an upturn in private inventory investment, an acceleration in exports, a smaller decrease in state and local government spending, an upturn in federal government spending, and a smaller decrease in residential investment, that were partly offset by a smaller increase in personal consumption and an acceleration in imports.

122206a

Highlights

The third-quarter lived up to its early expectations, rising with each new revision to an inflation-adjusted 3.5 percent annualized rate for the best showing in two years. The consumer was the driving force in the quarter, spending at a 3.0 percent rate (up from 2.7 percent in the prior estimate) on top of the second quarter’s very strong 4.3 percent rate. Exports, benefiting from agricultural, were another positive as was nonresidential fixed investment which got an upgrade in the latest estimate to show a plus 1.4 percent annualized rate. Inventories also added to the quarter, but less so than prior estimates which is a positive for fourth-quarter production and employment. The GDP price index is unrevised at 1.4 percent. The fourth-quarter, held down by a reversal for exports and perhaps by less strength in consumer spending, isn’t quite tracking as strongly as the third quarter proved to be.

Healthcare premiums count as personal consumption expenditures and have gotten a one time boost from Obamacare and are unlikely to continue to grow at current rates:

122207
Healthcare costs are growing but not all that fast:

122208
Still working its way lower since the shale boom ended and oil capex collapsed about 2 years ago:

122209
The chart looks like we’ve managed to reverse a ‘death dive’ but I’d give it another month as it was influenced by the large drop in the unemployment rate that came about because the size of the labor force was reported to have dropped by that much:

The coincident indexes combine four state-level indicators to summarize current economic conditions in a single statistic. The four state-level variables in each coincident index are nonfarm payroll employment, average hours worked in manufacturing, the unemployment rate, and wage and salary disbursements deflated by the consumer price index (U.S. city average). The trend for each state’s index is set to the trend of its gross domestic product (GDP), so long-term growth in the state’s index matches long-term growth in its GDP.
Read more at http://www.calculatedriskblog.com/2016/12/philly-fed-state-coincident-indexes.html#R1M9We6R5D4zziYl.99

122210

122211

Auto production, Durable goods orders, Personal income and spending, Chicago Fed

As previously discussed- sales are slowing and inventory is too high:

U.S. Car Makers Idle Plants Amid Oversupply Concerns

By Mike Colias Adrienne Roberts and Christina Rogers

Dec 21 (WSJ) — Detroit auto makers are pulling back on first-quarter production in response to a cooling in retail demand and a shift in consumer tastes, a speed bump for an industry that has laid the foundation for U.S. economic expansion in recent years.

All three domestic car companies this week said they have scheduled down time at some of their factories for as much as three weeks in January. Auto makers typically idle assembly plants for a week or two around the holidays—but shutting factories for multiple weeks in January is unusual. Auto makers produced 3.6% more vehicles in North America last month than November 2015, according to researcher WardsAuto.com.

Bad:

122201

Highlights

Defense came to the rescue of November’s durable goods report though core capital goods orders are another positive. Durable goods fell 4.6 percent in November but were down an even sharper 6.6 percent excluding defense. When including defense and excluding transportation (commercial aircraft and vehicles), orders rose a better-than-expected 0.5 percent.

Orders for core capital goods (nondefense ex-aicraft) rose a very solid 0.9 percent though the gain is offset slightly by a 2 tenths downward revision to October where the gain is now only 0.2 percent. Shipments of core capital goods, reflecting prior weakness in orders, show only modest life, also at 0.2 percent.

Turning back to defense, orders for defense aircraft doubled in the month, up 103 percent. Orders for defense capital goods, which include aircraft, rose 29 percent. But outside of defense, non-aircraft components show strength including communications equipment (up 6.7 percent), primary metals (up 2.3 percent), machinery (up 1.3 percent), and vehicles (up 0.8 percent).

Total shipments inched 0.1 percent forward in November with inventories also up 0.1 percent to keep the inventory-to-shipments ratio stable at 1.64. A negative in the report is a 0.2 percent dip in unfilled orders following a 0.8 percent rise in October which looks very much like an outlier.

This report is known for its volatility which for November is highlighted by aircraft, both defense and commercial for opposite reasons. In sum, year-end momentum for the factory sector appears to be in place, suggesting a better finish to what has been a flat year.

Even not adjusted for inflation at best it’s gone flat:

122202
As the chart shows, the decline in real disposable personal income continues uninterrupted:

122203

Highlights

November may have been a cycle high for confidence but it actually proved a weak month for the consumer. Personal income was unchanged in November as the wages & salaries component dipped into the negative column at minus 0.1 percent. Consumer spending rose 0.2 percent and reflected specific weakness in vehicles. Not helped by the weakness in income, the consumer had to dip into savings during the month where the rate fell 2 tenths to 5.5 percent.

Price data are very flat, unchanged for both the PCE and PCE core (less food & energy) with the year-on-year rate at 1.4 percent for the PCE and at 1.6 percent for the core. And in a comparison that doesn’t point to accelerating inflation pressures, the year-on-year rate for the core fell 2 tenths to 1.6 percent..

Two months into the fourth quarter, consumer spending is running at a plus 2.0 percent annualized pace, well down from the 3.0 percent rate of the third-quarter (see GDP report earlier this morning).

But to put the report in context, the wages & salaries component had been showing outsized strength in recent months as had vehicle sales. So one month of weakness shouldn’t be a surprise. But the inflation readings are clearly a concern for Fed policy makers who want to see pressures building.

122204

122205

Highlights

Business and consumer confidence may have jumped but November proved to be a weak month for the economy based on the national activity index which fell to minus 0.27 from a revised minus 0.05 in October. The industrial sector proved weak, falling to minus 0.20 from October’s minus 0.01. Part of this decline reflects warm weather and less utility output but also reflects slippage in manufacturing production. Personal consumption & housing were also weak, at minus 0.10 vs minus 0.03 and reflecting weakness in retail spending and dips for housing starts & permits. Employment was a small positive in the month, at plus 0.2 vs October’s 0.1, with sales/orders/inventories at plus 0.01 vs minus 0.02.

Euro Area current account, Cass freight index, NY Fed

This is persistent, strong euro medicine that ‘absorbs’ the portfolio selling that’s been going on for over 2 years. And the lack of inflation and tight fiscal policy tell me it will persist until currencies adjust sufficiently to shift the balance:

Euro Area Current Account

Eurozone’s current account surplus rose to €32.8 billion in October 2016 from €30.9 billion in the same month a year earlier. The services surplus widened to €8.2 billion (from €2.4 billion a year earlier) and the primary income surplus increased to €8.8 billion (from €4.6 billion). Meanwhile, the goods surplus narrowed to €27.0 billion (from €33.7 billion in the previous year) and the secondary income deficit went up to €11.2 billion (from €9.8 billion). If adjusted for seasonal factors, the current account surplus rose to €28.4 billion compared to €24 billion in October 2015.

122001
Another indicator that shows the US could have already gone into recession:

122002

GDP forecast revised lower:

December 16, 2016: Highlights

  • The FRBNY Staff Nowcast stands at 1.8% for 2016:Q4 and 1.7% for 2017:Q1.
  • This week’s news had a negative effect on the nowcast, pushing down the Q4 and Q1 measures by about 0.7 percentage point each.
  • The largest negative contributions came from capacity utilization and industrial production data as well as housing data, which were only partly offset by a positive contribution from survey data.
  • Border Adjustability: The House Republican Blueprint proposes to convert the corporate income tax into a destination-based cash flow taxation system that would ‘border adjust’ by not taxing revenues from exports and disallowing deductions for the cost of imports. The economic effects of such a policy are similar to an export subsidy combined with an import tariff of equal size.