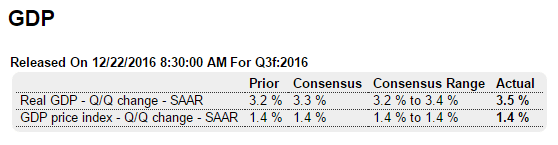
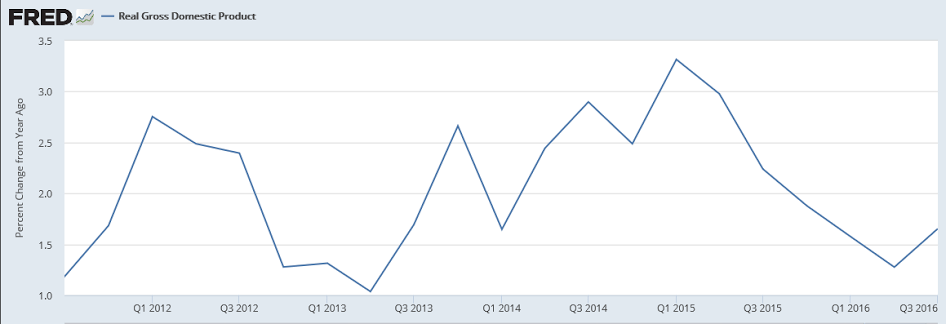
The Q3 blip up remains a soybean export, inventory building and healthcare premium story likely to be reversed in q4, as it all continues it’s general deceleration since oil capex peaked a couple of years ago:
GDP 3.5% in Q3. The acceleration in real GDP in the third quarter primarily reflected an upturn in private inventory investment, an acceleration in exports, a smaller decrease in state and local government spending, an upturn in federal government spending, and a smaller decrease in residential investment, that were partly offset by a smaller increase in personal consumption and an acceleration in imports.
Highlights
The third-quarter lived up to its early expectations, rising with each new revision to an inflation-adjusted 3.5 percent annualized rate for the best showing in two years. The consumer was the driving force in the quarter, spending at a 3.0 percent rate (up from 2.7 percent in the prior estimate) on top of the second quarter’s very strong 4.3 percent rate. Exports, benefiting from agricultural, were another positive as was nonresidential fixed investment which got an upgrade in the latest estimate to show a plus 1.4 percent annualized rate. Inventories also added to the quarter, but less so than prior estimates which is a positive for fourth-quarter production and employment. The GDP price index is unrevised at 1.4 percent. The fourth-quarter, held down by a reversal for exports and perhaps by less strength in consumer spending, isn’t quite tracking as strongly as the third quarter proved to be.
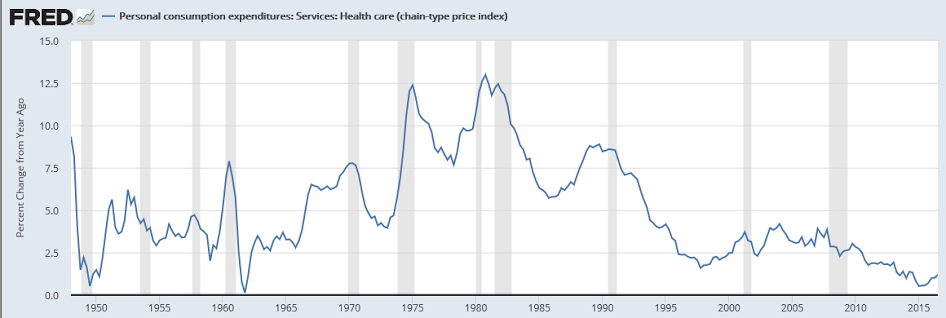
Healthcare premiums count as personal consumption expenditures and have gotten a one time boost from Obamacare and are unlikely to continue to grow at current rates:
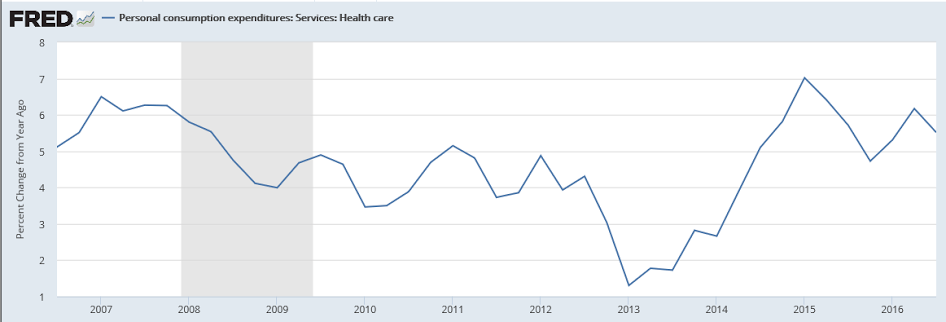
Healthcare costs are growing but not all that fast:
Still working its way lower since the shale boom ended and oil capex collapsed about 2 years ago:
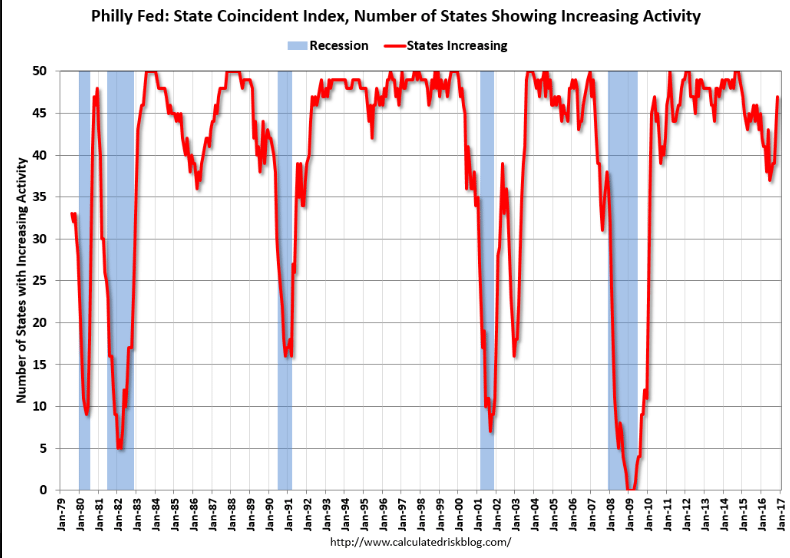
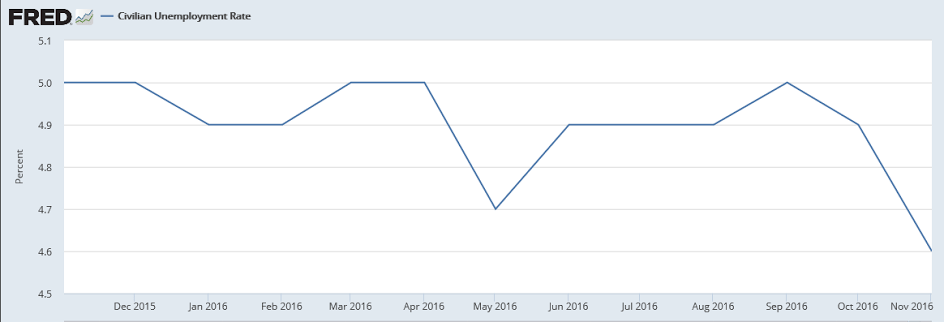
The chart looks like we’ve managed to reverse a ‘death dive’ but I’d give it another month as it was influenced by the large drop in the unemployment rate that came about because the size of the labor force was reported to have dropped by that much:
The coincident indexes combine four state-level indicators to summarize current economic conditions in a single statistic. The four state-level variables in each coincident index are nonfarm payroll employment, average hours worked in manufacturing, the unemployment rate, and wage and salary disbursements deflated by the consumer price index (U.S. city average). The trend for each state’s index is set to the trend of its gross domestic product (GDP), so long-term growth in the state’s index matches long-term growth in its GDP.
Read more at http://www.calculatedriskblog.com/2016/12/philly-fed-state-coincident-indexes.html#R1M9We6R5D4zziYl.99