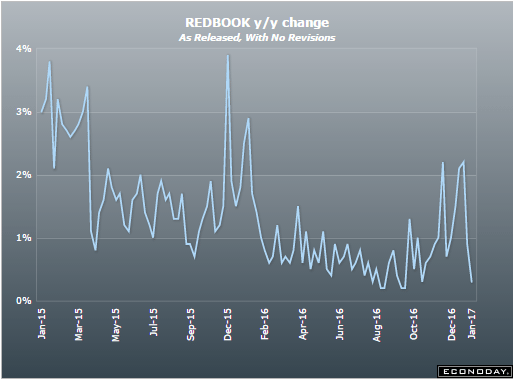
Back down again, in spite of Trumped up expectations, and going nowhere:
Highlights
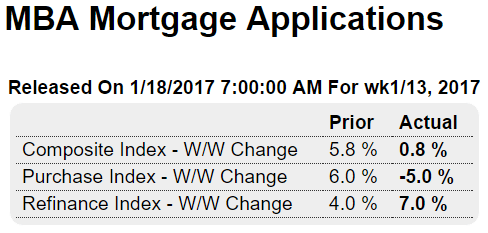
Purchase applications for home mortgages fell a seasonally adjusted 5.0 percent in the January 13 week, while applications for refinancing rose 7 percent. Unadjusted, the purchase index increased 25 percent compared to the previous week, however, taking the year-on-year comparison up 17 percentage points from the prior week to minus 1 percent, a strong recovery but still sharply below the 10-percent plus readings seen in October.
All the way back down, as previously discussed:
There are Trumped up expectations and undesired auto inventory building, and then there’s the reality of a very weak economy:

Highlights
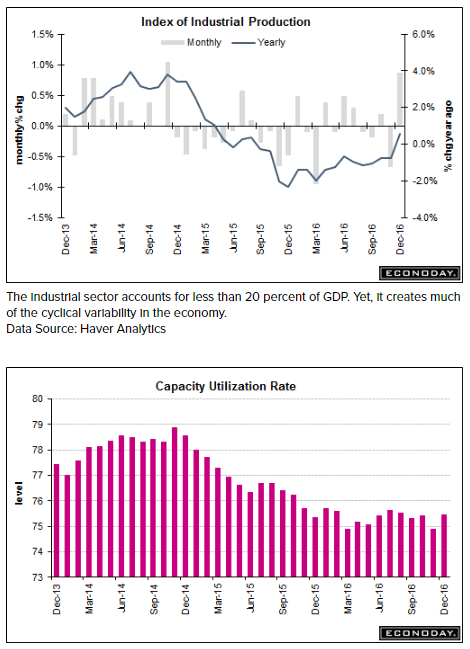
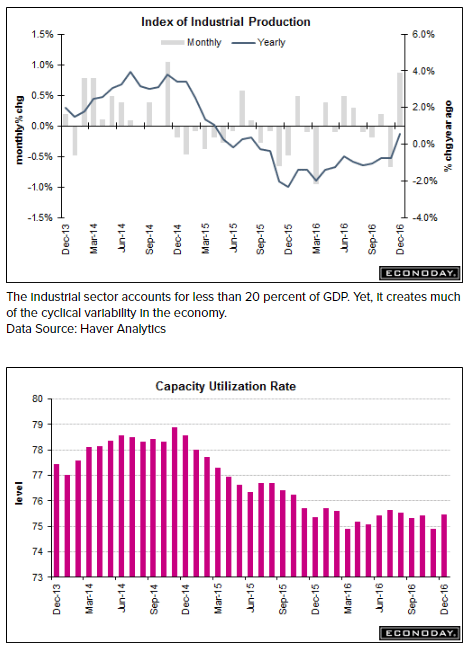
A weather-boosted 6.6 percent surge in utility output fed an outsized 0.8 percent gain in industrial production for December, one that follows however a downward revised and very sharp 0.7 percent decline in November. The monthly surge for utilities is the greatest since December 1989.
The big story in this report, however, is another soft reading for manufacturing production where volumes rose only 0.2 percent in the month. And if it wasn’t for a sharp 1.8 percent gain in the vehicle subcomponent, manufacturing would have shown no change at all.
Mining, which together with utilities and manufacturing, is a main component of the report, and production here was unchanged. Year-on-year rates show mining still at the rear at minus 2.8 percent with utilities at plus 6.2 and manufacturing no better than December’s monthly rate, only 0.2 percent higher.
Overall capacity utilization rose a sizable 6 tenths to 75.5 percent with the manufacturing component, however, up only 1 tenth to a still subdued 74.8 percent rate in a reminder that excess capacity holds down goods inflation.
The factory sector, hit by weakness in exports and also energy equipment, struggled through 2016 and apparently could not manage a solid year-end rally. But yesterday’s Empire State did offer a positive advance look on January’s conditions with the next advance look on Thursday from the Philly Fed.
Industrial Production +0.8% and Capacity Utilization 75.5% in Dec. The monthly increase was driven by a jump in consumer durables, mostly autos, which outweighed the drop in home electronics, to fuel a 1.1% gain, after a 1.0% drop in November. The main impact came from changes in Utilities output, which rebounded 6.6% in December following the 4.6% decline for November as colder weather boosted output.
Trumped up expectations starting to fade:

Highlights
Home builders are as confident as they have been since the sub-prime boom 10 years ago. The housing market index in January is 67, down just 2 points from a revised and cycle high of 69 in December.
All the components are strong but strength at the rear is the big story. Traffic held over 50, edging only 1 point lower to 51 for, along with December, the only plus-50 readings in 11 years. Traffic had been very low all cycle and this improvement is an indication of new demand for new homes.
Sales readings remain very high, at 72 for current sales and 76 for sales 6 months out. These readings hint at strength for tomorrow’s housing starts & permits report.
The West remains the favorite region for home builders with a 3-month average score of 79. The South follows at 67, the Midwest at 64, and the Northeast far back at 52 but coming out of sub-50 contraction.
The rise in mortgage rates isn’t denting any of the enthusiasm among home builders for what they see ahead as another strong year, perhaps an even stronger year.
Currently running at about the Fed’s presumed target rate of 2% due to recent hikes in energy prices:

Highlights
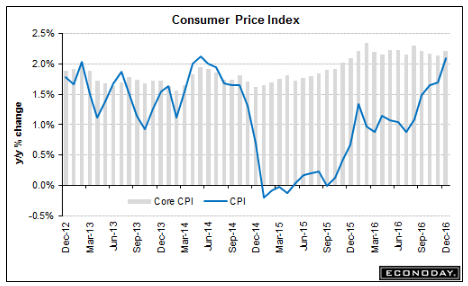
Energy prices are moving higher and are lifting the overall rate of consumer inflation, which now nearly matches the core rate (less food & energy). The CPI rose 0.3 percent in December to lift the year-on-year rate by 4 tenths to 2.1 percent. This yearly rate had been badly trailing the core rate for the past 2-1/2 years, since the oil price collapse in the summer of 2014. Now the overall rate compares with 2.2 percent for the core rate which rose a modest 0.2 percent in December.
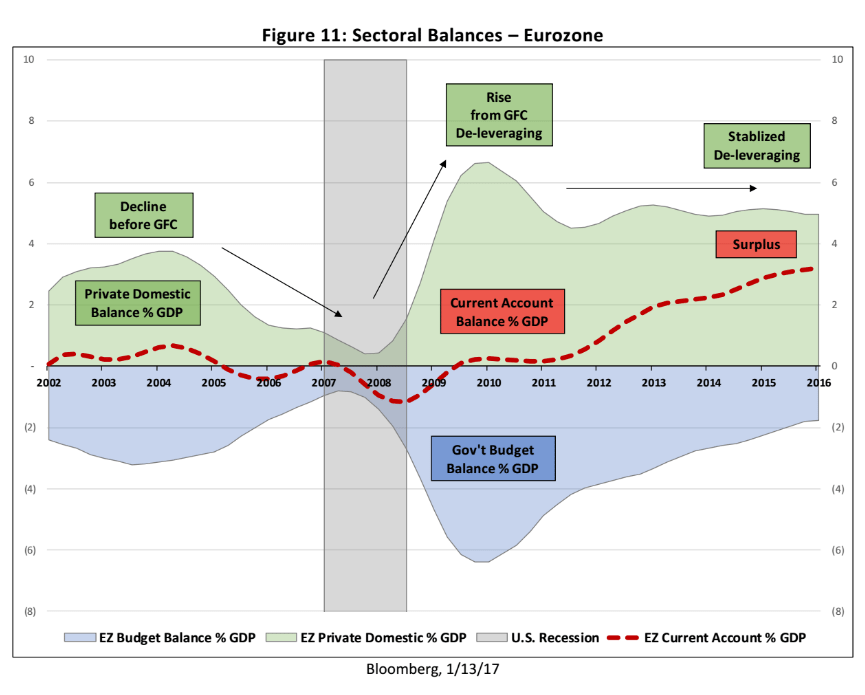
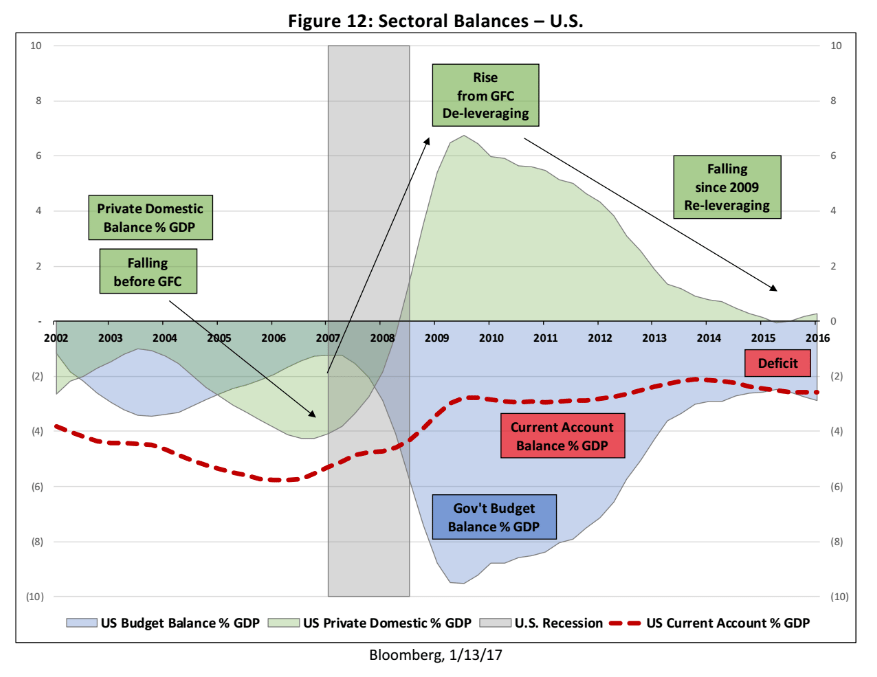
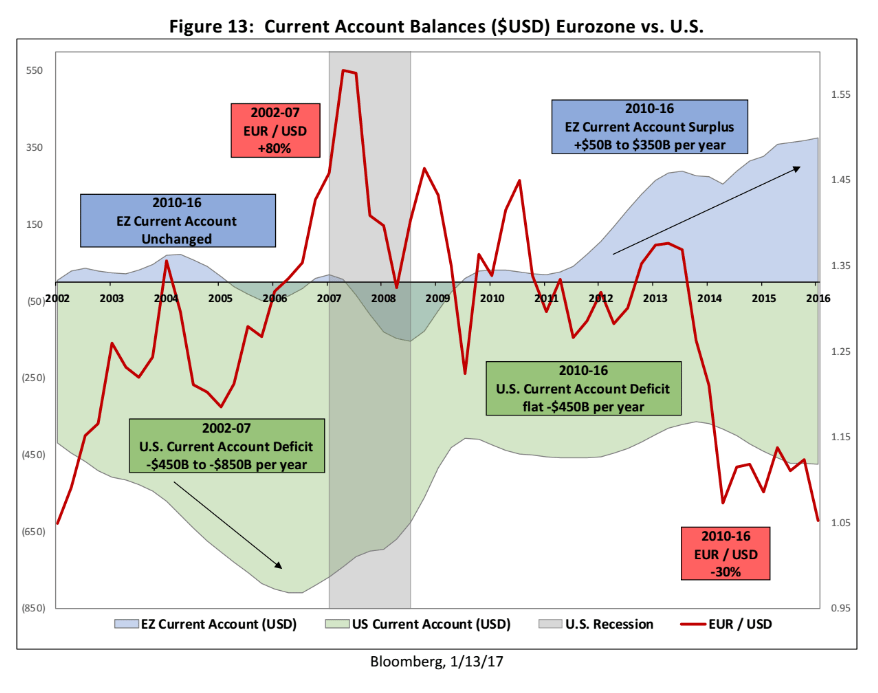
Porfolio managers have driven the euro down to levels that are supporting a large and growing current account surplus, while the US current account deficit has remained elevated even with the decline of oil prices that historically would have reduced the US current account deficit. The difference is due to the decline in domestic oil output and the rise of oil imports that followed the oil price declines.
As long as the current account surplus is sustained, the euro zone economy will have that much support as indicated by the Private Domestic Balance in green below. Likewise, the near 0 US Private Domestic Balance also in green, below, indicates that domestic sector will likely remain depressed.
Should, however, the portfolio shifting run its course, the trade flows will then firm the euro vs the $ until the trade flows reverse course:
(charts from epc)
