Employment report, Atlanta Fed GDP forecast

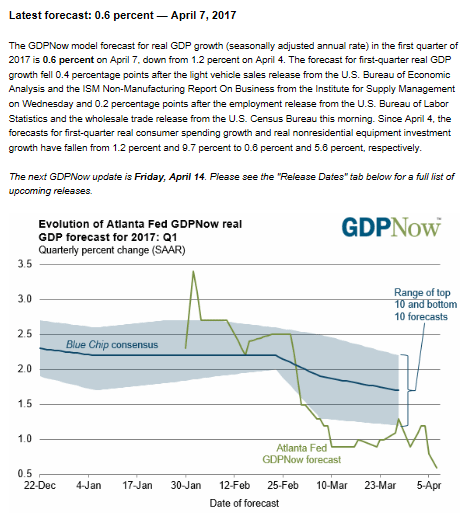
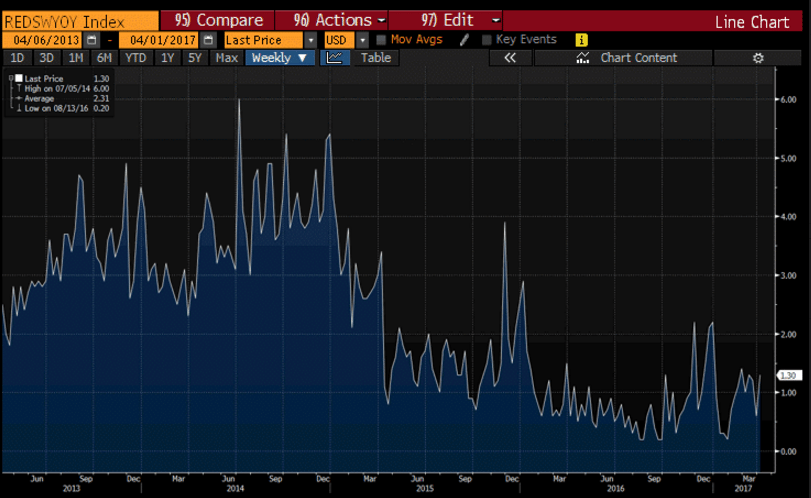
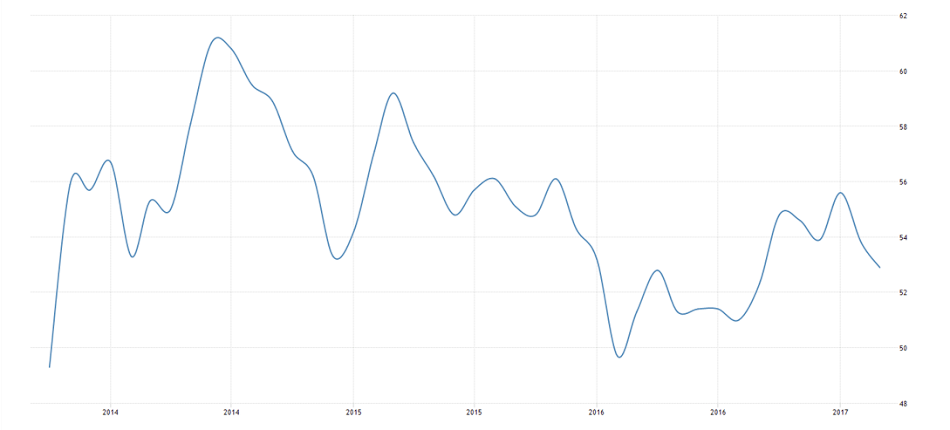
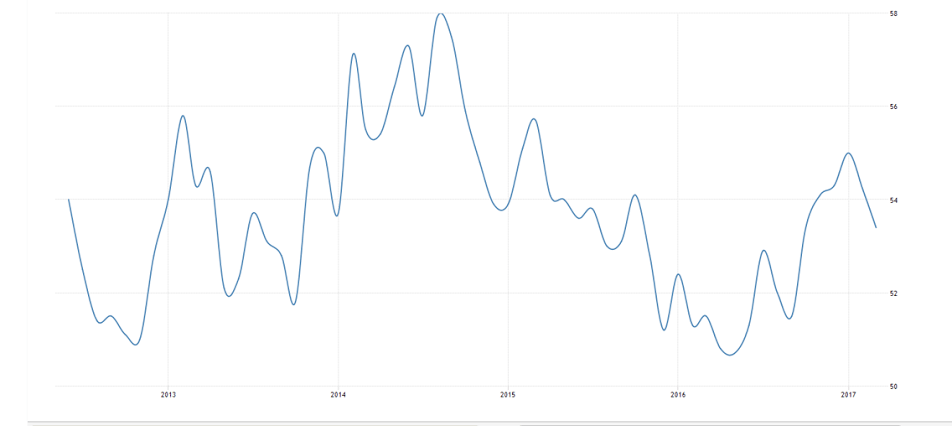
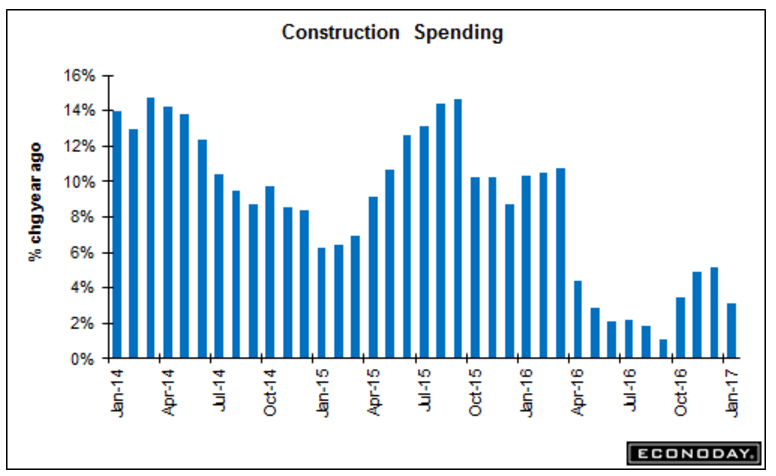
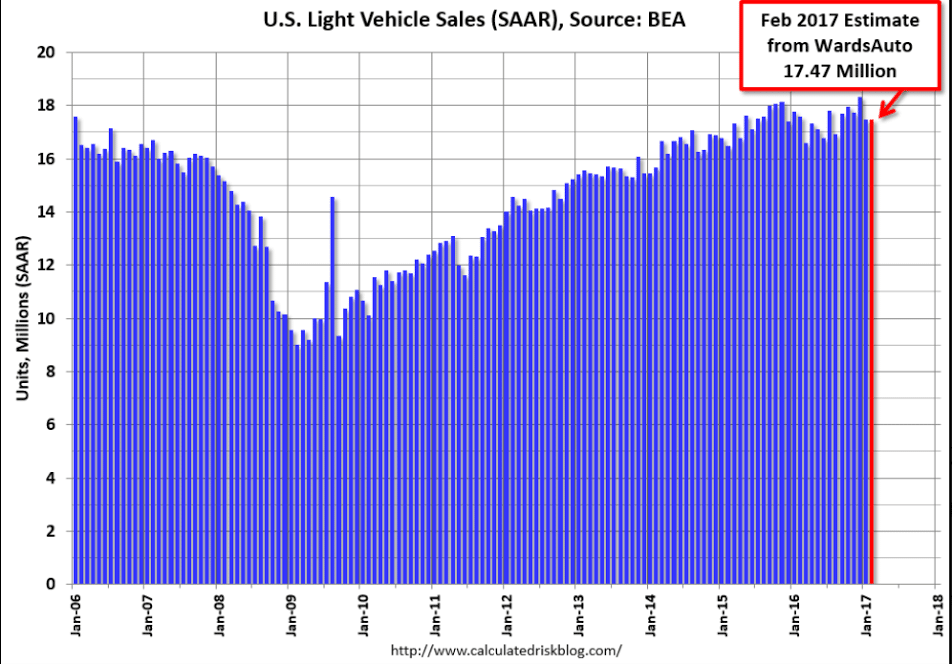
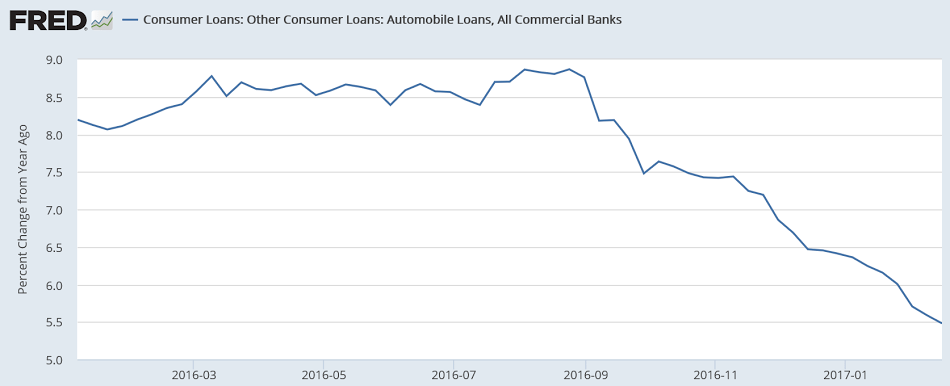
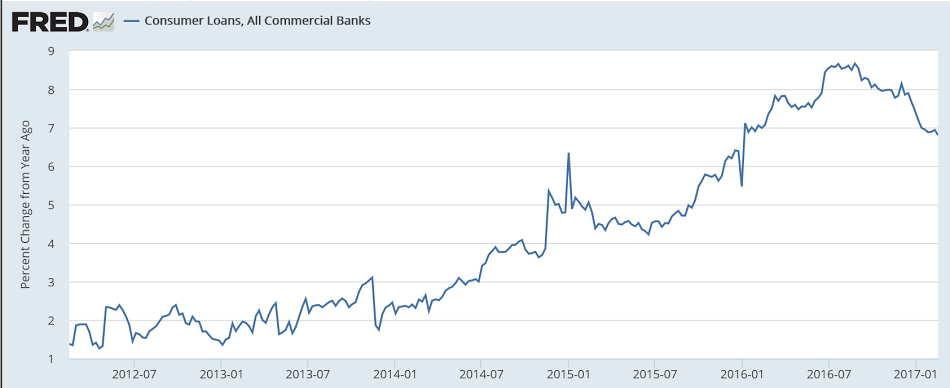
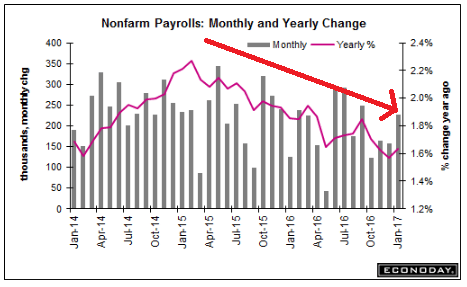
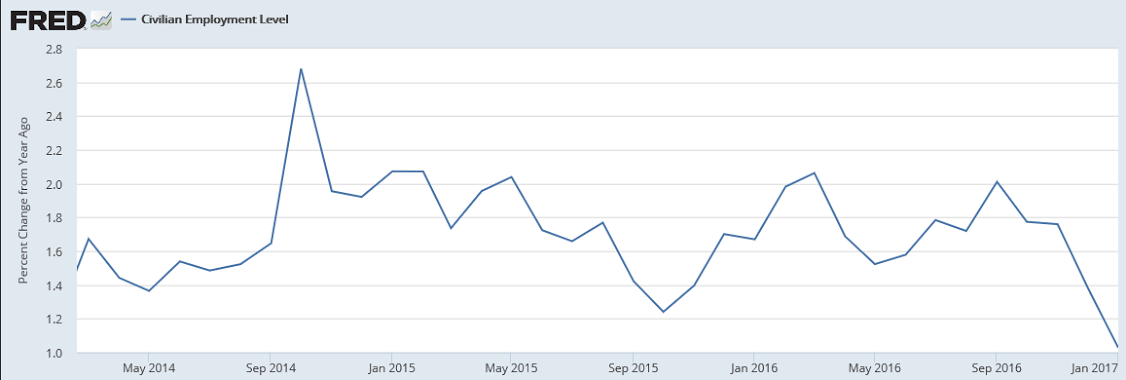
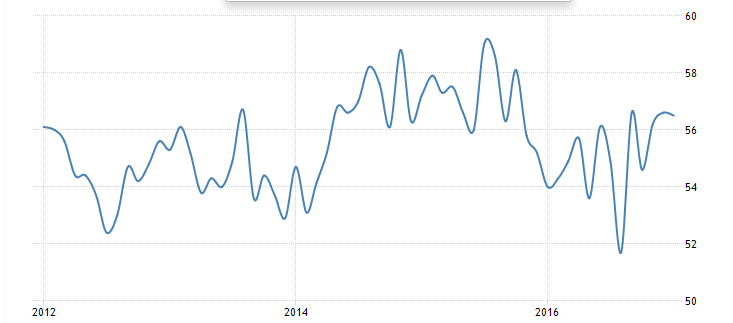
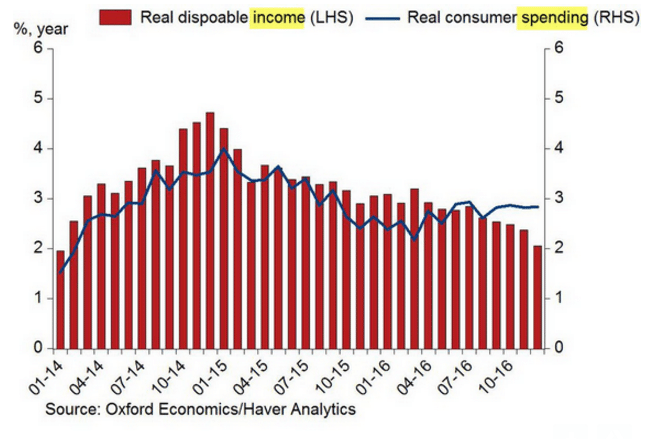
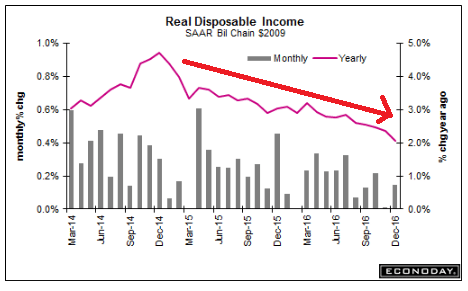
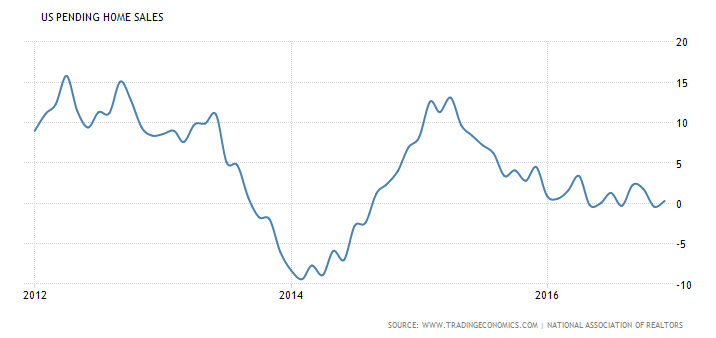
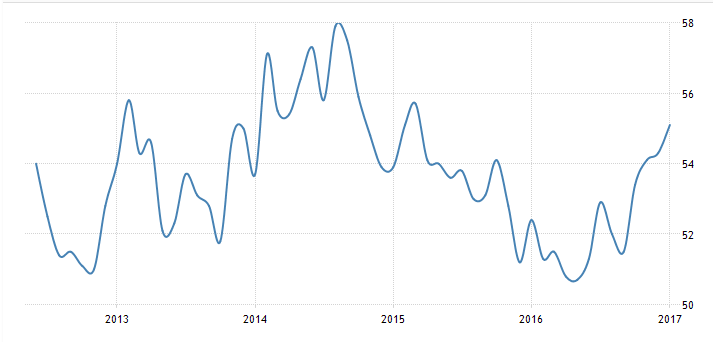
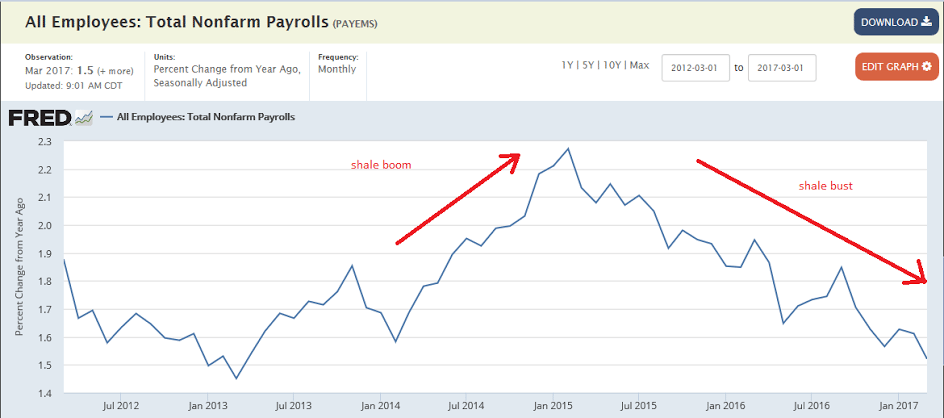
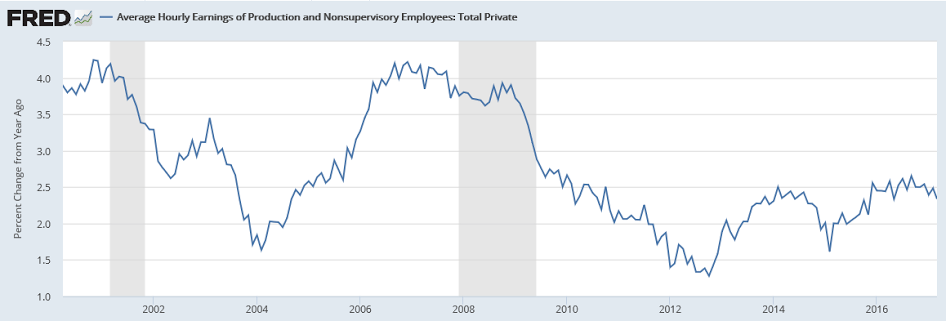
Looking at the chart today’s number looks entirely consistent with the near linear rate of deceleration since oil capex collapsed about 2 1/2 years ago or so. And so far there’s no reason to expect the trend to reverse:
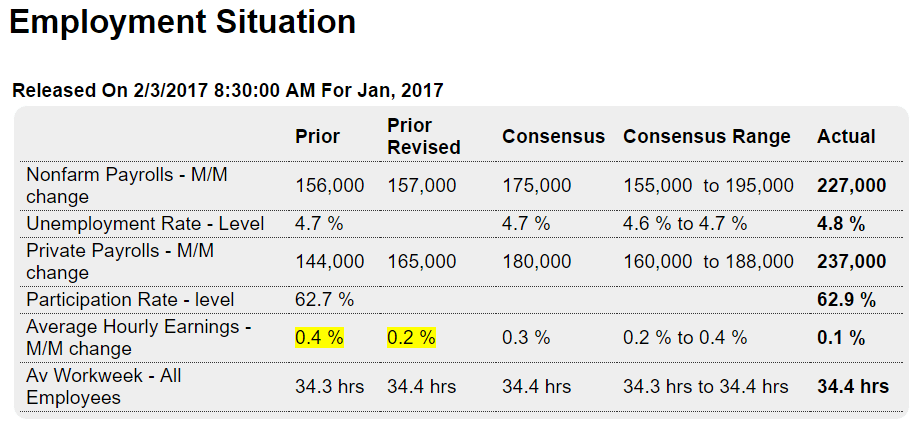
Highlights

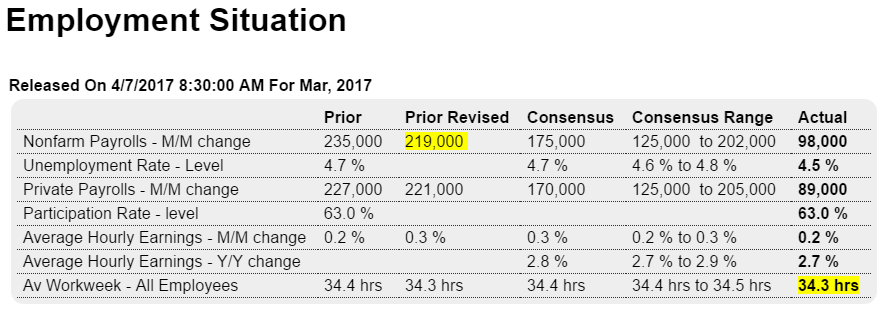
Throw ADP out, it was the weather in March! Or at least the Category 3 storm that swept the Northeast may explain a much weaker-than-expected 98,000 increase in March nonfarm payrolls. This compares with Econoday’s consensus for 175,000 and a low estimate of 125,000. It is also the weakest reading since May last year.

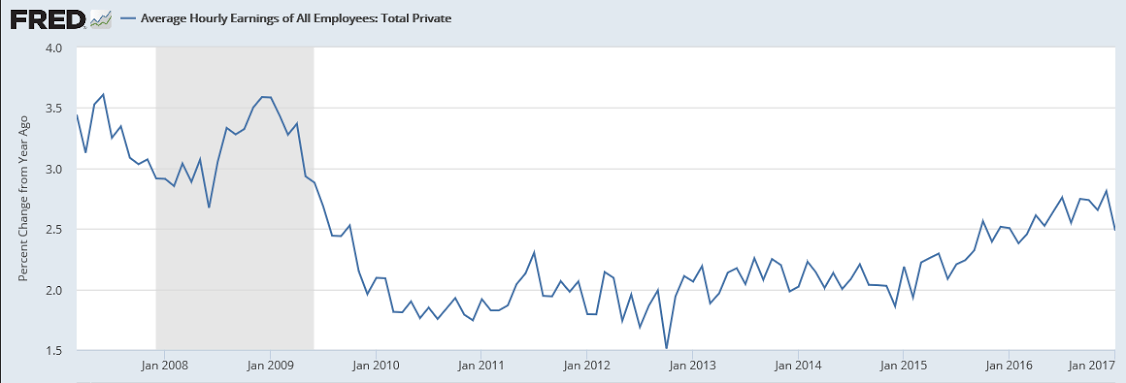
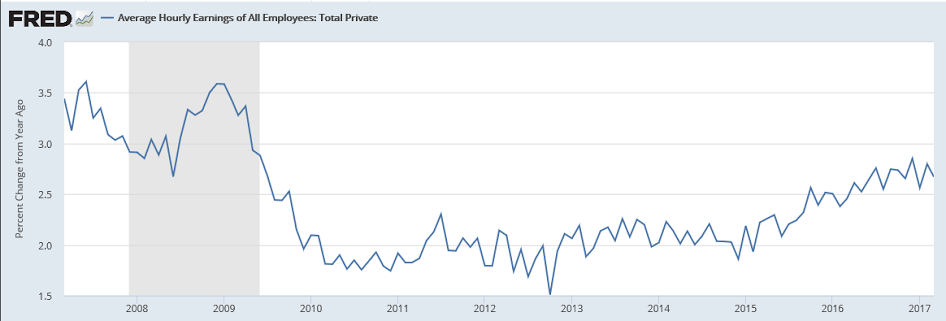
But there is one standout sign of strength in the report and that’s the unemployment rate which fell a very sharp 2 tenths to 4.5 percent as the number of unemployed fell by 326,000 to 7.2 million. This is the lowest unemployment rate since the height of the last expansion in April 2007 and it raises the issue of wage inflation which, however, has yet to build. Average hourly earnings rose only 0.2 percent in the month for a year-on-year rate that, at 2.7 percent, is down 1 tenth in the month and further away from the 3 percent line.

Lack of highly skilled entrants is one likely reason for the lack of wage traction but soft economic conditions may also be a factor. The average workweek slipped in the month to 34.3 hours from 34.4 hours with manufacturing declining to 40.6 hours from 40.8. For manufacturing production, this points to an abrupt and unexpected interruption and one perhaps consistent with heavy weather.

Retail trade fell 30,000 in March following February’s 31,000 decline. Trade & transportation payrolls decreased 27,000 following a 16,000 decline. But both manufacturing and mining show useful gains, at 11,000 each and with construction, despite the weather, still rising 6,000. The government hiring freeze put in place in late January didn’t hurt March payrolls for this reading which rose 9,000.

The big storm hit during the sample week of the employment report and apparently delayed new hiring, or at least that will be today’s takeaway. Though there may be a snapback ahead for April payrolls and despite the drop in the number of unemployed, the report does tone down the economic outlook and hints at March trouble for consumer spending which had already opened the year off softly.

Not looking good/who would’ve thought?
;)

Trade, Manufacturing new orders, Redbook retail sales, GDP forecasts

The trade deficit was a bit less than expected, all due to lower imports. The question is whether this means there were more domestic purchases, whether this is an indicator of lower aggregate demand:

Highlights
In favorable news for first-quarter GDP, the nation’s trade gap hit Econoday’s low estimate in February at $43.6 billion and reflects a 1.8 percent drop in imports but only a 0.2 percent gain for exports. The goods deficit came in at $65.0 billion vs $64.8 billion in last week’s advance report for February with the services surplus at $21.4 billion which is unchanged from January (there’s no advance report for services).

It has been strong demand for foreign consumer goods and foreign autos that has been a central factor behind the nation’s trade deficits, and the news in February, at least in terms of the deficit, is positive. Imports of consumer goods fell to $49.0 billion which is down a very sizable $3.1 billion from January. Imports of autos fell to $29.1 billion for a $2.7 billion decline. Offsets include a $1.3 billion rise in crude oil imports to $13.0 billion reflecting a sharp monthly increase of $1.31 per barrel to $45.25 along with a slight rise in volumes per day.

The export side, despite the fractional gain, is less constructive. Exports of capital goods extended their flat-to-lower trend, down $0.6 billion in the month to $42.9 billion and due entirely to civilian aircraft. Exports of foods fell $0.7 billion with nonmonetary gold down $0.4 billion. A positive is a $0.7 billion upturn in exports of consumer goods to $17.1 billion. Less positive, however, is a flat month for services where exports were unchanged at $64.4 billion with the surplus relative to $43.0 billion in service imports once again flat at $21.4 billion. Services have been the strength of the U.S. trade picture.

Country data show the trade deficit with China at $23 billion in the month followed by the EU at $9.4 billion, Mexico at $5.8 billion, Japan at $4.7 billion and Canada at $2.1 billion. Note that country data are unadjusted which makes monthly comparisons difficult especially given February’s 28 days vs January’s 31 days.

For GDP these data are very positive and help offset not only January’s large trade deficit but also what’s evolving as a weak quarter for domestic consumer spending. For cross-border trade, this report is not upbeat, showing less demand for goods and services both here and abroad.

Manufacturing continues to drift sideways, as per the chart. And note that vehicle sales have softened considerably since this report and aircraft orders are likely to revert:

Highlights

Factory orders may not be showing the same kind of strength that the ISM and Philly Fed are pointing to but they are solid, hitting Econoday’s February consensus at a 1.0 percent gain. Adding to the strength is a 3-tenth upward revision to January which is now at a 1.5 percent gain that follows December’s unrevised 1.3 percent rise.

The durables side of the report, up 1.8 percent in the month (revised from 1.7 percent in last week’s advance data), reflects a second month of outsized strength for aircraft, at a 56 percent monthly gain vs January’s 188 percent surge. But durables also include a respectable 0.3 percent gain for vehicles. Nondurable goods inched 0.2 percent higher on strength in chemicals (there is no advance report for nondurables).

But there are cracks that perhaps betray the strength and one is a second weak month for core capital goods (nondefense ex-aircraft) where orders fell 0.1 percent after managing only a 0.2 percent gain in January. Yet given strength of prior orders, shipments of core capital goods — which are an input into first-quarter GDP — rose a very solid 1.0 percent to help offset January’s disappointing 0.4 percent decline. This is an important positive for first-quarter GDP which had been slipping.

Turning back to weaknesses, total unfilled orders were unchanged in February to extend a nearly yearlong streak of disappointment. Lack of unfilled orders will not spark demand for factory hiring. Inventories rose 0.2 percent in line with a 0.3 percent rise in total shipments to keep the inventory-to-shipments ratio unchanged at 1.31.

Another question in this report is the two months of reliance on aircraft orders where strength cannot be expected to extend indefinitely, to say the least for this volatile component. And this morning’s trade report poses further questions especially for capital goods exports which have been stubbornly flat. Still, on a total basis, factory orders are showing the directional lift that advance anecdotal reports have been signaling with rare strength.

Note how the charts show we’ve yet to recover to 2008 levels, and these numbers are not adjusted for inflation:


This measure of retail sales growth collapsed when oil capex collapsed and remains depressed:


Note how the other forecasts have been working their way down towards the Atlanta Fed’s forecast:

Personal income and spending, Consumer sentiment, Atlanta Fed

Trumped up expectations are fading a bit while ‘hard data’ continues to fade. And note the real disposable personal income chart which continues its deceleration that began when oil capex collapsed:

Highlights

A second month of weak spending on services pulled down on consumer spending which could only manage a 0.1 percent rise in February, one that follows a nearly as weak 0.2 percent gain in January. February’s result is below consensus and at the low end of the Econoday forecast range.

Income data are more favorable headlined by an as-expected 0.4 percent gain and a very solid 0.5 percent increase in the wages & salaries component. And consumers moved money into the bank as the savings rate climbed 2 tenths for a second straight month to 5.6 percent. Increases in savings are a factor behind the weakness in spending.

Inflation data are mixed as monthly rates are tame but year-on-year rates, reflecting low prices this time last year, are moving higher. For the first time in nearly 5 years, the PCE price index is over the Federal Reserve’s 2 percent target, up an expected 2 tenths to 2.1 percent. The monthly rate, however, rose only 0.1 percent which if extended into future months would point to easing pressure for the year-on-year as last year’s comparisons become harder.

The PCE core rose a tame looking 0.2 percent on a monthly basis but here the year-on-year rate is 1 tenth higher at 1.8 percent which is also 1 tenth above Econoday’s consensus. And the rate for January is now revised 1 tenth higher and is also now at 1.8 percent.

The pressure on the core rate is very delicate for the Federal Reserve which does not expect this reading to accelerate, only stabilize quietly just under or just at the 2 percent line. The gain in income in this report hints at wages perhaps adding to inflationary pressures, a possibility that will be tested in the average hourly earnings reading in next week’s employment report.

Along with the risk of less-than-tame inflation is the risk of a less-than-excited consumer who, after a vehicle-buying spree in the fourth quarter, may be cutting back and putting money into the bank. This may be good for consumer health and the long-term outlook, but it won’t help first-quarter GDP which, after today’s report, now looks to be decidedly soft.


The chart hasn’t yet been updated for this latest forecast:

Services and manufacturing PMI, Durable goods orders, Atlanta Fed

Trumped up expectations fading, as weakness in the service sector continues, And if Trump loses today’s health care vote, I expect those expectations to fade that much faster:

Highlights

All in the mid-to-low 50s and at 6-month lows, a significant moderation in growth is the signal from Markit Economics’ U.S. diffusion indexes. The composite flash for March is 53.2 which is more than 1 point below the consensus. The manufacturing flash, at 53.4, is also about 1 point below expectations as is the services flash at 52.9.

Respondents are citing customer caution this month and are reporting slowing in employment, especially in the service sector where job creation is at a 3-year low. And in a negative for future hiring, backlog orders are starting to fall. Inventories at manufacturers, in another sign of slowing, are being cut back. Input prices are described as subdued.

The weakness in the manufacturing flash is notable, as it contrasts with extraordinary strength in regional factory reports and also the rival ISM where readings have been in the mid-to-high 50s. The weakness for this report, however, does correspond to mixed readings in hard economic data coming out of Washington.

If the economy does begin to slow, March would be the pivotal month and today’s report will have proven its worth as an advance indicator.

Services:

The Markit flash US services PMI decreased to 52.9 in March of 2017 from 53.8 in February and well below expectations of 54.2. It is the lowest value in six months, as new work was the lowest in 12 months and employment eased. Yet, job creation in March was one of the weakest reported over the past three years. Input cost inflation was relatively subdued.


Manufacturing:

The Markit flash US manufacturing PMI fell to 53.4 in March of 2017 from 54.2 in February and well below expectations of 54.8. It is the lowest reading since October of 2016, mainly due to a slowdown in new orders and lower stocks while input cost inflation picked up.


As previously discussed, muddling through with modest growth as weakness has shifted to the service sector:

Highlights

Aircraft has been giving a significant boost so far this year to durable goods orders which otherwise are soft. Durable goods orders jumped 1.7 percent in February to beat Econoday’s consensus by 2 tenths. The data include an upward revision to January which now stands at a very strong 2.3 percent. But when excluding transportation equipment, which is where aircraft are tracked, durable orders slow to a 0.4 percent February gain which is well under the 0.8 percent consensus.

The weakest part of the report is perhaps the most important part, that is core capital goods (nondefense ex-aircraft) where orders slipped 0.1 percent in February vs expectations for a 0.5 percent jump and following January’s revised 0.1 percent gain. This points to continued weakness in business investment and eventual trouble for GDP. Yet for the first quarter, core shipments in January and February, which are inputs into GDP, are a net positive, as a 1.0 percent February gain offsets a 0.3 percent January dip. Also unfilled orders for core capital goods are building, up 0.2 percent following gains of 0.5 and 0.4 percent in the two prior months.

Total unfilled orders for durables, however, are unchanged and follow a long string of declines. Inventory growth is modest at 0.2 percent with total shipments up 0.3 percent which keeps the inventory-to-shipments ratio unchanged at a stable 1.61.

Durables activity is improving but the strength has been tied largely to aircraft where sustained month-to-month gains are uncertain. And the strength also does not include new orders for capital goods. The major spikes for advance manufacturing readings have yet to translate to similar gains for government data.

Not much has happened here in quite a while, and the numbers are not inflation adjusted:

Personal income and spending, Construction spending, Light vehicle sales, Trade, GPD

The theme of trumped up expectations and actual data heading south continues:

Note the real disposable personal income chart- not good!!

Highlights

Inflation is nearly at the Fed’s 2.0 percent target, up a sharp 3 tenths to 1.9 percent for the PCE price index which is the strongest rate since April 2012. The monthly gain, reflecting rising energy costs, rose an outsized and higher-than-expected 0.4 percent for the highest reading since February 2013. But the core, which excludes food and also energy, held steady at 1.7 percent though the monthly rate for this reading did rise 0.3 percent which is the largest increase since January last year.

Turning to spending and income, personal consumption expenditures could muster only a 0.2 percent gain, 1 tenth below the Econoday consensus in a marginal gain that belies the enormous strength underway in consumer confidence. And when adjusted for inflation, spending fell 0.3 percent for the largest drop since September 2009.

But income is solid, at a monthly 0.4 percent with the wages & salaries component also rising 0.4 percent. The savings rate steadied in the month, up 1 tenth to 5.5 percent.

The PCE price index will put the pressure on the Fed to raise rates at the mid-month policy meeting. Though it’s not quite at target, its clear upward trajectory makes a successful breach all but certain. Turning back to spending, January’s weak opening points to downward revisions for first-quarter GDP estimates.

Net income is decelerating in line with previously discussed decelerating credit aggregates:


Yes, the weakness was in public spending, but it’s still spending and GDP etc. and hints at the possibility that public construction spending was a bit pumped up in front of the election, as per the chart?
;)

Highlights
Construction spending fell a sharp 1.0 percent in January but the weakness is in public spending, not residential spending where gains are substantial. Spending on new single-family homes rose 1.1 percent in the month with multi-family spending up 2.2 percent. Year-on-year, single-family spending continues to improve with a 2.3 percent gain while the multi-family category remains very strong at 9.0 percent.

Now the weakness in the report. Public spending posted wide declines including the Federal component, down 7.4 percent in the month, and the state & local component, down 4.8 percent. Totals on educational buildings and highways & streets were all weak.

Private spending on nonresidential building was unchanged in the month with gains for power and manufacturing offsetting declines for transportation, office buildings as well as commercial construction.

But public spending looks to get a boost down the road with new fiscal initiatives while the strength of the report, residential investment, is very solid and looks to improve further given gains in related permits. The housing sector has gotten off to a bumpy start this year though this report is one of strength.


Vehicle sales looking soft again:

U.S. Light Vehicle Sales at 17.5 million annual rate in February

by Bill McBride on 3/01/2017 03:10:00 PM

Based on a preliminary estimate from WardsAuto, light vehicle sales were at a 17.47 million SAAR in February.

That is down about 1% from February 2016, and unchanged from last month.

Read more at http://www.calculatedriskblog.com/#pBORsUyEDpm03RrU.99


Released yesterday:

Trade deficit higher than expected, equals lower GDP estimates:

Highlights

The nation’s goods gap widened sharply in January, to $69.2 billion which is well beyond December’s revised $64.4 billion and outside Econoday’s low estimate. Imports of consumer goods and also vehicles are once again the source of the trade mismatch, surging 4.8 percent and 2.9 percent respectively and helping to lift total imports by 2.3 percent. Exports fell 0.3 percent with weakness in capital goods, down a very sharp 4.6 percent, the unwanted standout feature, one that may deepen in the months ahead based on yesterday’s durable goods report where related orders proved weak. This report will be bringing down early first-quarter GDP estimates.

Not revised up as expected, and q1 at risk as well as we’ve already seen trade and inventories deteriorating:

Highlights

The second revision to fourth-quarter GDP shows little change, actually no change at the headline level which remains at 1.9 percent annualized growth. But good news comes from consumer spending which gets a 5 tenths of a percentage point upgrade to a 3.0 percent rate and a 2.1 percent contribution. Durables, reflecting vehicle sales, are the standout at an 11.5 percent rate (nondurables at plus 2.8 percent and services at plus 1.8 percent). Nonresidential fixed investment gets a small downgrade to a 0.2 percent contribution with residential investment also getting a small downgrade but still solid at a 0.4 percent contribution.

Inventories show little change in the revision, rising what may prove an unwanted $46.2 billion and contributing 9 tenths of a percentage point or nearly half of the quarter’s total growth. Net exports are unchanged, subtracting 1.7 percentage points as exports fell sharply and imports rose even more sharply. Government purchases get a downgrade, contributing only a small fraction to the quarter’s GDP.

The fourth quarter was mixed with negatives led by net exports and the questionable inventory build. But the positives are clear, a consumer that was spending and also investing in housing.

Pending home sales, Durable goods orders, Dallas Fed, Bank loans, Japan

Same story, expectations trumped up but actual numbers not so good:

Bad:

Highlights

Just when existing home sales seemed to be showing lift the pending home sales index, which tracks initial contract signings, is down 2.8 percent in the January report. This points to weakness for final resales in February and March.

The West is the culprit in January’s data, with contract signings down 9.8 percent in the month for year-on-year contraction of 0.4 percent. The Midwest is also weak, down 5.0 percent in the month for 3.8 percent on-year contraction. The South and the West both show no better than low single digit monthly and yearly gains.

Adding to the bad news is a sharp downward revision to the December index, now at plus 0.8 percent vs an initial 1.6 percent. This hints at less strength for February existing home sales, sales that proved strong in last week’s January report which however is now a memory. This setback for resales follows last week’s sharp downward revision for December new home sales and together they point to a housing sector where growth is suddenly struggling.

Bad:

Highlights

Throw out the all the advance indications that show unusual acceleration in the factory sector, because the meat of the January durable goods report only shows the usual volatility behind which are sagging numbers for key readings. Aircraft, both domestic and defense, skewed durable goods orders sharply higher in January, up 1.8 percent to hit the Econoday consensus. Not hitting the Econoday consensus, however, are orders that exclude aircraft as well as all other transportation equipment. This reading fell 0.2 percent to come in well below Econoday’s low estimate for a 0.2 percent gain.

The worst news in the report is a 0.4 percent decline in orders for core capital goods (nondefense ex-aircraft). This ends 3 months of strength for this reading and pulls the rug out from expectations for a first-quarter business investment boom as indicated by business confidence readings.

Pulling the rug out from the whole factory outlook is yet another contraction for unfilled orders, down 0.4 percent and which have now fallen in 7 of the last 8 months. This is the deepest contraction since the recession and points squarely at lack of hiring for the factory sector. In other data, shipments are down 0.1 percent and inventories are unchanged to keep the inventory-to-shipments ratio unchanged at 1.61.

But aircraft is a big positive in this report though monthly gains are not likely to extend far, if at all. Upward revisions to December are a plus for fourth-quarter revisions while another positive is a 0.2 percent January gain for motor vehicles where the outlook however, given the strength of prior sales gains, is uncertain and will pivot on Wednesday’s release of February unit retail sales. Weak exports have been the Achilles heel of the factory sector and today’s report points to continued lack of demand for U.S. factory goods. Watch for advance data on goods exports in tomorrow’s trade report for January.


Ok, but check out the highlights:

Highlights

Yet another advance report, in yet another contrast with definitive data, is showing significant strength. Readings are very positive in the Dallas Fed February report including a nearly 5 point gain in production to a very strong 16.7 and a nearly 2-1/2 point gain for general activity to 24.5.

New orders, however, slowed by just more than 4 points to what is a still solid 11.6. Delivery times are taking longer and inventories of inputs are higher, both positive indications of demand. Input costs are up with wage growth solid. Selling prices are even showing traction.

This report may be getting a general lift from easy comparisons as the Dallas factory region is just emerging from 2 years of energy-related weakness. But the wider risk for anecdotal surveys like this one is that, in their low key methodology where respondents often offer general, not numerical, answers to questions, they are picking up improvement in sentiment as opposed to actual measurable improvement in dollars or volumes.

Still in deceleration mode:

Who would’ve thought ‘monetary policy’ doesn’t work (anywhere):

The World’s Most Radical Experiment in Monetary Policy Isn’t Working

Feb 26 (WSJ) — Japan is nearly four years into a Central Bank stimulus effort involving printing trillions of yen and guiding interest rates into negative territory. Bank of Japan governor Haruhiko Kuroda’s shock-and-awe stimulus, launched in April 2013, fizzled after a short-lived spurt of growth and rising prices. Japan fell back into deflation last year. In November, Mr. Kuroda postponed his goal of reaching 2% inflation. He said in a series of speeches last year that an entrenched “deflationary mind-set” stifled hope that wages or prices will rise, limiting the impact of monetary policies such as negative rates.

Nonfarm Payrolls, Factory orders, ISM non manufacturing, Conway comments

Better than expected. Lots of seasonality to January numbers. For example, warm weather that adds a few construction jobs gets magnified, and due to light temporary help hiring during the holiday season there were fewer workers to layoff in January, giving a boost to temporary help type measures. Meanwhile, however, the deceleration trend in the year over year chart continues, and wage growth remains subdued and last month’s downward revision indicated prior concerns were premature:

20301

Highlights

In very positive news, payroll growth in January did indeed exceed expectations, rising 227,000 for the best showing since September and well above the 2016 average of 187,000. Construction spending has been improving and it’s seen in payrolls where the sector added a very strong 36,000 jobs in the month. Finance employment follows at 32,000.

In a sign of labor market slack, the unemployment rate rose 1 tenth to what is still a very low 4.8 percent. This reflects new entrants into the labor market as the labor force participation rate, which has been depressed, bounced 2 tenths higher to 62.9 percent. The pool of available workers rose 183,000 in the month to 13.4 million.

The surprise in this report, and one that will not heat up expectations for a rate hike at the March FOMC, is surprisingly light wage pressure as average hourly earnings ticked only 0.1 percent higher with, importantly, December revised down from an initially hot 0.4 percent to a gain of only 0.2 percent. The year-on-year rate, which was skirting the 3 percent line in December’s initial data, is now way back at 2.5 percent.

The mix of this report is non-inflationary sustainable growth: rising payrolls, new entrants, stable wages. ADP and jobless claims, not to mention jobs-hard-to-get in the consumer confidence report, were all signaling a stronger-than-expected employment report for January, something to remember ahead of the next employment report. Note that the net effect of revisions, which include annual bench marking and a population update, were negligible but did skew November lower (164,000 vs a prior 204,000) and September higher (249,000 vs 208,000).

20302
This is the number of employed not seasonally adjusted. As you can see, January always falls off quite a bit, so the seasonally adjusted numbers take that into account best they can by looking at past January drop offs, and looking at year over year growth, as in the chart above, ‘removes’ the seasonal factors:

20303
Wage growth remains subdued indicating a lack of aggregate demand:

20304
This is the year over year growth rate of the household survey which tends to be more volatile:

20305
So last month 4.418 million people who got jobs hadn’t been counted as being available for work the day before:

20306
And the number of people holding more than one job seems to be working its way higher:

20307
As previously discussed, factory orders seem to be modestly growing again vs prior, lower levels:

20308
Trumped up expectations are fading a bit for this service sector survey:

20309

Highlights

Keeping with the morning’s theme of strength, the ISM non-manufacturing index came in steady at 56.5 with new orders at an even stronger 58.6 and with business activity leading the report at 60.3. Employment, like this morning’s jobs report, is solid at 54.7 for a 2-point gain in the month.

But backlog orders, despite the strength in new orders, remain flat which will contain future employment gains. Another negative is new export orders which had been strong reflecting foreign demand for U.S. technical and managerial services but which fell into contraction in January at 48.0.

The bulk of the data, however, is very strong, starting off 2017 on the same note of strength that the report showed throughout 2016.

20310

Trumped up expectations, Chicago PMI, Consumer sentiment, Redbook retail sales, Executive orders, GDP comment, Trump comments, Income and spending chart

Trumped up expectations vs ‘hard data’:

13101

13102

Highlights

January was a flat month for the Chicago PMI which could manage only 50.3, virtually at the breakeven 50.0 level that indications no change from the prior month. New orders have now joined backlog orders in contraction in what is a negative combination for future production and employment. Current production eased but is still solid though employment is clearly weakening, in contraction for a 3rd straight month. One special note is pressure on input costs which are at a 2-1/2 year high. Business spirits and consumer expectations may be high, but they have yet to give the Chicago economy much of a boost. Watch for the consumer confidence report later this morning at 10:00 a.m. ET.

13103
Trumped up expectations starting to cool:

13104

Highlights

Consumer confidence held strong and steady in January, at 111.8 for only a slight decrease from December’s 15-year high of 113.3 (revised). Details are positive including a noticeable decline in those saying jobs are hard to get right now, at 21.5 percent vs December’s 22.7 percent, combined with a solid rise in those who say jobs are plentiful, at 27.4 vs 26.0 percent.

But the outlook is less upbeat with more saying there will be fewer jobs 6 months from now and fewer saying there will be more. Confidence in income prospects is also down.

And there’s red flags in the details, including a nearly 2 percentage point drop in buying plans for autos. This suggests that auto demand, after several months of very strong sales, may have understandably flattened. Home sales have been less strong than auto sales, but here too buying plans are down sharply.

Back to the lows:

13105

Inventories and Low Deflator Boost Low GDP Estimate

By Rick Davis

Jan 29 (Econintersect) — The BEA’s “bottom line” (their “Real Final Sales of Domestic Product”, which excludes the growing inventories) recorded a sub 1% growth rate (+0.87%), down over 2% (-2.17%) from 3Q-2016.

Real annualized household disposable income was reported to have grown by $177 quarter-to-quarter, to an annualized $39,405 (in 2009 dollars). The household savings rate decreased by -0.2% to 5.6%.

For the fourth quarter the BEA assumed an effective annualized deflator of 2.12%. During the same quarter (October 2016 through December 2016) the inflation recorded by the Bureau of Labor Statistics (BLS) in their CPI-U index was 3.41%. Under estimating inflation results in correspondingly over optimistic growth rates, and if the BEA’s “nominal” data was deflated using CPI-U inflation information the headline growth number would have been much lower, at a +0.62% annualized growth rate.

Trump gives an inaccurate explanation of how pipelines are built and shipped

By Tom DiChristopher

Jan 30 (CNBC) — President Donald Trump on Monday gave an inaccurate explanation of how foreign-made pipes are made and shipped to the United States.
The president made the comments as part of his case to convince oil and gas pipeline makers to use U.S. materials and equipment rather than imported parts.

Speaking to a group of small business leaders, Trump described a process that “hurts the pipe” — suggesting that many miles of America’s pipelines contain substandard parts which presumably would have to be replaced. But he simultaneously indicated that he is not actually familiar with how pipelines are made, using a variation of “I imagine” three times and saying “I assume” as he explained the process.

“These are big pipes. Now, the only way I can imagine they [ship them] is they must have to cut them. Because they’re so big, I can’t imagine — they take up so much room — I can’t imagine you could put that much pipe on ships. It’s not enough. It’s not long enough,” he said.

So I assume they have to fabricate and cut, which hurts the pipe, by the way,” he said.

A spokesperson for the Association of Oil Pipe Lines said he had never heard of foreign pipe makers cutting segments into portions to send them overseas. Manufacturers create pipes in lengths that can be shipped rather than chopping up vast lengths of pipe.

TransCanada, the company behind the controversial Keystone XL pipeline, also told CNBC that pipes it buys from overseas are not cut into smaller segments before being shipped.

So it’s rule by executive orders and tweets supported by alternative facts:

How Islamophobes and “Alternative Facts” Shaped Trump’s Muslim Ban

And as previously discussed, looks like a weak dollar policy is in the works:

Obama

>Euro spikes after Trump’s trade adviser says Germany is using ‘grossly undervalued’ currency

Germany is using a “grossly undervalued” euro to gain advantage over the United States and its own European Union partners, Donald Trump’s top trade adviser told the Financial Times, echoing a sentiment he gave last week on CNBC.

Peter Navarro, the head of Trump’s new National Trade Council, told the newspaper that the euro was like an “implicit Deutsche Mark” whose low valuation gave Germany a competitive advantage over its main partners.

Navarro said that Germany was one of the main hurdles to a U.S.-EU trade deal and that talks over a Transatlantic Trade and Investment Partnership (TTIP) were dead, the newspaper reported.

As previously discussed, weak income tends to drag down spending:

As previously discussed, weak income tends to drag down spending:

13106

Personal income and spending, Pending home sales, Dallas manufacturing

Just skip to the chart:

13001

Highlights

Personal income rose a moderate 0.3 percent in December with the wages & salaries component posting a slightly better gain at 0.4 percent. The savings rate, however, fell in the month, down 2 tenths to 5.4 percent which helped to fund a strong 0.5 percent gain in consumer spending. December’s spending was centered in a 1.4 percent rise for durable goods, boosted specifically by autos, but included a 0.4 percent gain for services and a 0.2 percent for nondurable goods.

Inflation data look tame but nevertheless continue to trend higher. The core PCE (less food & energy) inched only 0.1 percent higher with the year-on-year at 1.7 percent which is unchanged from an upwardly revised November. Total PCE prices, boosted by a 1.7 percent monthly rise in energy, rose 0.2 percent. But this year-on-year rate, which is the most important barometer for price change in the economy, is up 2 tenths to 1.6 percent which is the highest since the oil collapse in 2014 (July 2014).

In sum, income is still moderate and spending is solid though may be getting funded from savings. And for inflation hawks, PCE prices are closing in steadily toward the Fed’s 2 percent target.

The net income deceleration/meltdown continues, with no reason to suspect anything but more of same:

13002
With income currently falling faster than consumption, I wouldn’t be surprised if consumption growth slows as well:

13003
Skip to the chart here as well. The lack of income spills over into just about everything else:

13004

Highlights

Existing home sales have been at cycle highs but have not been able to move above, yet new gains may perhaps be underway. The pending home sales index rose a very a strong 1.6 percent in December which is just above Econoday’s top estimate. Pending sales track contract signings for resales and the gain points squarely at January and February strength for final sales which are tracked in the existing home sales report..

Regional data for pending sales show the West out in front with a year-on-year gain of 5.0 percent. The Midwest trails with a 3.4 percent year-on-year decline. This is a light week for housing data though the Case-Shiller price report will be a highlight of tomorrow’s calendar.

13005
More signs that the manufacturing sector is now muddling through:

13006

Highlights

The Dallas Fed joins other regional reports pointing to strength for the nation’s factory sector. The production index did slow but remains in the double digits, at 11.9 in January vs a revised 14.8 for December. And new orders are on the rise, at 15.7 vs December’s 10.1 for the strongest showing since April 2014.

Unfilled orders, at a modest looking 5.2, are the strongest since June 2012. Employment is another positive, at 6.1 vs minus 3.4 for the best showing since December 2015. And the general activity index underscores the strength, at 22.1 vs an upward revised 17.7 and the best reading since all the way back at the beginning of the cycle in April 2010. Price data show slightly increasing pressures while inventories, reflecting the production strength, are on the decline.

This report offers a special look at the oil patch, underscoring that 2-1/2 tough years following the price collapse for oil are finally behind the sector.

Redbook retail sales, PMI Markit manufacturing, Richmond Fed Manufacturing Index, Existing home sales, Trump budget director, CIA on Trump, Mnuchin on $, Euro area surveys

Still back to the lower, pre mini spike levels. Industrial production was up due to elevated utility bills, which might explain why retail sales are low:

12401

Highlights

Same-store sales growth continued the glacial pace of the prior week and was up just 0.3 percent year-on-year in the January 21 week, a sharp deacceleration from the 2-percent plus growth seen in the final weeks of December. Versus December, month-to-date January sales were down 3.5 percent, more than twice the decline seen in January last year. Full month year-on-year sales were up just 0.5 percent, down from 1.5 percent in the last week of December and the slowest growth for this reading since early October. The sales growth slowdown in Redbook’s sample continues to point to weakness in core retail sales for January.

12402
Yes, manufacturing is now muddling through at relative low levels, as weakness has spread to the service sector:

The Flash Markit Manufacturing PMI in the United States increased to 55.1 in January of 2017 from 54.3 in the previous month, beating market expectations of 54.5. It is the highest reading since March of 2015 as new work boosted output and purchasing activity while growth in new export work remained muted and employment eased.

12403

12404
Housing remains depressed, now due to a jump in rates not caused by demand, but by market fears of future Fed actions:

12405

Sales of previously owned houses in the United States slumped 2.8 percent month-over-month to a seasonally adjusted annual rate of 5490 thousand in December of 2016, below market expectations of 5520 thousand. Sales of condos shrank 10.3 percent to 610 thousand and those of single family homes fell 1.8 percent to 4880 thousand. The average price declined 0.9 percent, the months’ worth of supply went down to 3.6 from 3.9 and the supply of houses on the market decreased to 1.65 million, the lowest since 1999. The November figure was revised up to 5650 thousand from 5610 thousand.

12406
A bit of a rush to buy before rates went up, then back down:

12407

12408
Here we go. Net spending cuts or even ‘neutrality’ are likely to be contractionary, as spending generally has a much higher multiple than tax cutting.
And growth has already been decelerating continuously for over two years:

Trump Budget Director Says National Debt Needs Quick Action

By Jennifer Jacobs and Erik Wasson

(Bloomberg) — President Donald Trump’s pick for budget director Mick Mulvaney said the nearly $20 trillion national debt is the equivalent of an ordinary American family owing more than a quarter of a million dollars on their credit cards, a problem that needs to be “addressed sooner rather than later.”
“Families know what that would mean for them,” Mulvaney will say Tuesday in Washington when he faces a pair of Senate committees over his nomination as director of the Office of Management and Budget, according to his prepared testimony. “It is time for government to learn the same lesson.”
A Republican congressman from South Carolina, Mulvaney was part of the wave of fiscal-conservative Tea Party members elected in 2010 and has been one of the most pugilistic advocates for cutting government spending. He is one of eight Trump nominees that Senate Minority Leader Chuck Schumer has placed in “the most troubling” column. More than 50 groups have sent letters to Capitol Hill urging members of Congress to reject Mulvaney’s nomination, arguing he’s too extreme.
Mulvaney has voted against debt ceiling increases and criticized House Speaker Paul Ryan’s budgets for spending too much. If he’s installed in the post — and given the leeway to negotiate his way — the next debt-limit debate could include a fight over whether future spending should be cut to offset money spent in decades past. The debt limit returns in March, so those discussions aren’t far away.
He will appear before the Budget Committee in the morning and the Homeland Security and Governmental Affairs Committee in the afternoon.

Earned Honestly

“I believe, as a matter of principle, that the debt is a problem that must be addressed sooner, rather than later,”
Mulvaney said in the remarks provided in advance of the hearings. “Part of fixing that problem also means taking a hard look at government waste…and then ending it. American taxpayers deserve a government that is efficient, effective, and accountable. American families earn their money honestly; they expect the government to spend it honestly. We owe them that much.”
Still, Mulvaney said he appreciates the safety net that Social Security and Medicare provide, and would like them to be there for his three children, who are triplets.
Mulvaney is a founding member of the House Freedom Caucus, hardline Republicans who have opposed compromising with Democrats just to keep the government operating during budget disputes. He helped lead the 2013 effort that resulted in a government shutdown over Obamacare funding.
“I will be loyal to the facts, and to the American people whom I serve,” he said in the prepared remarks.

At Odds

Mulvaney’s long-held position that new spending must be offset with equal cuts elsewhere could put him at odds with the president when it comes time to make good on Trump’s campaign promise to invest $1 trillion in roads, bridges and other infrastructure. He was on the losing side of a push to ensure spending on Hurricane Sandy relief was matched with reductions in other parts of the government.
Mulvaney has voted for unsuccessful proposals that sought to cut spending deeply enough to bring the federal budget into balance within a five-year window. Those proposals by the Republican Study Committee, a faction of fiscal conservatives, included raising the Social Security full-benefits age to 70 and changing the measure of inflation to reduce the retirement program’s payouts.
On the campaign trail, Trump promised he wouldn’t cut Social Security.
The most recent version of the group’s budget proposal would have given an extra $38 billion to the military while reducing domestic spending by $100 billion, in part by eliminating the National Endowment for the Arts and the Kennedy Center and ending funding for the Washington, D.C.-area’s metro transit system.
While a majority of congressional Republicans supported using a war-funding account for regular military needs, Mulvaney worked with Maryland Democrat Chris Van Hollen to demand all routine Pentagon purchases stay within legal spending caps.
Mulvaney’s opposition to that cap-skirting maneuver could become another pressure point, given Trump’s promise to beef up troop levels and weaponry.
Congress is expecting the administration to send up an emergency military spending request in the next few weeks.

The CIA on how they will ‘manage’ their approach to President Trump:

CIA starts recruiting its newest asset Donald Trump

The key to Trump? “He likes to win. He has a nostalgia for a period in history when U.S. always won,” Medina said. So on climate change, for instance, rather than pointing out that there’s science behind it, or that the U.S. needs to set an example, an analyst could point out that the solar energy business is likely to be a “gazillion-dollar business and the U.S. wants to be the winner,” she said. “That’s not politicizing the intelligence, it’s talking to the consumer.”
If Trump’s style means talking to him rather than giving him a written report, that’s fine, said former Acting CIA Director John McLaughlin.

As previously discussed:

Mnuchin Says Excessively Strong Dollar May Hurt U.S. Economy (Bloomberg) U.S. Treasury Secretary nominee Steven Mnuchin said an “excessively strong dollar” could have a negative short-term effect on the economy. “The strength of the dollar has historically been tied to the strength of the U.S. economy and the faith that investors have in doing business in America,” Mnuchin said in a written response to a senator’s question about the implications of a hypothetical 25 percent dollar rise. “From time to time, an excessively strong dollar may have negative short-term implications on the economy.”

Strong euro stuff:

Private sector growth slows slightly but manufacturing remains buoyant (Markit) Flash Germany PMI Composite Output Index at 54.7 (55.2 in December). Services PMI Activity Index at 53.2 (54.3 in December). Manufacturing PMI at 56.5 (55.6 in December). Manufacturing Output Index at 57.6 (57.0 in December). As was the case with activity, manufacturers outperformed service providers with regard to new order growth. New export work in the goods producing sector rose at the steepest rate since September 2016. Despite robust growth of new work, volumes of outstanding business at German private sector firms rose only fractionally.