Just plain bad. Including last month’s downward revision.
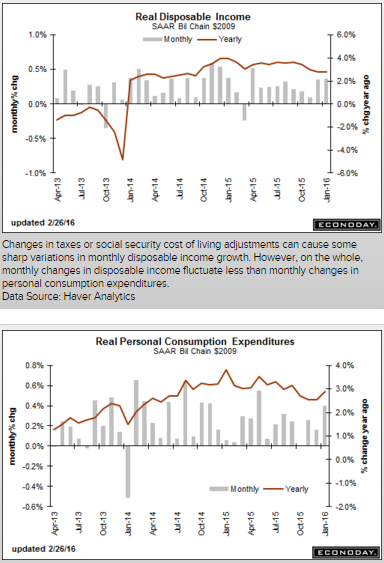
And, again, sales = income, and lower income means less to spend in the next period:
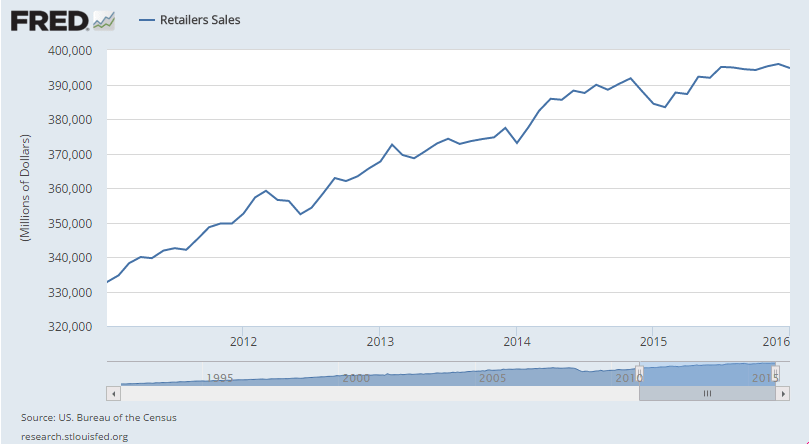
Retail Sales
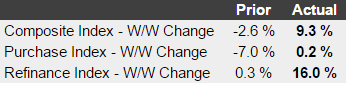
Highlights
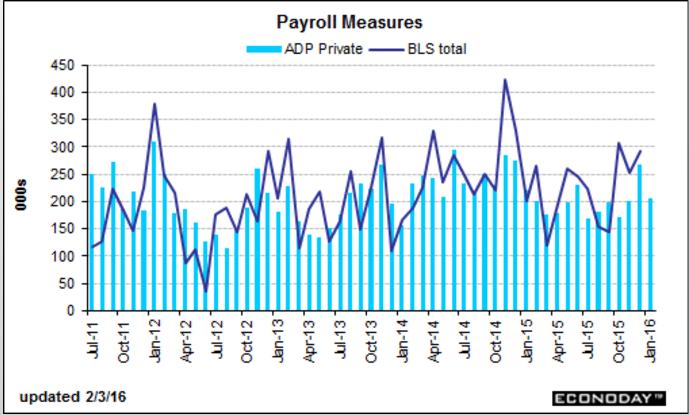
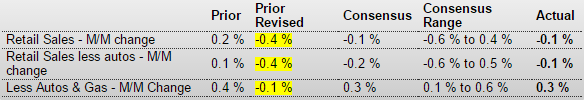
Consumer spending did not get off to a good start after all in 2016 as big downward revisions to January retail sales badly upstage respectable strength in February. January retail sales are now at minus 0.4 percent vs an initial gain of 0.2 percent. The two major sub-readings also show major downward revisions with ex-auto sales now down 0.4 percent vs an initial gain of 0.1 percent and ex-auto ex-gas sales now at minus 0.1 percent from plus 0.4 percent. The latest for this latter core rate is really the main positive in today’s report, up a solid 0.3 percent in February. Total sales for February are weak at minus 0.1 percent as is the ex-auto reading, also at minus 0.1 percent.
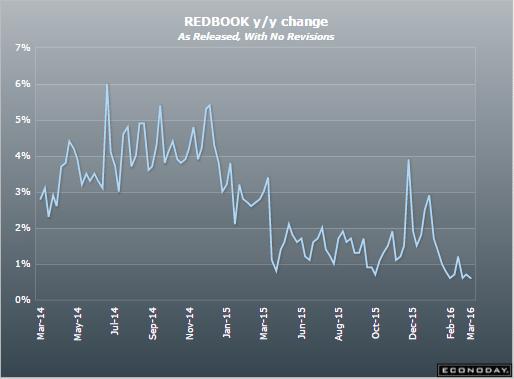
But even in the core readings, details are not great with strength so far this year mixed across nearly all categories. Still, year-on-year strength is evident in two key discretionary components which are vehicles, up 6.8 percent, and restaurants which are up 6.4 percent. Non-store retailers, benefiting from growth in ecommerce, are up 6.3 percent. Sporting goods, a smaller discretionary category, are up 6.7 percent. And building materials & garden equipment, in a sign of strength for residential investment, are up 12.2 percent. The downside includes electronics & appliances which are at minus 3.2 percent and department stores down 2.2 percent. The weakest of all of course are gasoline stations, down 15.6 percent on the year as low fuel prices depress dollar sales.
Given the skewing effect of gasoline, the ex-gas total is important to look at it and it’s up 0.2 percent in the month for very respectable yearly growth of 4.8 percent. This reading underscores the silver lining in the report, that retail sales, despite all the negatives, are moving in the right direction. January and February are the lowest sales months of the year, a fact that magnifies adjustment effects and can cause volatility in the readings. But that aside, consumer spending, despite high employment, is struggling to break out of a flat run that included a very soft holiday season.
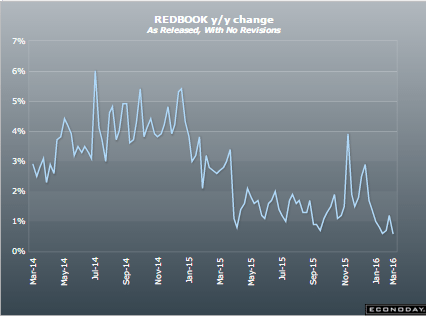
This is year over year change, adjusted for inflation:
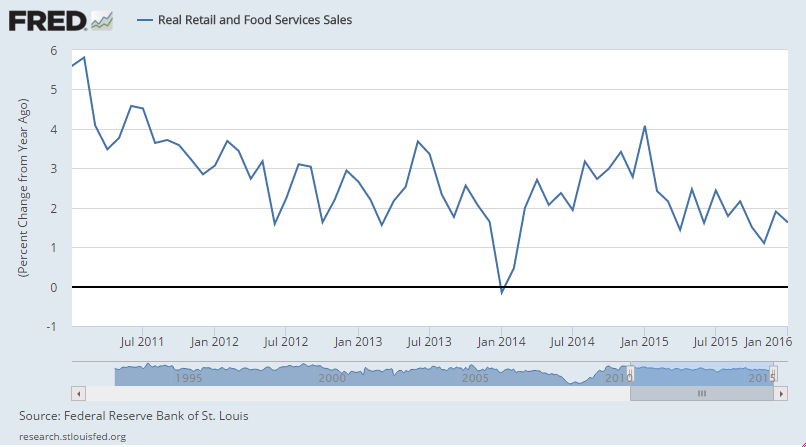
While U.S. retail sales fell less than expected in February, the sharp downward revision to January’s sales could be “devastating” for investors, CNBC’s Jim Cramer said Tuesday.
“I’m just kind of flummoxed. A number comes out that makes us feel great, and then that number is taken away,” Cramer said on “Squawk on the Street.”
;)
Another bad one:
Housing Market Index
Highlights
Demand for new homes is solid but lack of available lots and shortages in construction labor are holding back growth. The housing market index came in unchanged in March at a 58 level which however remains well above breakeven 50. Present sales, unchanged at a strong 65, lead the March report followed by future sales which are down 3 points to 61. A plus, however, is a 4 point gain to 43 for buyer traffic which has been weak this whole cycle.
The gain in traffic hints at the drawing power of low mortgage rates and speaks to the strength of the labor market. But there hasn’t been much acceleration in housing nor is any expected in tomorrow’s permits data. The housing sector, which was billed as a strength for 2016, has yet to build any momentum this year.
Also bad:
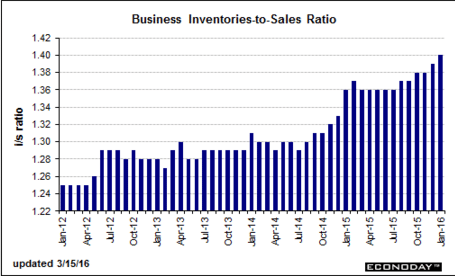
Business Inventories
Highlights
It’s been a weak morning for U.S. economic data and business inventories are no exception. Inventories rose an unwanted 0.1 percent in December against a 0.4 percent decline for sales in a mismatch that drives the stock-to-sales ratio from 1.39 to 1.40 for the fattest reading of the whole cycle, since May 2009. Inventories fell for factories but rose for wholesalers and also for retailers. Sales, however, fell for both retailers and especially for wholesalers. Heavy inventories are a negative for future production and future employment and today’s report points to slowing for both during the first quarter.
Better than expected but still weak:
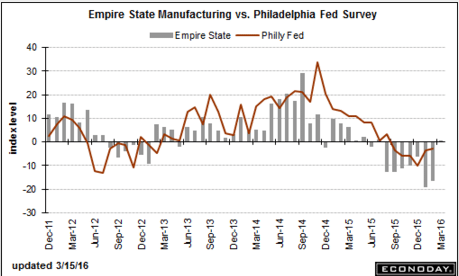
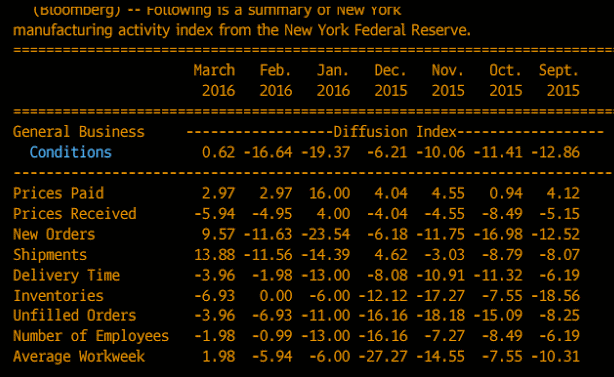
Empire State Mfg Survey
Highlights
After seven straight months of contraction, the general conditions index of the Empire State report is back in the plus column, though just barely at 0.62 in a reading that signals fractional strength for factory activity during March. New orders are the report’s most convincing headline, at plus 9.57 to end nine straight months of contraction. Unfilled orders, however, remain in contraction, but only slightly at minus 3.96, as does employment at minus 1.98. Inventories are in contraction as are selling prices. Yet still, the 6-month outlook is picking up, to plus 25.53 for a more than 10 point gain. Shipments are also positive, at 13.88 in what points to strength for the manufacturing component of the March industrial production report, the February edition of which will be posted tomorrow and is expected to be flat. Flat is really the theme of this report which, compared to the deep contraction of prior reports, is relatively good news for a factory sector that has been getting hit by weakness in exports and energy equipment.
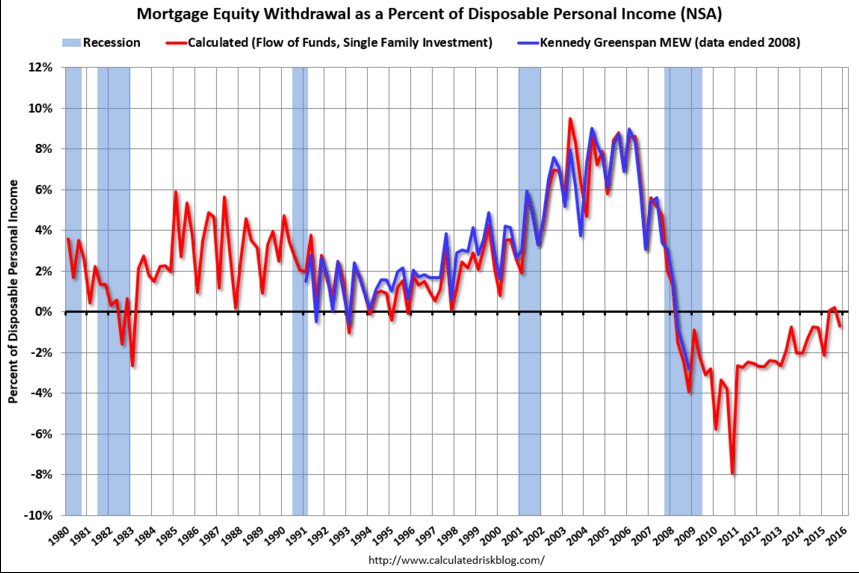
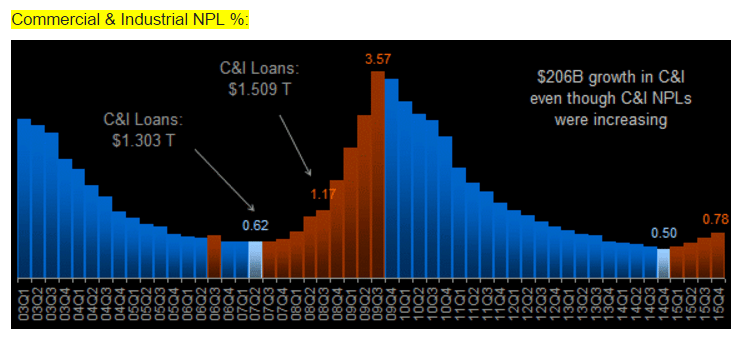
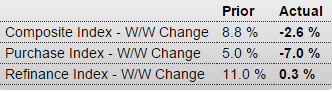
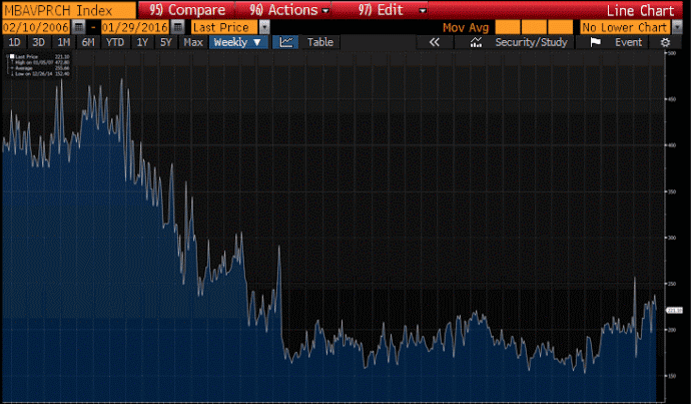
No sign of credit expansion here: