Re: Alt A downgrades


[Skip to the end]

(An email exchange)

On Wed, Jun 4, 2008 at 12:57 AM, Eric wrote:
>     I guess you have seen this article.
>
>      Primes going down too.
>
>
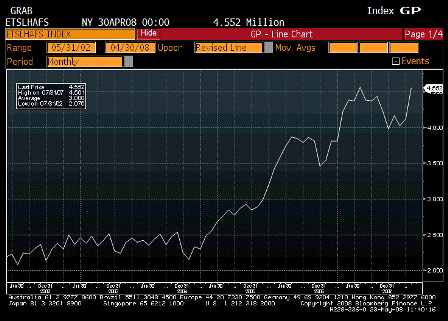
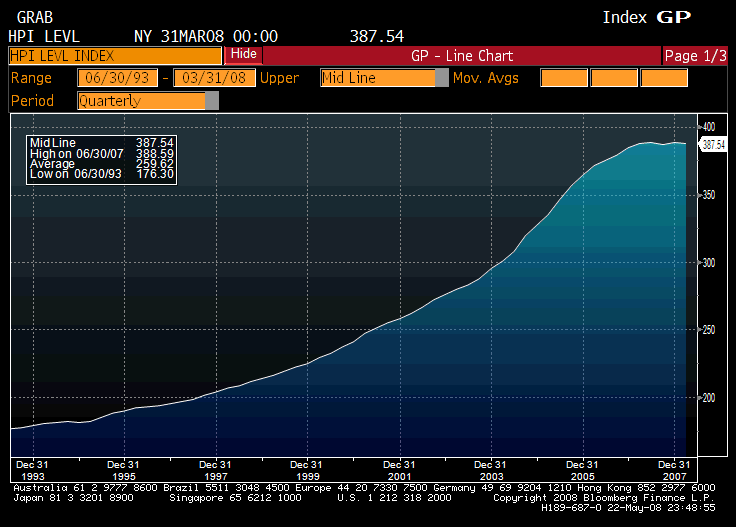
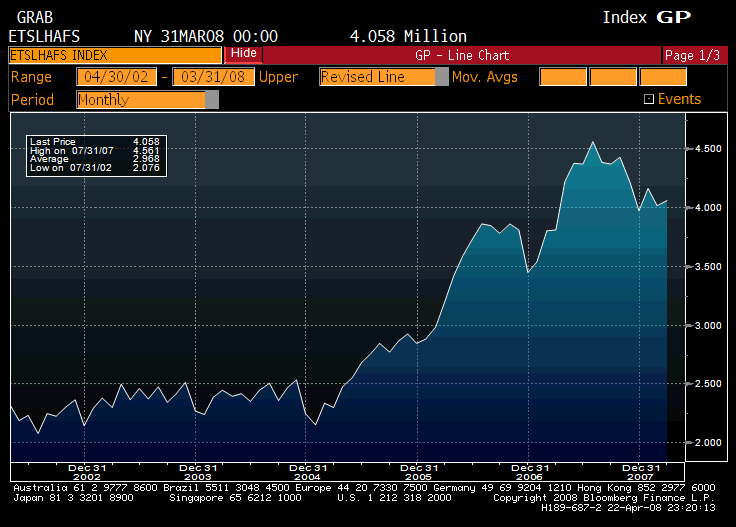
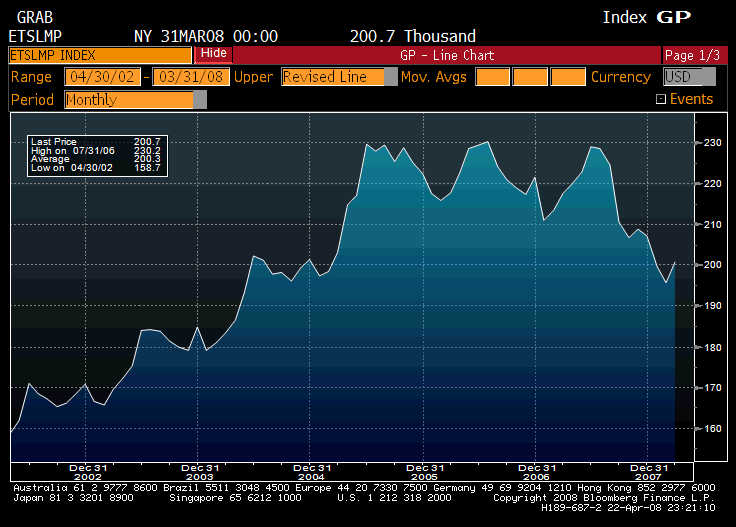
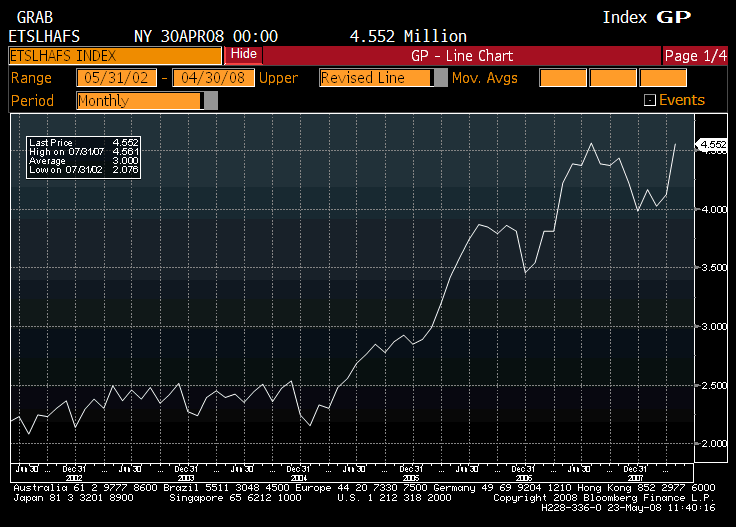
>      More generally look at the attached graphs, they suggest that IOs and other
>      exotic mortgage are clearly a major cause of the problems, independently of
>      the quality of the loans. I think there is here a pretty good argument to make
>      that non-fixed mortgages, and more especially exotic mortgage have structural
>      characteristics that make them prone to speculative and ponzi structure. The
>      borrowers expect to be able to refinance at one point once interest rate reset or
>      the principal become due. Warren you were saying that proof of ability to pay
>     “libor plus 3 or whatever” was necessary to qualify. This margin of safety
>      (expected ability to pay libor +3 even though now borrower pay only teaser rate)
>      may have been destroyed in several ways.
>
>      – the interest rate may have reset at a higher rate than libor + 3, so that people
>      cannot afford the mortgage anymore.
>
>      – ARMs reinforce the probability of the previous effect, especially when libor when
>      up sky high after the crisis
>
>     – Income of borrowers felt short of expectations, expecially with the economic
>     slowdown (here fiscal policy is clearly a big player)
>
>     – The margin of safety thinned. Maybe previously they had to prove libor + 5 but
>     progressively borrower only had to prove libor + 4 then libor + 3. This would qualify
>      more borrowers and make the deal more sensitive to shock in product and financial
>      markets
>
>      In all this case the affordability of the mortgage is questioned Þ need to refinance Þ
>      if not available then sell the house (short sale or foreclosure). Fixed-rate mortgage
>      eliminate three of the previous reason (only income expectations is a problem).
>
>      Éric

agreed with all.

add to that food and energy prices taking income from home mtg payments, which could be the larger short term effect.

the fed has been taking some heat for this under the theory that the low rates have hurt the $ and thereby hurt the financial sector via the above channel, rather than helped the financial sector via lower rates ‘easing’ conditions via the lower payments channel.

the fed has argued this isn’t the case, insisting the lower rates have helped more than hurt.

also, the fiscal package could soften some of the delinquency increases for a few months.


[top]

Dow Jones: Housing Starts


[Skip to the end]

Housing Starts Down 8.7% In April

(Dow Jones) Japan’s housing starts fell 8.7% in April from a year earlier to 97,930 units, the Ministry of Land, Infrastructure and Transport said Friday.

The result was better than the 11.0% decline forecast by a Dow Jones and Nikkei poll of economists.

That was the 10th straight month of declines. The orders fell 15.6% in March and 5.0% in February.

Annualized housing starts stood at 1.151 million units.

Note that this is now higher than in the US, with a far lower population.

US starts should move well above this level over the next few months.

Housing starts for individual homes in April fell 7.8% to 27,274 units, while rental housing starts slipped 5.3% to 39,220 units.

Starts for multiunit dwellings, meanwhile, fell 10.4% to 31,048 units, including condominiums.


[top]

Bloomberg: New-Home Sales in the U.S. Rose 3.3% to 526,000 Pace

Looking more like a bottom with every report. And most housing reports are ‘fighting’ some strong seasonals in the spring.

by Shobhana Chandra

(Bloomberg) New-home sales in the U.S. unexpectedly rose in April after readings for the prior month were revised down, signaling a worsening housing slump is still a threat to the economy.

Sales increased 3.3 percent to an annual pace of 526,000 from a 509,000 rate the prior month that was the lowest in 17 years, the Commerce Department said today in Washington. A separate report today showed home prices dropped in the first quarter by the most in at least 20 years.

A separate report today showed confidence among American consumers fell to the lowest level since October 1992 this month, raising the risk that households will rein in spending. The Conference Board’s confidence index declined more than forecast to 57.2.

They already have reined it in. That´s what an export economy looks like!

Economists’ Forecasts
Economists forecast new home sales would drop to a 520,000 annual pace from an originally reported 526,000 rate the prior month, according to the median estimate in a Bloomberg survey of 70 economists. Forecasts ranged from 500,000 to 570,000.

Purchases in April were the second lowest since October 1991. The March reading became the weakest since April 1991.

The median sales price last month increased 1.5 percent from April 2007 to $246,100. The figures can be influenced by changes in the mix of sales at the regional level. For that reason, economists prefer price measures that track the same house over time.

They never added that type of comment when prices fell. Still a lot of biased reporting out there.

One such gauge is the S&P/Case-Shiller index. Those figures, also reported today, showed house prices dropped 14.1 in the first quarter compared with the same period in 2007, the biggest decline since records began in 1988.

Much narrower market and different months

Sales of new homes were down 42 percent from April 2007, the biggest year-over-year decline since September 1981, the Commerce report showed.

Better to be 10 miles from hel_ and moving away from it than 100 miles away moving towards it.

Drop in Inventories
One bright spot is that inventories decreased. The supply of homes at the current sales rate dropped to 10.6 months’ worth from 11.1 months in March. The number of homes completed and waiting to be sold decreased to 181,000, the fewest since July.

Shortages looming as suggested in prior emails.

Purchases rose in three of four regions, led by a 42 percent jump in the Northeast. They increased 8.3 percent in the West and 5.8 percent in the Midwest. Purchases dropped 2.4 percent in the South.

Sales of previously owned homes, which account for about 85 percent of the market, fell 1 percent in April, and the supply of unsold properties reached a record, the National Association of Realtors said last week.

New-home purchases, which make up the remaining 15 percent of the market, are considered a timelier indicator because they are based on contract signings. Resales are calculated when a contract closes, usually a month or two later.

AP: California home sales up big

Just annecdotal, but guaranteed that if they were down that much it would be all over the news:

Home sales in California jump nearly 27 percent

by Jordan Robertson

SAN JOSE, Calif. (AP) – Home sales in California jumped nearly 27 percent from March to April as bargain hunters found it easier to get loans and pick up property on the cheap.

DataQuick Information Systems released statewide numbers Tuesday, after reporting similarly positive figures for the San Francisco Bay area, which saw a nearly 29 percent jump during the same period.

But home prices continue to drop around California, a sign that home owners are still finding it hard to unload their properties without steep discounts.
The median price paid for a home last month was $353,000 — down 1.1 percent from the month before and down nearly 27 percent from the year-ago period.

A total of 31,150 new and resale houses and condos were sold statewide last month.

Q&A for Warren B


[Skip to the end]

Hi Warren,

Do you think there is any chance that the Fed ever puts us into a steeply inverted curve, say something like 10% short rates with 6% long rates? Hard to imagine that happening with the housing market weak, but what do you think?

Very high probability – I’d say 85% chance if, as I expect, crude stays here or goes higher. maybe a lot higher.

Hiking causes inflation to accelerate via the cost structure of business, so when they start hiking, inflation accelerates. Guaranteed!

Only a major supply response will break the inflation. Like pluggable hybrids in 5-10 years or cutting the national speed limit to 30mph, which is highly doubtful.


[top]

2008-05-16 EU Highlights


[Skip to the end]

Only the rising euro has kept the ecb from hiking, so far.

Highlights

ECB’s Trichet Sees ‘Less Flattering’ Growth in Second Quarter
ECB concern over liquidity scheme
Trichet Says No Room to Relax in Inflation Fight
ECB’s Mersch Says Current Rates Will Help Curb Inflation
French First-Quarter Payrolls Grow at Slowest Pace Since 2006
Germany’s DIW Raises Second-Quarter Growth Forecast
ECB’s Constancio Sees Slowing European Growth in Second Quarter
Volkswagen, BMW Lead 9.6% Advance in European April Car Sales
Almunia Says `External Shocks’ Put `Upside’ Pressure on Prices
European Notes Head for Weekly Decline on Outlook for ECB Rates


[top]

Associated Press: Forclosures FALL 4% in February

Note the fact that foreclosures went down a tad in February versus January is buried at the end of the article.

Number of US homes facing foreclosure jumps nearly 60 percent in February

by Alex Veiga

(AP) Nearly 60 percent more U.S. homes faced foreclosure in February than in the same month last year, with Nevada, California and Florida showing the highest foreclosure rates, a research firm said Wednesday.

AP


A total of 223,651 homes across the nation received at least one notice from lenders last month related to overdue payments, up 59.8 percent from 139,922 a year earlier, according to Irvine, Calif.-based RealtyTrac.

Nearly half of the homes on the most recent list had slipped into default for the first time.

Nevada had the nation’s highest foreclosure rate, with one in every 165 households receiving at least one foreclosure-related notice. It had 6,167 properties facing foreclosure, a 68 percent increase from a year earlier and up 1 percent from January, RealtyTrac said.

Most of the troubled properties were located in California, Florida, Texas, Michigan and Ohio — states where home prices have plunged as the housing boom went bust.

The overall U.S. foreclosure rate last month was one filing for every 557 homes.

February’s total represents a 4 percent dip from January, but the decline was just a seasonal blip, said Rick Sharga, RealtyTrac’s vice president of marketing.

“We seem to be settling in at a new plateau in terms of monthly activity, but it’s a much higher plateau than we were at a year ago,” he said.