AP: Foreclosure digestive process at work

Prices stabilizing as volumes increase:

SoCal home prices fall in July, sales up

by Elliot Spagat

(AP) A research firm says Southern California home prices fell 31 percent in July from last year, while the number of homes sold hit its highest level since March 2007.

MDA DataQuick said in its report Monday that the median price for new and resale homes and condos dropped to $348,000 last month in the six-county region. That’s down from the market peak of $505,000 in July 2007 and down slightly from $355,000 in June.

The report says a total of 20,329 homes and condos were sold during the month, up 13.8 percent from July 2007 and up 16.7 percent from June.

It says foreclosures accounted for 43.6 percent of all resold properties last month, up from 7.9 percent in July 2007 and a revised 41.8 percent in June.

AGY MBS UPDATE: 08/12/08


[Skip to the end]

On Tue, Aug 12, 2008 at 5:18 PM, Andrew wrote:

AGY MBS UPDATE: 08/12/08

General Themes:

  • Mortgages were weaker to dealer hedge ratios – versus CXLs they were down only -5cents
  • The small CXL daily price change masks what was a pretty bad performance for mortgages
  • Dealer OAS’s are back to the wides of last week – Lehman has FN5.5 LOAS at +90bps
  • What could help mortgages?
  • Asian buying returning
  • Capital raising by the GSE’s, (or capital injection by Tsy)
  • Reduced capital surplus guidelines from OFHEO
  • Convexity led rally in rates

not to mention investors recognizing value vs tsy’s, atraight agency paper, quality AAA corporates, libor, and other lower yielding paper


[top]

Fed senior loan officer survey charts


[Skip to the end]

On Mon, Aug 11, 2008 at 1:25 PM, Karim writes:

  • Both lending standards and spds move up from cycle highs; appears defining aspect of the current episode may be the duration of tighter lending conditions (prior episodes approached current levels of tightness but were relatively short-lived).
  • Also of concern to Fed is chart on page 3 showing significant tightening of standards for prime residential mortgage loans (though all types of loans showed a deterioration)

http://www.federalreserve.gov/boarddocs/SnLoanSurvey/200808/charts.pdf

Yes, and note how housing showing strong signs of bottoming and GDP moving up at the same time.

Interesting to watch the blood flowing around the clot, as it necessarily does.

Though not without difficulty.


[top]

NYPost: Lost Sovereignity – There’s a new land grab


[Skip to the end]

Hope they don’t dig it up and take it home!

Lost Sovereignity

Oil-rich Fund Eyeing Foreclosed US Homes


By Teri Buhl

There’s a new land grab starting in America.

Foreign money, which up to now has focused its attention on investing in iconic commercial real estate – like Barneys New York and the Chrysler Building – is now moving to scoop up tens of thousands of discounted foreclosed homes across the country.

One sovereign fund, said to have earmarked $29 billion to purchase foreclosed residential real estate, recently hired a West Coast mortgage broker and is starting to search for bargains, The Post has learned.

The search, which is being carried out, in part, by Field Check Group mortgage consultant Mark Hanson, who was retained by the broker, Steve Iversen, is concentrating on single- and multi-family REO (real estate owned) homes, or homes that have already been taken over by the mortgagee.

Neither Iversen nor Hanson would disclose the name of the client, but sources told The Post it’s a sovereign fund.

The unidentified fund joins individual US investors, hedge funds and Wall Street banks in kicking the tires of REO homes, which have fallen in value so much that they are now tempting investments.

A sovereign fund would have two distinct advantages over other investors – the depressed value of the US dollar makes the homes a bargain, and sovereign funds have deeper pockets.

The sovereign fund of Abu Dhabi, for example, has a reported $875 billion in assets, while Norway has $391 billion, Singapore has $303 billion and Kuwait has $264 billion in their sovereign funds, which are funded by proceeds from oil sales.

The Abu Dhabi Investment Authority is expected to announce next month what type of US distressed assets they will be investing in and real estate is at the top of the list, according to a report in Financial Times last week.

ADIA did not respond to an e-mail question about REO investments.

So far, prices on bulk sales of REO properties vary based on location and are selling from 60 cents to 80 cents on the dollar. Hanson started out offering 40 cents on the dollar for about $2.5 billion worth of California properties owned by IndyMac and Washington Mutual but was turned down. The banks refused to comment.

Hanson is now willing to pay 50 cents to 60 cents on the dollar for a collection of California REOs worth at least $500 million.

In fact, this week Hanson’s team negotiated a $2 billion package mixed with homes across the country for 31 cents on the dollar. While progress seems slow, Hanson reminds us this is only a nine-month old industry.

Some market experts think such deeply discounted REOs, like the deal Hanson just closed, are more fiction than fact.

“The size and discount of that type of deal isn’t the norm yet,” said Robert Pardes, with Recourse Recovery Management Services, a provider of mortgage advisory services.

“The critical mass of bulk REO is in well-capitalized institutions that don’t need to sell yet in bulk at a deep discount because they are better off not taking substantial hits to the capital just to get the assets off their books,”

This may change, should the market become more crowded with bank failures and distressed institutions, he said.

Enoch Lawrence, senior vice president of CB Richard Ellis, says “This type of bulk buy would make an impact on the market. They are in a unique position because they have a long time horizon to invest and a cheap cost of capital. It’s actually a perfect time for them to acquire these REO assets.”


[top]

NYT: Mortgages


[Skip to the end]

(an email exchange)

>   
>   On Mon, Aug 4, 2008 at 7:50 AM, Russell wrote:
>   
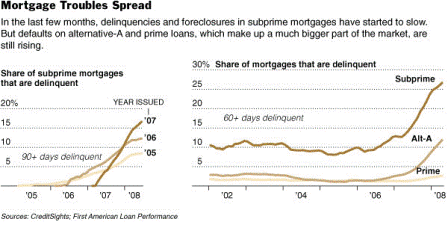
>   I am more and more convinced housing is not near a bottom.
>   Granted, I have no idea what the recent Housing Bill will do. But I
>   think housing problems are going to cover the entire swath of
>   America – not only Subprime, but also Alt A and even Prime.
>   
>   

could be, but would be very unusual in an economy with a growing gdp supported by what may now be endless fiscal packages.

the actual housing slump could be mostly old news unless/until gdp softens again as most are forecasting in q4.


[top]

2008-07-28 UK News Highlights


[Skip to the end]

Highlights:

U.K. Hometrack House Prices Fall the Most Since 2001
Brown Says He Won’t Turn to ’70s Agenda After Defeat
Darling Considers Expanding Mortgage Bond-Swap Scheme, FT Says


U.K. Hometrack House Prices Fall the Most Since 2001

by Brian Swint

(Bloomberg) The average cost of a residential property in England and Wales slipped 4.4 % in July from a year earlier to 168,500 pounds ($336,000), Hometrack Ltd. said. Prices fell 1.2 % from June. “With no immediate end in sight to the current uncertainty, activity levels are likely to remain suppressed with prices remaining under pressure into the autumn,” said Richard Donnell, director of research at Hometrack. Prices “are now back to levels last seen in October 2006.” Demand for housing has declined 20 % in the past three months, Hometrack said.

Note how much higher prices are vs the US.

It’s another case of going up very fast and now working its way down towards a more historically normal trend line.

But as in the US, they never come down quite that far before turning up on a new path from a higher base as much of past ‘inflation’ remains indefinitely.


[top]

CNBC: Housing bottom story


[Skip to the end]

His monetary analysis is ridiculous but we agree on this point:

The Media Are Missing the Housing Bottom

by Larry Kudlow

Media reports painted a pessimistic picture of today’s release on existing home sales, which fell 15 percent from a year ago and recorded higher inventories. But inside the report was an awful lot of very good new news, which appear to be pointing to a bottom in the housing problem; in fact, maybe the tiniest beginnings of a recovery.

For example, the median existing home price has increased four consecutive months and is up 10 percent since February. Yes, it’s down 6 percent over the past year. But the monthly numbers show a gradual rebound. Actually, this median home price is $215,000 in June, compared to $196,000 last winter.

And there’s more. One of the hardest hit regions is the West, including California, Arizona, and Nevada. The other two bad states are Florida and Michigan. However, existing home sales in the western region are up four straight months, and are 17 percent above the low in October. At the same time, prices in the West have increased three straight months.

Meanwhile, overall national existing home sales are basically stabilizing at just under five million. And in the first and second quarters of 2008, these sales dropped slightly by 3 percent in each case, which is a whole lot better than the roughly 30 percent sales drops of the prior three quarters.

It’s a pity the mainstream media keeps searching for more and more pessimism. The reality is a possible upturn in the housing trend, and at the very least we are getting a bottom. Stocks sold off 165 points largely on media reports of terrible home sales and prices. But I am hoping the market comes to its senses and realizes the data are a whole lot better.

related content
Senate Set to Vote Saturday On Housing Rescue Bill
Existing Home Sales: A Look At Numbers That Weren’t There

And on top of all that, just as housing may be on the mend, Congress is about to ratify a huge FHA-based bailout that could total $42 billion. Congressional solons are putting up $300 billion to refinance and insure distressed loans through the Federal Housing Administration. But this dubious government agency, with a whole history of bad portfolio management, may wind up taking in the very worst loans on the books.


[top]

Bloomberg: Apartment vacancy unchanged, rents rise

The drop in housing starts may be keeping the rental market tight, as about a 80,000 fewer new units are being built each month.

U.S. Apartment Vacancy Unchanged at 5.9 Percent, Rents Increase

(Bloomberg) The vacancy rate for U.S. rental apartment buildings was unchanged at 5.9 percent in the second quarter as the housing slump and a weakening economy deterred people from buying homes, Reis Inc. reported.

The average monthly U.S. asking rent rose 1 percent to $1,047, the 25th consecutive quarter that rents increased or stayed the same, according to Reis, a New York-based research firm.

Home prices in 20 U.S. metropolitan areas declined in April by the most on record and new home sales fell 40 percent in May from a year ago. The slumping housing market means apartment rents should remain steady even as gasoline prices rise and U.S. companies cut jobs, Sam Chandan, chief economist for Reis, said in an interview. Payrolls fell by 62,000 in June and 438,000 in the first half, the Labor Department said July 3.

“Our projection is rent growth will moderate through 2009, but we don’t think it will turn negative as it did in the early 2000s,” Chandan said. “The bias will be weighted toward rental, in our view. People fear home prices will fall further.”

The last time U.S. rents fell was the first quarter of 2002, when they declined by 0.2 percent, according to Reis.

The five-year housing boom that ended in 2006 attracted investment to homebuilding, so fewer apartment buildings were constructed, Chandan said.

“There has been very little apartment development because all the money was made in housing development,” he said. “We don’t have a strong pipeline of apartments.”

San Francisco
San Francisco asking rents grew the most in the second quarter from the previous 12 months, increasing 9.4 percent. New York gained 7.7 percent, Seattle rose 7.4 percent, San Jose, California increased 7.3 percent and Salt Lake City increased 6.1 percent, according to Reis.

New York had the highest average U.S. rent at $2,847 a month, followed by San Francisco at $1,825, Fairfield County, Connecticut at $1,757, Boston at $1,646 and Long Island, New York at $1,521, Reis said.

Orange County, California, ranked sixth at $1,520, followed by San Jose at $1,504, Northern New Jersey at $1,460, Ventura County, California at $1,409 and Los Angeles at $1,408, according to Reis.

New York had the lowest vacancy rate at 2.2 percent, followed by Long Island at 2.9 percent, Central New Jersey at 3 percent, San Jose at 3.2 percent and New Haven, Connecticut at 3.3 percent, Northern New Jersey at 3.5 percent, Syracuse, New York at 3.6 percent, San Diego and San Francisco at 3.8 percent and Minneapolis at 3.0 percent, Reis said.

2008-06-24 Daily US Economic Releases


[Skip to the end]


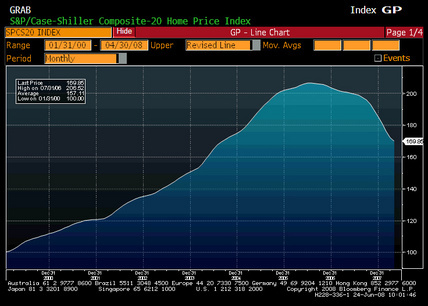
S&P/Case Shiller Home Price Index (Apr)

Survey
Actual 169.9
Prior 172.2
Revised 172.2

[top][end]


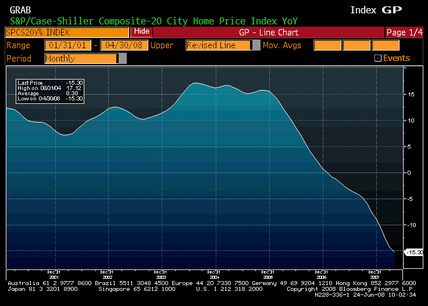
S&P/Case Shiller Composite 20 YoY (Apr)

Survey -16.0%
Actual -15.3%
Prior -14.4%
Revised -14.3%

Karim writes:

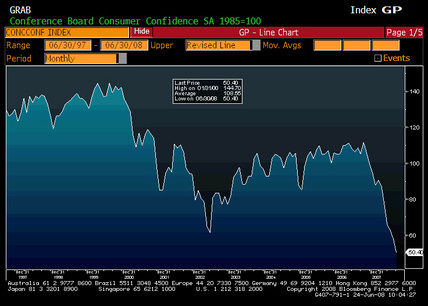
  • Conf board survey drops to 16yr low, from 58.1 to 50.4
  • Current conditions drop 9.7pts and future expectations fall 6.3pts
  • 1yr fwd inflation expex unch at 7.7
  • All following drop to new cycle lows
  • Jobs plentiful less jobs hard to get (-12.2 to -16.4; pretty good leading indicator of unemployment rate)
  • Plans to buy auto in next 6mths from 5.1 to 4.8
  • Plans to buy a home from 2.4 to 2.2
  • Plans for a domestic vacation from 33.4 to 29.6
  • Plans for foreign vacation from 8.2 to 7.5

Inflation is biting harder than the lower Fed funds rate is helping.

The Fed has to decide whether a slightly higher Fed funds rate will bring more relief/benefit to consumers on the inflation side than possible additional drag from the interest rate side.
[top][end]


Consumer Confidence (Jun)

Survey 56.0
Actual 50.4
Prior 57.2
Revised 58.1

[top][end]


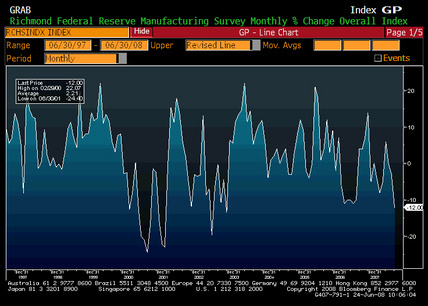
Richmond Fed Manufacturing Index (Jun)

Survey -5
Actual -12
Prior -5
Revised n/a

Not looking good.

Weakness and ‘inflation’ continue.
[top][end]


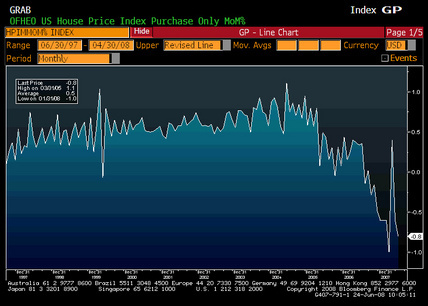
House Price Index MoM (Apr)

Survey -0.4%
Actual -0.8%
Prior -0.4%
Revised -0.6%

Back down, but at least not through the lows.

[top][end]


ABC Consumer Confidence (Jun 22)

Survey
Actual
Prior -44
Revised


[top]

2008-06-23 Valance Weekly Economic Graph Packet


[Skip to the end]

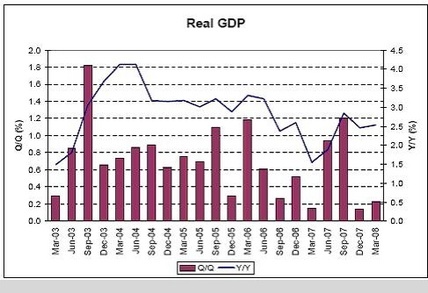
Real GDP

Can you find the recession? Year over year will be reasonable until last year’s large Q3 number drops out without similar sized q3 this year.
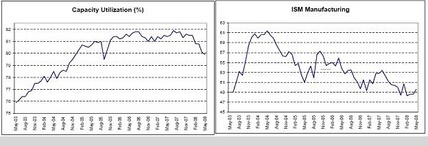


Capacity Utilization, ISM Manufacturing

Down but not out as GDP muddles through.
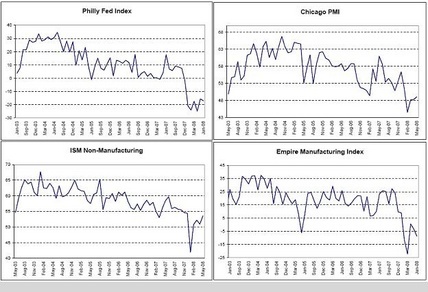


Philly Fed Index, Chicago PMI, ISM Non-Manufacturing, Empire Manufacturing Index

Limping along, but off the lows
The survey numbers seem to be depressed by inflation.
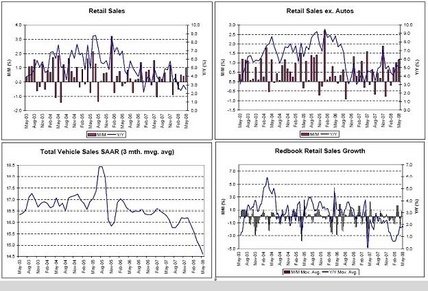


Retail Sales, Retail Sales Ex Autos, Total Vehicle Sales, Redbook Retail Sales Growth
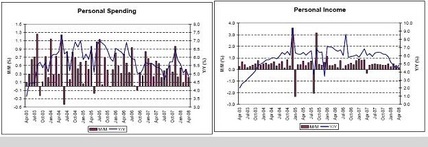


Personal Spending, Personal Income

Apart from cars and trucks, retail muddling through, and getting some support from the fiscal package.
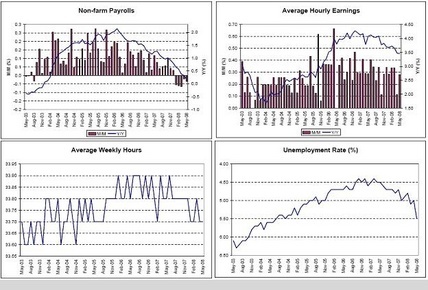

Non-farm Payrolls, Average Hourly Earnings, Average Weekly Hours, Unemployment Rate

Certainly on the soft side, but still positive year over year, earnings still increasing, and unemployment still relatively low (the last print was distorted a couple of tenths or so by technicals).
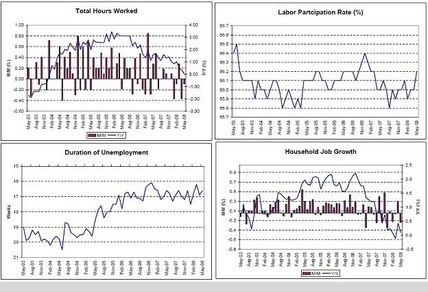

Total Hours Worked, Labor Participation Rate, Duration of Unemployment, Household Job Growth
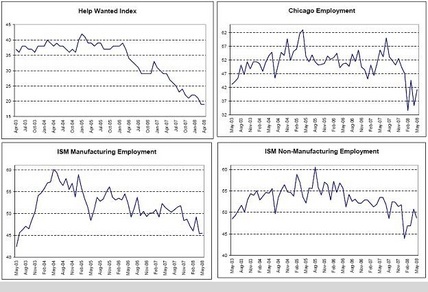

Help Wanted Index, Chicago Unemployment, ISM Manufacturing Employment, ISM Non-Manufacturing Employment
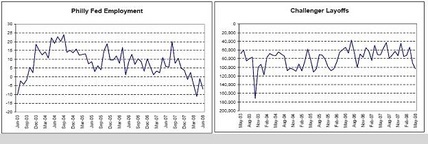

Philly Fed Employment, Challenger Layoffs

Most of the labor indicators are on the weak side, but not in a state of collapse. And GDP is picking up some from the fiscal package which should stabilize employment.
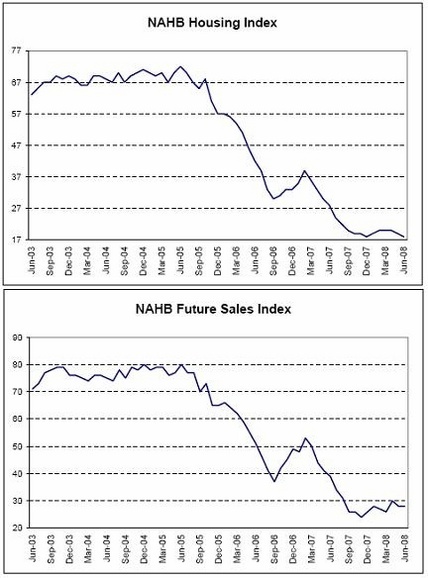

NAHB Housing Index, NAHB Future Sales Index
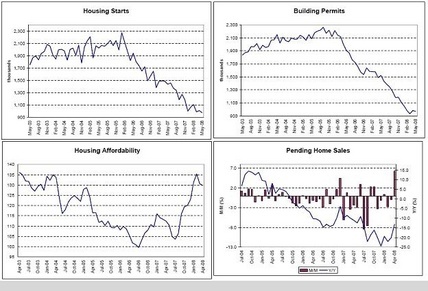

Housing Starts, Building Permits, Housing Affordability, Pending Home Sales

Leveling off to improving a touch.
Housing is still way down and could bounce 35% at any time.
And still be at relatively low levels.
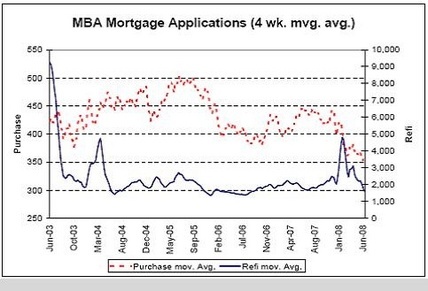

MBA Mortgage Applications

Mortgage apps are down but they are still at levels previously associated with 1.5 million starts vs today’s approx 1 million starts (annual rate).
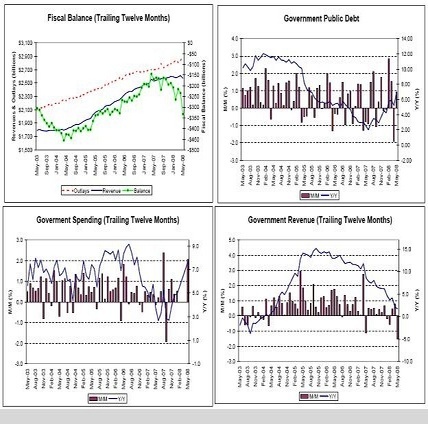

Fiscal Balance, Govt Public Debt, Govt Spending, Govt Revenue

It’s an election year, and here comes the Govt. spending which is already elevating GDP.
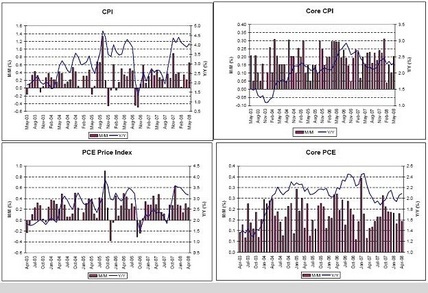

CPI, Core CPI, PCE Price Index, Core PCE
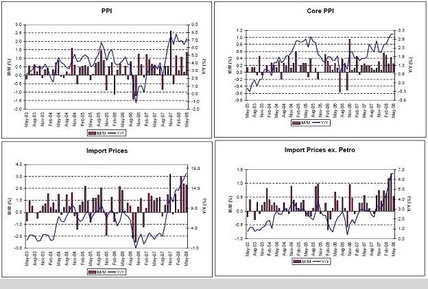

PPI, Core PPI, Import Prices, Import Prices Ex Petro
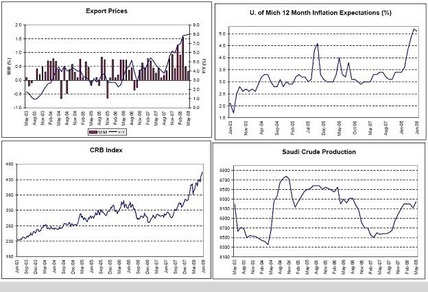

Export Prices, U of Michigan Inflation Expectations, CRB Index, Saudi Oil Production

The ‘inflation’ is only going to work its way higher as it pours through the import and export channels.
And with Saudi production completely demand driven, there’s no sign of a fall off of world demand for crude at current prices.
Yes, the world’s growing numbers of newly rich are outbidding America’s lower income consumers for gasoline, as US demand falls off and rest of world demand increases.
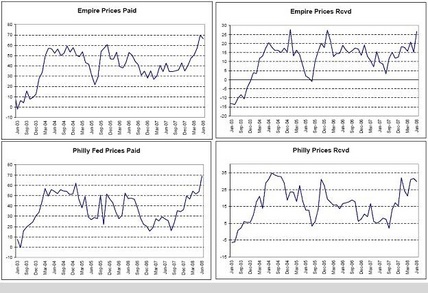

Empire Prices Paid, Empire Prices Received, Philly Fed Prices Paid, Philly Prices Received

All the price surveys are pretty much the same as ‘inflation’ pours in.
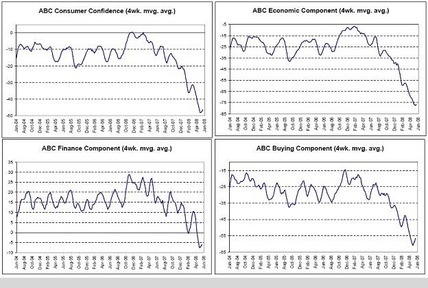

ABC Consumer Confidence, ABC Econ Component, ABC Finance Component, ABC Buying Component

And all the surveys look pretty much the same as ‘inflation’ eats into confidence
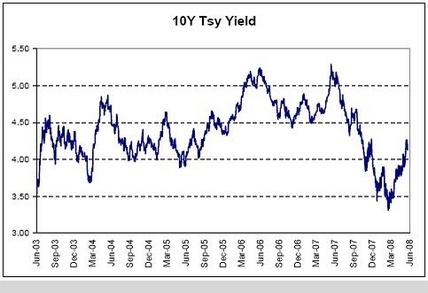

10Y Tsy Yield

And with all the weakness rates have generally moved higher as it seems inflation is doing more harm than ultra low interest rates are helping, perhaps causing the Fed to reverse course.
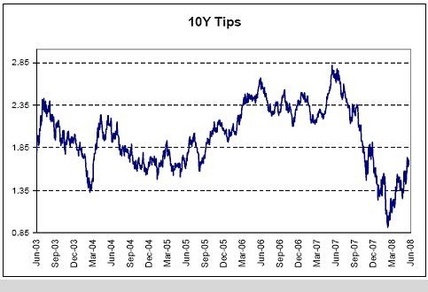

10Y Tips

The TIPS market has been discounting higher ‘real’ rates from the Fed.
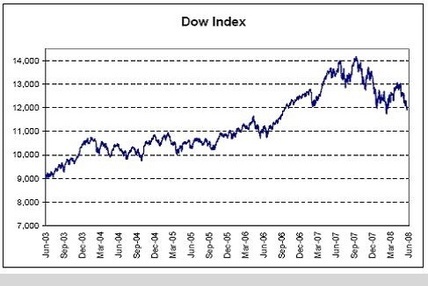

Dow Index

Even as stocks look to test the lows

[top]