mtg purchase apps fall again…

>   
>   (email exchange)
>   
>   Seems like Bullard is calming mkt down ahead of bernankes testimony
>   

FED’S BULLARD:WOULD GET WORRIED IF INFL FALLS BELOW 1% – MNI


BULLARD:NO NEED TO REDUCE VOLUME OF BOND-BUYING IN NEAR TERM – MNI

Right
Some of the headline hawks suddenly turned a bit dovish.
And yellen got a bit more hawkish?
Seems they are converging?

Bernanke has to make the case that weakness justifies QE if he wants to do it to keep mtg rates down, which he does. He doesn’t want housing to sag and then get blamed. Recall that part of the QE logic last year was to try to stay ahead of the cliff risks as much as possible. But he also has to ‘manage expectations’ in that he believes if he is negative on the economy his take can cause it to sag.

Tough spot.

And, ironically, the macro back drop of course is that QE removes interest income from the economy, with MBS having the highest coupons.

So stocks rally as portfolio indifference levels adjust to the mistaken belief that QE somehow supports stocks, when in fact it’s doing the opposite, which shows up in weak top line growth/weak nominal GDP and weak earnings growth, etc.

And currently it’s all in the context of the deficit perhaps getting too small to support the kind of private sector credit growth necessary to overcome the demand leakages (including the recent proactive govt deficit reduction) and print positive GDP numbers.

Mortgage Applications Tumble as Interest Rates Jump

May 22 (Reuters) — Applications for home mortgages dropped for a second week in a row last week as a spike in interest rates stymied demand for refinancing, data from an industry group showed on Wednesday.

The Mortgage Bankers Association said its seasonally adjusted index of mortgage application activity, which includes both refinancing and home purchase demand, tumbled 9.8 percent in the week ended May 17.

The index of refinancing applications slumped 11.7 percent, while the gauge of loan requests for home purchases, a leading indicator of home sales, fell 3 percent.

Yes, I know it’s not all that good of an indicator, but it’s an indicator nonetheless.

US consumers keep spending despite reduced pay

This is the current thinking, but the pieces don’t add up?
Hoping I’m being too negative here…

Comments below:

US consumers keep spending despite reduced pay

By Christopher S. Rugaber

April 29 (AP) — This year got off to a sour start for U.S. workers: Their pay, already gasping to keep pace with inflation, was suddenly shrunk by a Social Security tax increase.

Which raised a worrisome question: Would consumers stop spending and further slow the economy? Nope. Not yet, anyway.

On Friday, the government said consumers spent 3.2 percent more on an annual basis in the January-March quarter than in the previous quarter the biggest jump in two years. It highlighted a broader improvement in Americans’ financial health that is blunting the impact of the tax increase and raising hopes for more sustainable growth.

Yes, but the ‘slope’ has been negative, with March way down.

Consumers have shed debt. Gasoline has gotten cheaper. Rising home values and record stock prices have restored household wealth to its pre-recession high. And employers are steadily adding jobs, which means more people have money to spend.

Sort of. There have been new jobs, but often at lower pay, and the participation rate has continued to fall. Rising home values are from very low, foreclosure depressed levels, and reports show substantial negative equity remains. And it seems that while total household wealth may be back to the highs, the ‘1%’ has benefited disproportionately.

“No one should write off the consumer simply because of the 2 percentage-point increase in payroll taxes,” says Bernard Baumohl, chief economist at the Economic Outlook Group. “Overall household finances are in the best shape in more than five years.”

Yes, better than 08 after the crash, but still marginal. Debt is down, but take home pay vs the cost of living isn’t doing all that well.

Certainly, spending weakened toward the end of the January-March quarter. Spending at retailers fell in March by 0.4 percent, the worst showing in nine months. And more spending on utilities accounted for up to one-fourth of the increase in consumer spending in the January-March quarter, according to JPMorgan Chase economist Michael Feroli, because of colder weather.

Higher spending on utilities isn’t a barometer of consumer confidence the way spending on household goods, such as new appliances or furniture, would be.

Right. Not good and the slope is negative.

Americans also saved less in the first quarter, lowering the savings rate to 2.6 percent from 3.9 percent in 2012. Economists say that was likely a temporary response to the higher Social Security tax, and most expect the savings rate to rise back to last year’s level. That could limit spending.

‘Saving less’ generally takes the form of ‘borrowing more’, in this case to pay utility bills and make up for the income lost to the tax hike, which is not sustainable.

But several longer-term trends are likely to push in the other direction, economists say, and help sustain consumer spending. Among those trends:

Wealth is up

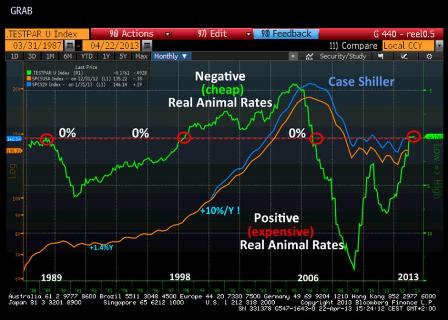
Home prices rose more than 10 percent in the 12 months that ended in February. And both the Dow Jones industrial average and Standard & Poor’s 500 stock indexes reached record highs in the first quarter. As a result, Americans have recovered the $16 trillion in wealth that was wiped out by the Great Recession.

Again, skewed to the higher income groups who’s ‘consumer spending’ wasn’t all that sensitive to income in any case.

Economists estimate that each dollar of additional wealth adds roughly 3 cents to spending.

Or is it every 3 cents in spending adds a dollar of additional wealth?

That means last year’s $5.5 trillion run-up in wealth could spur about $165 billion in additional consumer spending this year. That’s much more than the $120 billion cost of the higher Social Security taxes.

Or the 120 billion tax hike will reduce wealth by $5.5 trillion from where it would have been otherwise?

‘The wealth’ has to ‘come from’ somewhere. In this case, so sustain spending, non govt debt would have to climb that much more just to make up for the tax hike. It’s possible, but working against that happening is the lower after tax income makes it harder to qualify for new debt, even if you wanted to.

Debt is down

Household debt now equals 102 percent of after-tax income, down from a peak of 126 percent in 2007. That’s almost back to its long-term trend, according to economists at Deutsche Bank.

And so why should it grow faster than the long term trend? The burst last time around was from the sub prime fraud. Before that the .com nonsense and the Y2K scare. Before that the expansion phase of the S&L fraud. And it won’t happen this time if we’re careful to not allow a credit expansion we’ll later regret…

And households are paying less interest on their debts, largely because of the Federal Reserve’s efforts to keep borrowing rates at record lows.

And earning less on their savings. Households are net savers.

The percentage of after-tax income that Americans spent on interest and debt payments dropped to 10.4 percent in the October-December quarter last year. That’s the lowest such figure in the 32 years that the Federal Reserve has tracked the data.

And personal income from interest has likewise dropped, and probably more so.

Jobs are up

Employers have added an average of 188,000 jobs a month in the past six months, up from 130,000 in the previous six. Job gains slowed in March to only 88,000.

Yes, negative slope again. And not even beginning to close the output gap.

But most economists expect at least a modest rebound in coming months. And layoffs sank to a record low in January. Fewer layoffs tend to make people feel more secure in their jobs and more willing to spend.

Gas prices are down

Gasoline prices have fallen in the past year and are likely to stay low. Nationwide, the average price of a gallon of gas has dropped 28 cents since this year’s peak of $3.79 on Feb. 27. Analysts expect gas to drop an additional 20 cents over the next two months. Each 10 cent drop over a full year translates into roughly $13 billion in savings for consumers.

Yes, that helps, except gas prices have been going back up most recently.

Loan costs are down

Lower interest rates have enabled millions of Americans to save money by refinancing their mortgages. Mortgage giant Freddie Mac estimates that in the fourth quarter of 2012, homeowners who refinanced cut their interest rate by one-third, the biggest reduction in 27 years the agency has tracked the data. On a $200,000 loan, that means $3,600 in savings over the next 12 months.

And savers are losing that much.

Some economists note that the Social Security tax cut didn’t spur much more spending when it first took effect at the start of 2011. The tax cut gave someone earning $50,000 about $1,000 more to spend each year. A household with two high-paid workers had up to $4,500 more.

Despite the tax cut, Baumohl notes that consumer spending rose only 2.5 percent in 2011 and 1.9 percent in 2012. In the 10 years before the recession began in December 2007, the average annual spending increase was 3.4 percent.

And a study by the Federal Reserve Bank of New York found that consumers spent only 36 percent of the increased income that resulted from the tax cut. The rest went to paying down debt or to savings.

Ok, so the question is whether with the tax hike they will cut spending or consume from borrowing and dipping into savings. Initially that’s what happened, but seems by March the increasing consumption had started to fade?

And the sequesters hadn’t even begun.

Since the tax cut didn’t boost spending that much, its expiration may not drag it down much, either. Economists say temporary tax cuts are often ineffective because many consumers assume that the tax breaks will eventually disappear. So they don’t ramp up spending in response.

As just discussed. It’s not necessarily symmetrical.

Scott Loehrke, 25, hasn’t cut back spending this year. Loehrke went ahead in March with some car repairs that could have been delayed. And he still plans to vacation in May in Mexico with his wife, Jackie.

The couple, who live just outside Cleveland, feel secure in their jobs. Loehrke is a salesman for a company that makes T-shirts, cups, key chains and other promotional products. Business has picked up in the past year as the economy has improved. His wife is a pharmacist.

“Everything that we’ve planned to do we’re still doing,” Loehrke says.

That proves their case!!!
:(

The Loehrkes both have heavy student debt and so are focused on keeping their expenses in check. They both drive used cars. That’s enabled them to build up some savings and made it easier to absorb the tax increase.

New threats have emerged. Across-the-board government spending cuts kicked in March 1. The spending cuts have triggered government furloughs and could lead private companies that do business with the government to cut staff. And the cuts are expected to shave a half-point from economic growth this year.

And that’s just the first order effect.

Even so, most economists are relieved that consumers have proved so resilient so far.

“It’s very encouraging that consumers and thus the broader economy have been able to weather that storm as well as they have,” says Mark Zandi, an economist at Moody’s Analytics.

‘The beatings will continue until morale improves’

Housing Rebound in U.S. Hampered by Success as Costs Soar

I still don’t see used home prices anywhere near ‘replacement cost?’

So prices have to go up quite a bit (and affordability go down) for a serious building boom to start?

Even as U.S. housing rebounds from its worst downturn since the 1930s, production bottlenecks are pushing up building-materials costs, land prices are rising and skilled labor ready to begin work is hard to find.

Housing Rebound in U.S. Hampered by Success as Costs Soar

By Shobhana Chandra & John Gittelsohn

April 24 (Bloomberg) — Even as U.S. housing rebounds from its worst downturn since the 1930s, production bottlenecks are pushing up building-materials costs, land prices are rising and skilled labor ready to begin work is hard to find.

Suppliers of glass, drywall and wood products, who reduced output during the slump, are testing the vigor of the rebound by boosting prices before committing to restore capacity. Builders, including Lennar Corp. (LEN), Toll Brothers Inc. (TOL) and KB Home, are asking homebuyers for more money as a result or are delaying sales, posing a temporary hurdle for the industry that has become one of the pillars of the economic expansion.

Building-material manufacturers are raising prices dramatically, and once theyre convinced that these prices are going to stick, theyll start reinvesting in those plants, helping ease supply constraints, said John Burns, chairman of Irvine, California-based John Burns Real Estate Consulting, which provides research to developers, construction-product manufacturers and investors. Those can take a year to get up and running.

In a sign demand remains strong, a report yesterday showed sales of new houses advanced in March, capping the best quarter for the industry since 2008. Purchases of new single-family properties climbed 1.5 percent to a 417,000 annual pace, the Commerce Department said.

Thaler’s Corner 04-22-2013 2013: And now?

Again, very well stated!

Thaler’s Corner

I must admit that I am at a loss for words these days. The analytical items at our disposal describe a situation so complex, given a myriad of contradictory influences, that I find it impossible to develop any sort of reasonable scenario.


I have spent a lot of time in recent weeks exchanging ideas and perceptions with academics, political officials and others in an effort to develop a coherent explanation of the events unfolding before us (Cyprus, wealth tax, etc.), but the conclusions are anything but conclusive!

Changes in financial securities will no longer be determined by purely economic factors but more and more by political decisions, such as whether or not to establish a real European banking union with all that implies in terms of cross-border budget transfer risks.

Whatever, lets take a look at the state of the real economy in the United Sates and Europe, given that it is still a bit early to draw any sort of conclusions about a third economic motor, Japan.

By the way, I strongly recommend that people check out the links in todays Macro Geeks Corner toward the end of the newsletter. It is interesting to see how two fairly divergent schools of thinking (the two first texts) end up with rather similar conclusions.

United States

In the United States, the economy is (logically) slowing as the effects of the Sequester slowly make themselves felt. Only the (increasingly discredited) partisans of Reinhold & Rogoffs constructive austerity thought it would not affect household consumption.

We had to wait for the hike in payroll taxes for the effect to be seen in retail sales figures, down 0.4% in March. Similarly, all the latest leading economic (PMI) and confidence indicators came in below expectations, which augurs for a soft patch in the US.

Moreover, the yens decline can only have a negative impact on America trade balance with Japan as it puts US exporters at a disadvantage, in particular, as they compete with their Japanese rivals on Asian markets. And the pitiful state of the European economy is not going to help this sector of the US economy either.

But there remains one bright spot, namely the residential real estate market, which should remain a powerful support in the quarters ahead. Check out one of my favorite graphs real animal rates.

Real animal rates in the US:


Full size image

These rates are calculated using a proprietary equation I developed, which includes, in addition to terms like mortgage interest rates, recent home price trends, the difference between the reported unemployment rate and that during periods of full employment, and the difference between the average length of unemployment and that existing in times of full employment.

With the Animal Spirits so dear to Keynes and behavioral science in mind, the goal was to factor in items more subjective than simple economic criteria (nominal borrowing rates) in the home purchase decision-making process of a household.

If experience has taught us anything, it is that the factors which most influence a potential homebuyers decision is his degree of job security and the feeling that prices can only rise.

The first point is that the only time these real animal rates dipped into negative territory (in the upper part of graph, transcribed in inverted scale) corresponds perfectly with the great real estate bubble of 1998 to 2006.

This big trend reversal occurred in 2006 when rates resurfaced above zero and thus below the graphs red line.

The only other time real animal rates became negative was in 1989, but that was abruptly reversed by the sharp hike in nominal interest rates.

In the current context, nominal interest rates are unlikely to undergo any such sharp hike in the quarters ahead, and this dip of real animal rates into negative territory should enable the real estate market to continue to recover. This all the more true, given that the yens decline will only strengthen disinflationary trends in North America, which ensure accommodative monetary policies for some time to come!

All you need to do is look at the steep decline in inflationary expectations, as expressed by the TIPS market in the US, to understand that investors seem to have finally realized that QE policies have nothing to do with the so-called dollar printing press. Notwithstanding the ZeroHedge paranoids!

That said, existing home sales in the US, out just a few minutes ago, came in weak, at -0.6% m-o-m (vs expected +0.4%, i.e. 4.92M vs 5M), which explains this afternoon shiver on stockmarket indices.

Now, as the IMF has said in recent days, the main brake on a worldwide recovery is the Eurozone, which remains paralyzed by the obsession of its northern member states on austerity and by the ECBs total and unforgivable incapacity to comply with its own mandate! In todays Macro Geeks Corner, you will find two instructive links on this matter.

Eurozone

Instead of harping on the endless stream of errors made by our beloved European monetary and governmental leaders, I prefer to comment on some far more instructive graphs.

Lets start with our graph on aggregate 2-year Eurozone government bond rates, which have proven to be so useful in recent years for evaluating the ECBs reaction function.

This rate, currently at a record low 0.55%, is now well below the 0.75% set for the refi. This stems from two factors.

First, in view of the state of the economy and the latest comments by certain ECB board members, investors expect that the refi rate will very soon (May or June) be cut to 0.50%.

Second, certainty that short-term interest rates, like the Eonia, which have been stuck between 5 bps and 12 bps for the past 9 months, are not going to rise anytime soon is pushing investors to seek yields wherever they can still find them, like in Spain and Italy where 2-year bonds still fetch between 1.95% and 1.25%, now that they are assured that, henceforth, in case of insolvency, bank depositors will be forced to pay the bill without pushing sovereign issuers into default, as happened in Greece!

Aggregated Eurozone government 2-year rate:

Full size image

However, we have reason to be concerned that the ECB, if it does lower the refi to 0.50%, will be satisfied with what it already deems a low rate and highly accommodative monetary policy. Such is far from being the case, even if we go by the ECBs own obsolete aggregates, like M3, as money velocity continues to skid to a halt, following Cyprus.

And all this has an impact on the real economy, as you can see in the following graphs.

Eurozone Industrial Production

Full size image

The least we can say is that this graph is particularly distressing. Of course, it does not account for the economys industrial aspect, which some call the old economy. But it provides a whole lot of jobs and no economic area can afford to neglect it.

And the impact of Mr Sarkozys renowned Walk of Canossa, following his summons by Ms Merkel in July 2011 to Berlin where the unfortunate decision to create the first sovereign default of a developed country was endorsed (Greek PSI), is very clear on this graph. Together with a hardening of austerity policies and the nefarious consequences of the ECBs hikes of benchmark interest rates in the spring of 2011, this decision torpedoed already distressed economies, with the consequences we all know today.


But if there is one depressing economic indicator, which reflects even more cruelly how austerity affected the Eurozone, it is surely the unemployment curve.

Eurozone Unemployment

Full size image

Here again, no comment is needed. I included earlier in this newsletter the graph comparing the US and Eurozone curves, but even that is no longer all that relevant. If people are happy to underperform the United States, who cares? If the Eurozone wants to try liquidationist economic policies to help drive home the morality message, it has every right to do so, just as its citizens merit the leadership they elect.

But to go from there to creating a situation of hysteria, leading to an increasingly large segment of the active population being ejected from the labor market, is a big step that must never be taken.

In some countries, the figures are just horrifying, with nearly 30% general unemployment and over 50% for those under 25 years of age. It is incredible that some continue to boast the merits of such policies for countries like Ireland while ignoring the daily siphoning of the population due to massive immigration to seek jobs elsewhere!!

I wonder if those responsible for such policies have forgotten the consequences of such an approach in Europe and the breakdown in the social fabric during the Great Depression, especially now, with so many leaders spicing their speeches with anti-German references?

This pathetic situation, reflecting month after month of economic policies based on no worthwhile or credible foundations, be it on a theoretical or empirical basis, explains why I am having a hard time re-establishing a decent pace of publication.

This is especially so in that the conflict between this depressive macro situation and the strong efforts undertaken by the Fed and the BoJ (among others) to reignite economic activity leave no space for laying out clear asset allocation biases.

We continue to enable our clients to take advantage of opportunities on option markets which make it possible during these troubled times to make bets on the cheap but without any real conviction.

Has our asset allocation strategy, dating from 2007 (a bit early, I know), of favoring government debt came to maturity with German 10-year rates at 1.23%, i.e. more than 30 bps below those of the United States?

Will European stock markets continue to suffer from our big fear, the Japanese syndrome? Or will popular pressure push the ECB and the Austrian School proponents to realize that they have a modern currency at their disposal and that reversing their entire intellectual edifice is possible?


Despite all my efforts, studies, reading and discussion, I am totally incapable of responding to these questions, which a great lesson in humility. Sorry for the consequences in terms of this newsletters clarity and frequency of publication, but if anyone has any ideas, I am all ears!

The Macro Geeks Corner:

Dear Northern Europeans Monetary easing is not a bailout

A factual rebuttal of remarks of ECB chief Jrg Asmussen, made at the Bank of America/Merrill Lynch Investor conference

Breaking bad inflation expectations