Empire survey, IP, homebuilder’s survey

Empire State Mfg Survey


Highlights
Steady but slow is the indication from the Empire State index which is up slightly this month, to 5.61 from 4.48 in February. New orders also show a slight increase, to 3.13 vs last month’s slightly contractionary reading of minus 0.21, as do shipments, at 3.97 vs 2.13. Growth in the sample’s employment reading slowed, to 5.88 from 11.25.

Other readings include a rise in inventories and a sizable draw in backlog orders. Price readings, despite this month’s rise in fuel costs, show easing pressure. Readings on the six-month outlook are a little less optimistic than prior months.


Full size image

This always seems to chug along at about 3% and doesn’t say much about anything else:

Industrial Production


Highlights
Capacity utilization Consensus Forecast for February 14: 78.6 percent
Range: 78.4 to 78.8 percent

Industrial production was unexpectedly strong in February and utilities actually tugged down on the latest number. Industrial production rebounded 0.6 percent after dipping 0.2 percent in January. Market expectations were for a 0.3 percent gain.

By major components, manufacturing jumped 0.8 percent in February, following a 0.9 percent drop the month before. Mining rose 0.3 percent, following a 0.5 percent boost in January. Utilities slipped 0.2 percent after a 3.8 percent surge the prior month.


Full size image

So the challenge for 2014, at least so far, is to overcome drops in the growth of autos and housing vs 2013:

Housing Market Index


Highlights
The housing market index failed to bounce back much from February’s record loss, coming in at a lower-than-expected 47 for only a 1 point gain. Details for March once again show serious weakness in traffic, at 33 vs February’s 31. Weakness in traffic points to a lack of first-time buyers and underscores the continued importance of all cash buyers in the housing market.

Other details are on the plus side of 50 to indicate monthly growth but just barely, at 52 for current sales and 53 for future sales. The regional breakdown shows little separation except for the Northeast which lags badly but which however is by far the smallest region for new homes.

New home sales, which had been badly depressed, surged in January but this report points only to incremental growth for February and March. And the traffic component of this report points to a lack of sales growth in the months ahead. Watch for housing starts and permit data tomorrow morning on the Econoday calendar, both of which are expected to bounce back.

ADP, purchase apps, ISM

Prior months revised down as well:

ADP:

MBA Purchase Applications:

Highlights
Wild swings appear to be the rule for weekly mortgage application data. The purchase index jumped 9.0 percent in the February 28 week following declines of 4.0 percent and 6.0 percent in the two prior weeks. Though the latest week is higher, the year-on-year rate fell 4.0 percentage points to minus 19 percent. The refinance index jumped 10.0 percent in the week following an 11.0 percent decline in the prior week.

The latest week got a lift from a drop in mortgage rates, down 6 basis points for 30-year conforming mortgages ($417,500) to an average 4.47 percent.

It’s hard to make much of this report, but the year-on-year rate for purchase applications does point to continued weakness for home sales.

In particular, there was a significant drop in the employment index, which plunged 8.9 points to 47.5. This is its lowest level since 2010 and commentary from respondents suggests that some of this effect could be due to the implementation of the Affordable Care Act.

Outside of the employment index, however, the new orders index climbed to 51.3 (previous: 50.9), and the headline index has now remained above the breakeven level of 50 for 49 consecutive months. Overall we would suggest that this is a softer report than January, but we do not yet think that it marks a significant slowdown in the pace of nonmanufacturing activity growth.

Note export orders down again.

Forecasters have been counting on an increase in export growth:


Full size image

Lawler on Hovnanian: Net Home Orders Far Short of Expectations; Sales Incentives Coming

By Bill McBride

March 5 — From housing economist Tom Lawler:

Hovnanian Enterprises, the nations sixth largest home builder in 2012, reported that net home orders (including unconsolidated joint ventures) in the quarter ended January 31, 2014 totaled 1,202, down 10.6% from the comparable quarter of 2013. The companys sales cancellation rate, expressed as a % of gross orders, was 18% last quarter, up from 17% a year ago. Home deliveries last quarter totaled 1,138, down 4.2% from the comparable quarter of 2013, at an average sales price of $351,279, up 6.1% from a year ago. The companys order backlog at the end of January was 2,438, up 6.0% from last January, at an average order price of $368,243, up 4.3% from a year ago.

Hovnanians net orders in California plunged by 43.4% compared to a year ago. Hovnanians average net order price in California last quarter was $653,366, up 46.8% from a year ago and up 83.2% from two years ago. Net orders in the Southwest were down 10.0% YOY.

Here is an excerpt from the companys press release.

“While our first quarter is always the slowest seasonal period for net contracts, the strong recovery trajectory from the spring selling season of 2013 has softened on a year-over-year basis. Net contracts in the months of December, January and February have not met our expectations. In addition to the lull in sales momentum, both sales and deliveries were impacted by poor weather conditions and deliveries were further impacted by shortages in labor and certain materials in some markets that have extended cycle times,” stated Ara K. Hovnanian, Chairman of the Board, President and Chief Executive Officer.

“We are encouraged by the fact that we have a higher contract backlog, gross margin and community count than we did at the same point in time last year. Furthermore, we have taken steps to spur additional sales in the spring selling season, including the launch of Big Deal Days, a national sales campaign during the month of March. Our first quarter has always been the slowest seasonal period and we expect to report stronger results as the year progresses. We believe this is a temporary pause in the industry’s recovery, and based on the level of housing starts across the country, we continue to believe the homebuilding industry is still in the early stages of recovery,” concluded Mr. Hovnanian.

A few comments on overnight news

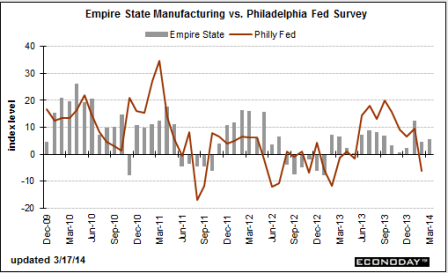
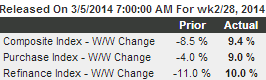
The threshold may be high but there is one somewhere up there:

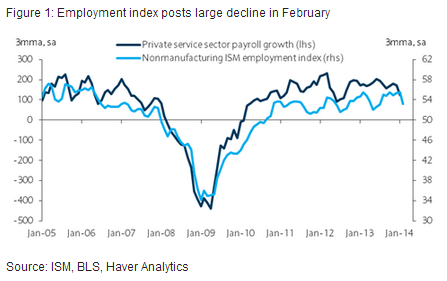
Fed should be ‘very patient’ in cutting stimulus: Rosengren (Reuters) The high number of part-time workers who would rather work full-time, the still-high unemployment rate, and very low inflation suggest significant “slack” in labor markets and “call for a very patient approach to removing monetary policy accommodation, particularly given the softness in recent economic data,” Boston Federal Reserve Bank President Eric Rosengren said. Rosengren said that it has been difficult for economists to determine whether weak employment reports for the past two months have been influenced bad weather or if they reflect an economic slowdown, and predicted that harsh winter weather will make the February jobs report similarly difficult to interpret. “In my view, this uncertainty provides an additional strong rationale for taking a patient approach to removing the monetary policy accommodation that the Federal Reserve has been deploying.”

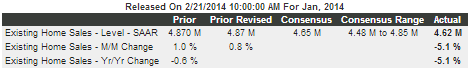
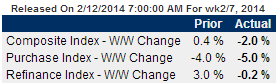
These are closings from contracts signed months earlier:

New home sales hit five-and-a-half year high in January (Reuters) Sales of new U.S. single-family homes jumped 9.6 percent to a seasonally adjusted annual rate of 468,000 units. December’s sales were revised up to a 427,000-unit pace from the previously reported 414,000-unit rate. Sales in the Northeast soared 73.7 percent to a seven-month high, while the South recorded a 10.4 percent rise in transactions to a more than five-year high. Sales tumbled 17.2 percent in the Midwest last month, while rising 11 percent in the West. New home sales rose 2.2 percent compared with January 2013. For all of 2013. Last month, the supply of new houses on the market was unchanged at 184,000 units. The median price of a new home last month rose 3.4 percent to $260,100 from January 2013. At January’s sales pace it would take 4.7 months to clear the supply of houses on the market.

I still suspect some of the q4 activity was ahead of expiring tax credits:

Hope on Horizon for Home-Supply Crunch: Builder Borrowing Picks Up (WSJ) Data released Wednesday by the Federal Deposit Insurance Corp. show that the outstanding balance on loans for land acquisition, development and construction rose in the fourth quarter to $209.9 billion, compared with $206 billion in the third quarter. Last year, the average price of a new U.S. home was $322,100, up 10.2% from 2012. The latest increase in construction lending “is an encouraging signal,” said David Crowe, chief economist for the National Association of Home Builders. But lending remains far from peak, as outstanding land and construction loans topped out at $631.8 billion in the first quarter of 2008. According to the FDIC, outstanding loans solely for construction of homesexcluding development, land acquisition and commercial projectsincreased to $43.7 billion in the fourth quarter, up from a recent low of $40.7 billion in last year’s first quarter.

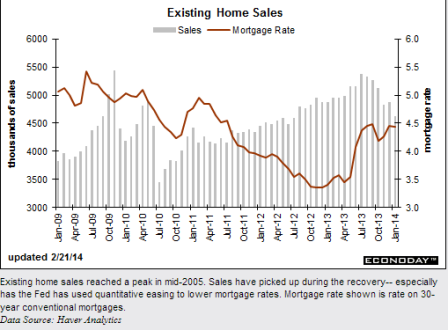
This helps support prices but doesn’t directly add much to GDP apart from commissions etc. unless it’s new construction:

Foreign appetite for US properties remains strong (FT) Last year the US maintained its position as the top destination for direct commercial property investment by foreigners with $38.7bn pouring into the country, according to a report from brokerage Jones Lang LaSalle. The total was up 44 per cent on 2012. Canadian, Chinese and Australian investors led the charge, with investors targeting top-tier areas such as Manhattan, Los Angeles and Chicago as well as secondary markets including Houston, Dallas and Seattle. Almost half all investments were in office buildings, 16 per cent in apartment blocks, 15 per cent in retail, while hotels, industrial properties and land development made up the rest. Foreign money comprises about 10 per cent of all capital for commercial property investment in the US, which JLL has said could accelerate if international investors expand beyond core assets to riskier deals that deliver higher returns.

The lack of domestic credit expansion and only very modest export growth leaves only govt. to spend more than its income and they keep pressing the wrong way on that as well:

Euro zone lending contraction compounds ECB headache (Reuters) Loans to the private sector fell by 2.2 percent in January from the same month a year earlier, ECB data released on Thursday showed. That compared to a contraction of 2.3 percent in December. Euro zone M3 money supply grew at an annual pace of 1.2 percent, picking up slightly from 1.0 percent in December. The ECB has set out two scenarios that could trigger fresh policy action: a deterioration in the medium-term inflation outlook and an “unwarranted” tightening of short-term money markets. Before the ECB gets to quantitative easing a cut in interest rates is one option for dealing with low euro zone inflation, or tight money markets. Another option the ECB has discussed is to suspend operations to soak up the money it spent buying sovereign bonds under its now-terminated Securities Markets Programme (SMP) during the euro zone’s debt crisis.

6.8% unemployment considered a successful economy?
whatever…

Lowest number of Germans out of work in Feb since Sept 2012 (Reuters) The number of people out of work in Europe’s largest economy decreased by 14,000 to 2.914 million, data from the Labour Office showed. That meant there were fewer unemployed people in Germany than at any time since September 2012. It was the third consecutive monthly drop in joblessness. Separate data from the Federal Statistics Office on Thursday showed employment climbing to a record high of almost 42 million. Berlin expects private consumption, which boosted growth in 2013, to increase by 1.4 percent as workers benefit from an increase in employment to an expected record of 42.1 million this year and a nominal 2.7 percent jump in earnings. The jobless rate held steady at 6.8 percent, its lowest level since German reunification more than two decades ago.

Germany’s wealth distribution most unequal in euro zone (Reuters) Private wealth is more unevenly distributed in Germany than in any other euro zone state. While the richest one percent of people in Germany have personal wealth of at least 800,000 euros ($1.09 million), over a quarter of adults have either no wealth or negative wealth because of debt, the study by Germany’s DIW think tank showed. According to the study, Germany’s Gini coefficient, a measure of income inequality, was 0.78 in 2012. That compared with 0.68 in France, 0.61 in Italy and 0.45 in Slovakia. A score of 0 indicates minimal inequality and 1.0 maximal inequality. Germans have total net assets worth 6.3 trillion euros, with land and real estate accounting for 5.1 trillion euros, and the average German adult has net assets worth around 83,000 euros, according to DIW. In the study, private wealth includes owned real estate, financial assets, valuables and debt.

French jobless total rises to record in January (Reuters) The number of people out of work in France rose by 8,900 in January to reach a record, as President Francois Hollande’s goal of taming unemployment eluded him yet again. Labour Ministry data showed on Wednesday that the number of people registered as out of work reached 3,316,200 in mainland France, up 0.3 percent over a month and 4.4 percent over a year. Hollande’s popularity has plummeted to record lows. He struggled and ultimately failed to live up to a pledge to get unemployment falling by the end of last year. With that promise in tatters despite at least 2 billion euros ($2.73 billion) spent on subsidized jobs, Labour Minister Michel Sapin said earlier on Wednesday that the jobless total should fall this year. Hollande offered last month to phase out 30 billion euros in payroll charges that companies have to pay, in exchange for committing to targets to create jobs.

Spanish Economic Growth Slower Than Expected (WSJ) Gross domestic product grew by 0.2% in the fourth quarter compared with the third, the country’s national statistics institute INE said Thursday. The figure was lower than the INE’s and the government’s preliminary reading, which had pegged quarterly growth at 0.3%. Public spending fell 3.9% compared with the third quarter. Household consumption was up 0.5% in the same period. Strong export growth helped Spain’s economy emerge from a nine-quarter recession in the second half of 2013, but the recovery has so far been anemic, because households remain highly indebted, unemployment still stands around 26% and the government can’t raise public spending because it is struggling to lower its budget deficit. According to the INE, economic output shrunk by 0.2% in the fourth quarter of 2013 compared with the fourth quarter of a year earlier.

Private rental surge hits benefits bill (FT) Englands housing market is seeing a seismic shift towards private rented property and away from home ownership. Figures from the official English housing survey published on Wednesday show the number of households living in the private rented sector overtook those in social housing for the first time last year. Almost 4m households now live in privately rented homes, and a quarter of the tenants are now subsidised by housing benefit, according to the annual survey. Private renting is now the second-largest tenure in England, behind home ownership. Under two-thirds of households now own their own home down from 71 per cent a decade ago. The number of households in the private rented sector receiving the benefit has risen by two-thirds in the past five years, with 390,000 more households in this category beginning to claim, the English housing survey found.

Does China want their currency to adjust to the yen the way other EM currencies have done?

China dismisses concern over sudden renminbi fall (FT) The recent movement of the renminbi exchange rate is the result of market players adjusting their near-term renminbi trading strategies, the State Administration of Foreign Exchange, an agency under the central bank, said. It added that the currencys movement was nothing unusual: The degree of exchange rate volatility is normal by the standards of developed and emerging markets. There is no need to over-interpret it. China faced immense capital inflows at the start of this year, according to data published on Tuesday by the central bank. Banks bought a net $73bn of foreign currency in the onshore market from their clients who wanted renminbi in January, the biggest monthly amount on record. Inflows have been accelerating since the middle of last year when Chinas mountain of foreign exchange reserves grew $500bn to $3.8tn.

China’s Central Bank Engineered Yuan’s Decline (WSJ) China’s central bank engineered the recent decline in the country’s currency to shake out speculators as it prepares to allow a wider trading range for the tightly tethered yuan, according to people familiar with the central bank’s thinking. In the past week, the People’s Bank of China has been guiding the yuan lower against the dollar. It has done so by setting a weaker benchmark against which the yuan can trade. It has also intervened in the currency market by directing state-owned Chinese banks to buy dollars, according to traders. China’s central bank and commercial banks purchased nearly $45 billion worth of foreign exchange in December, the fifth consecutive month of net purchases. The PBOC decided to tamp down expectations for one-way appreciation in the yuan and curb speculative trading during two-day currency-policy meeting that ended on Feb. 18, the people said.

India Budget Seeks 7-Year Low Deficit Amid Sops for Votes

Proactively lowering demand with 9% unemployment
:(

India Budget Seeks 7-Year Low Deficit Amid Sops for Votes

By Unni Krishnan, Kartik Goyal and Siddhartha Singh

February 17 (Bloomberg) — Indias government pledged to reduce the fiscal gap to the lowest in seven years in an interim budget before elections due by May, while boosting defense spending and cutting taxes on cars, mobile phones and television sets.

The budget deficit will narrow to 4.1 percent of gross domestic product by March 31, 2015 from an estimated 4.6 percent in the current fiscal year, which is lower than an earlier target of 4.8 percent, Finance Minister Palaniappan Chidambaram told lawmakers today in New Delhi. The budget would provide funds for several months until a new parliament is elected.

Housing Start and expiring tax credit narrative

So the only explanation I could find for the 30% jump in Nov housing starts was the idea of shovels going in the ground ahead of year end when some 50 low income housing, energy related, and other types of tax credits were expiring. I didn’t see any sign of anything like a sudden 30% jump in starts in any of the other indicators including mtg purchase apps, sales indicators, reports from builders etc. etc.

And now the Jan number seems to have pretty much returned to ‘pre year end spurt’ levels, and if Nov/Dec ‘borrowed’ from 2014 starts could stay soft well after the weather moderates.

Or, I’m mistaken, and when the weather clears (including California…and with no income growth..) we bounce back up to Nov/Dec levels!

We’ll see….

existing home sales chart, real final sales chart (pre weather)

Yes, the Fed doesn’t like QE and wants to taper, but seems to me they don’t want mortgage rates this high either. They know the only way the market will ‘bring down rates’ is if the economic weakness persists. And they suspect it very well may persist unless rates come down.

Their remaining option is TIRT (term interest rate targeting) which has yet to be discussed.

Existing Home Sales

Highlights
It’s more than just weather that’s clobbering the housing market. High prices and tight inventory aren’t helping either as existing home sales fell 5.1 percent in January to a 4.620 million annual rate. The year-on-year rate is also at minus 5.1 percent, a sharp contrast to the year-on-year median price which is up 10.7 percent.

Supply of homes relative to sales did rise to 4.9 months from 4.6 months but the improvement is tied mostly to the drop in sales. Prices did come down in the month but from already high levels with the median price down 4.5 percent to $188,900.

Weather was especially cold in January and no doubt contributed to the sales weakness, especially in the Midwest, where sales fell 7.1 percent in the month, and also the Northeast where the decline was 3.1 percent. But weather in California wasn’t a problem, yet sales in the West fell 7.3 percent which the National Association of Realtors points to as evidence of non-weather constraints.

Unattractive mortgage rates are another factor holding down sales. All cash buyers continue to hold up the market, accounting for 33 percent of all sales vs 32 percent in December. In contrast, first-time buyers, who are especially sensitive to the soft jobs market, continue to account for less sales, at 26 percent vs December’s 27 percent.

This is the 5th decline in the last 6 months for this series and lack of improvement in the jobs market, not to mention this month’s severe bout of heavy weather, point to more trouble for February. For the economy, the housing market needs to snap back sharply this spring. The Dow is showing little initial reaction to today’s report.


Full size image

Not exactly gang busters even before the weather reduced incomes.

And the bad weather it’s like hurricane sandy but without the insurance spending and federal relief spending.


Full size image

Housing start narrative

The data isn’t contradicting my narrative about construction being started in Nov/Dec ahead of the tax credits expiring at year end, which explains the higher starts in Nov/Dec followed by the sharp in January. The expiring credits likely altered the timing of non residential construction as well.

U.S. Housing Starts Fell 16% in January (WSJ) U.S. housing starts fell 16% last month to a seasonally adjusted annual rate of 880,000. That was down from an upwardly revised December rate of 1.05 million new homes built, marking the largest month-over-month decline since February 2011. Starts on single-family homes sank 15.9% in January to an annual pace of 573,000. Building permits, a sign of future construction, fell 5.4% to a seasonally adjusted annual rate of 937,000 last month from December’s upwardly revised rate of 991,000. The pace of housing starts last month actually rose in the chilly Northeast by 61.9%. But it fell 67.7% in the Midwest to the lowest pace on record. Starts also fell 12.5% in the South and 17.4% in the West, which has experienced relatively warm weather. Building permits were still up 2.4% in January from a year earlier, though housing starts last month were down 2% from a year ago.

The austerity narrative

Early in 2013 my narrative was the tax hikes as well as the subsequent sequesters were likely to cause growth to slow to maybe a 2% rate from what might have otherwise been a 4% rate, with downside risk from there.

Take a look at the charts below and notice how these key elements of the economy seemed to ‘go sideways’ during 2013.

And, unfortunately, real disposable personal income took a hit as well and doesn’t look to me like it can support any kind of ‘bounce back’:

(the last yoy print is ‘exaggerated’ by the ‘outlier’ a year earlier, but the trend is clear to me)

[note from poster: apologize for format- should be amended shortly]

Real disposable income

Architecure billings index

Housing starts

MBA purchase applications

Vehicle sales

Retail Sales

MBA Mortgage Applications


Highlights
The purchase index, down 2.0 percent in the February 7 week, continues to signal weakness for underlying home sales. The index is down a very sizable 13.0 percent year-on-year underscoring the importance of all cash buyers in the housing market. The refinance index edged 0.2 percent lower. Rates moves slightly lower in the week with average rate for 30-year conforming loans ($417,500 or less) down 2 basis points to 4.45 percent.

Mortgage purchase applications Y/Y:


Full size image