Continuing Claims->UE Rate->FF Rate


[Skip to the end]


Karim writes:

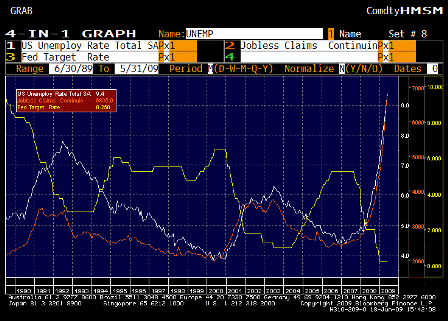
The chart attached shows the last 3 cycles in continuing claims, the unemployment rate and the FF rate.

Continuing claims is a coincident to leading indicator of the unemployment rate. Its interesting that in the last two cycles, continuing claims made what appears to be a double top before the unemployment rate peaked. In those cycles, the lag between the peak in the unemployment rate and the first Fed rate hike was 12mths (June 2003-June 2004) and 19mths (July 1992-Feb 2004).

While this cycle is notably different than the others in many respects (size and speed of economic deterioration as well as policy response), look for the Fed to make some reference (implicit or explicit) to the unemployment rate coming down in a sustainable fashion before tightening policy. Based on history, even if this month was the peak in the unemployment rate, the first hike seems unlikely until mid-2010. Based on likely further deterioration in the ue rate, first hike unlikely before 2011.


[top]

Payrolls


[Skip to the end]

With productivity up more than expected Q2 GDP can be flat with hours declining.


Karim writes:

  • Rate of decline definitely slowing overall and across a number of industries
  • But to put the ‘blowout’ number (according to CNBC) in perspective: The -345k drop in employment was only exceeded 6 times since 1960 prior to the current recession
  • NFP -345k and net revisions +82k

Details:

Good News

  • Diffusion index 25.8 to 32.7
  • Relative improvement despite 7k decline in govt jobs
  • Consistent pattern of slower rate of contraction across several industries (retail, construction, temp, hospitality)

Bad News

  • Unemployment rate up from 8.9% to 9.4%
  • Duration of unemployment up from 21.4 weeks to 22.5 weeks
  • Hours down 0.7%
  • Total Unemployed and Underemployed up from 15.8% to 16.4%


[top]

Claims/ECB/BOC


[Skip to the end]

  • Initial claims down 4k to 621k
  • Continuing claims down 15k, first drop in 2009
  • Some possibility of Memorial Day week distorting data
  • Both measures consistent with ongoing job losses and rising unemployment rate, but a slower pace than in recent months
  • Have no bearing on tomorrow’s numbers as data came after survey week for NFP.

Interesting focus on FX from both ECB and BOC this morning:

From BOC:

–In recent weeks, financial conditions and commodity prices have improved significantly, and consumer and business confidence

have recovered modestly. If the unprecedentedly rapid rise in the Canadian dollar (which reflects a combination of higher

commodity prices and generalized weakness in the U.S. currency) proves persistent, it could fully offset these positive factors.

–Key is term ‘unprecedented’ and that rise in C$ is not fully explained by the rise in commodity prices.

From ECB:

–ECB staff updated its forecasts for growth and inflation. Main change was in 2009 growth forecast:

Now -4.1% to -5.1% from estimates of -2.2% to -3.2% in March

Trichet stated: “its very important u.s. repeats strong dollar policy”.

The Euro is not trading far from levels that Trichet described as ‘brutal’ in the past.


[top]

2008-06-23 Valance Weekly Economic Graph Packet


[Skip to the end]

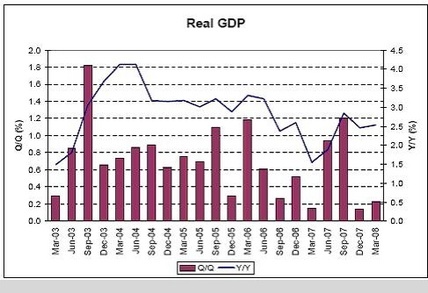
Real GDP

Can you find the recession? Year over year will be reasonable until last year’s large Q3 number drops out without similar sized q3 this year.
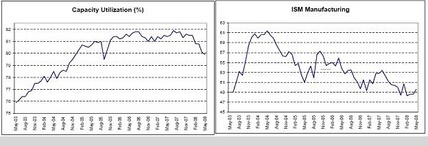


Capacity Utilization, ISM Manufacturing

Down but not out as GDP muddles through.
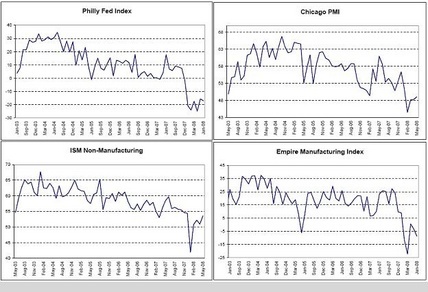


Philly Fed Index, Chicago PMI, ISM Non-Manufacturing, Empire Manufacturing Index

Limping along, but off the lows
The survey numbers seem to be depressed by inflation.
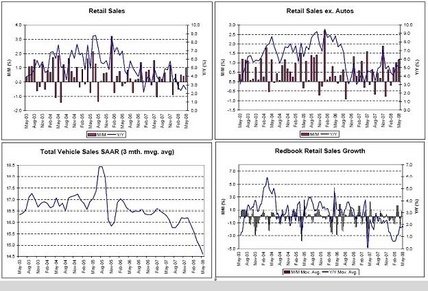


Retail Sales, Retail Sales Ex Autos, Total Vehicle Sales, Redbook Retail Sales Growth
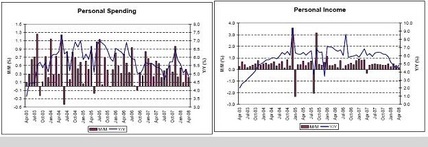


Personal Spending, Personal Income

Apart from cars and trucks, retail muddling through, and getting some support from the fiscal package.
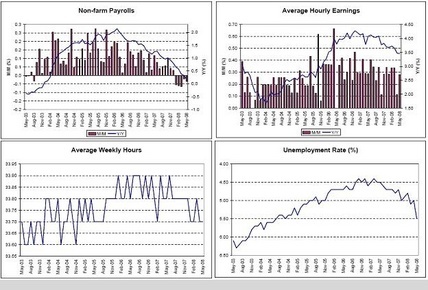

Non-farm Payrolls, Average Hourly Earnings, Average Weekly Hours, Unemployment Rate

Certainly on the soft side, but still positive year over year, earnings still increasing, and unemployment still relatively low (the last print was distorted a couple of tenths or so by technicals).
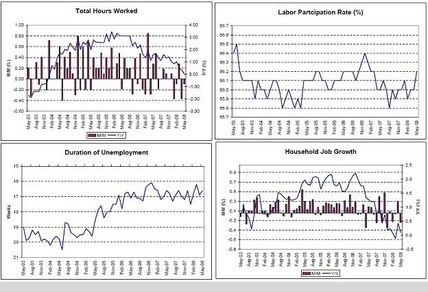

Total Hours Worked, Labor Participation Rate, Duration of Unemployment, Household Job Growth
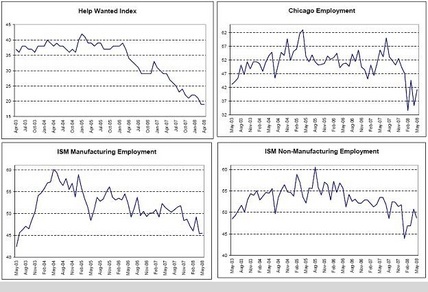

Help Wanted Index, Chicago Unemployment, ISM Manufacturing Employment, ISM Non-Manufacturing Employment
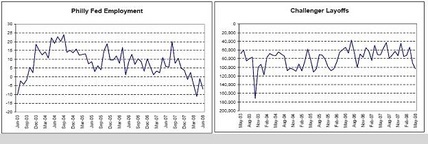

Philly Fed Employment, Challenger Layoffs

Most of the labor indicators are on the weak side, but not in a state of collapse. And GDP is picking up some from the fiscal package which should stabilize employment.
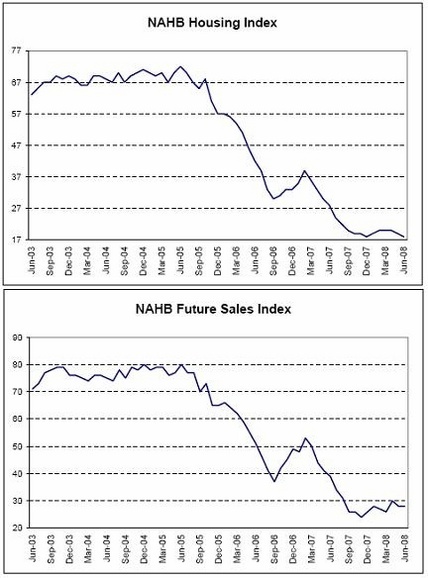

NAHB Housing Index, NAHB Future Sales Index
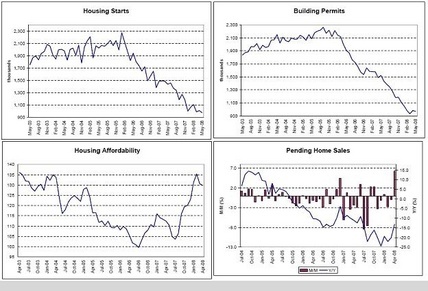

Housing Starts, Building Permits, Housing Affordability, Pending Home Sales

Leveling off to improving a touch.
Housing is still way down and could bounce 35% at any time.
And still be at relatively low levels.
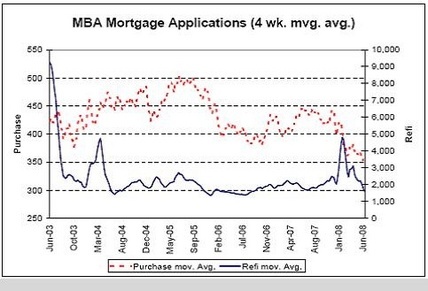

MBA Mortgage Applications

Mortgage apps are down but they are still at levels previously associated with 1.5 million starts vs today’s approx 1 million starts (annual rate).
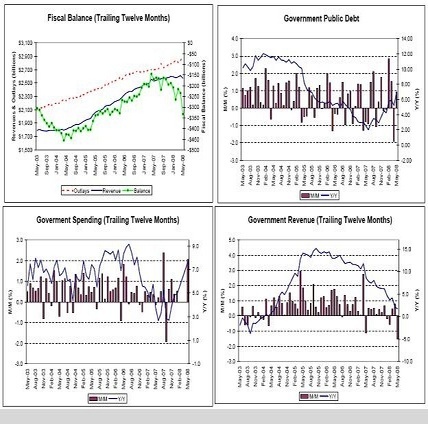

Fiscal Balance, Govt Public Debt, Govt Spending, Govt Revenue

It’s an election year, and here comes the Govt. spending which is already elevating GDP.
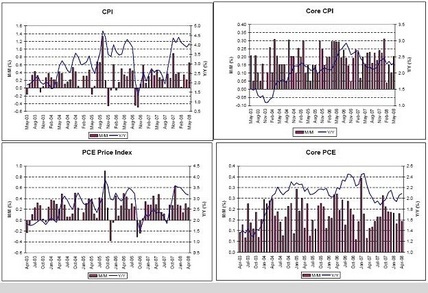

CPI, Core CPI, PCE Price Index, Core PCE
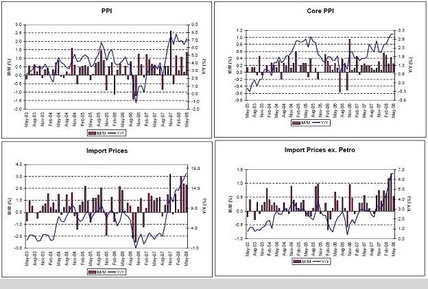

PPI, Core PPI, Import Prices, Import Prices Ex Petro
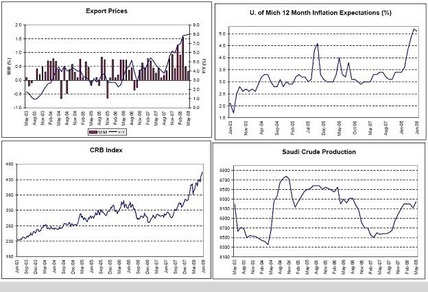

Export Prices, U of Michigan Inflation Expectations, CRB Index, Saudi Oil Production

The ‘inflation’ is only going to work its way higher as it pours through the import and export channels.
And with Saudi production completely demand driven, there’s no sign of a fall off of world demand for crude at current prices.
Yes, the world’s growing numbers of newly rich are outbidding America’s lower income consumers for gasoline, as US demand falls off and rest of world demand increases.
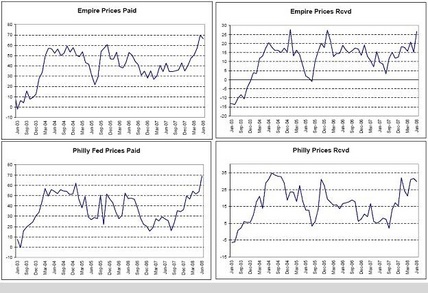

Empire Prices Paid, Empire Prices Received, Philly Fed Prices Paid, Philly Prices Received

All the price surveys are pretty much the same as ‘inflation’ pours in.
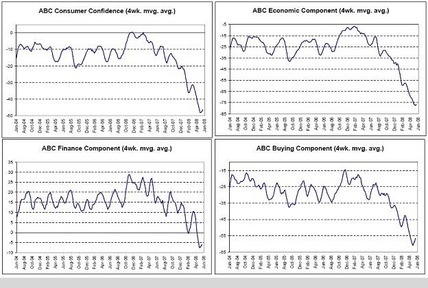

ABC Consumer Confidence, ABC Econ Component, ABC Finance Component, ABC Buying Component

And all the surveys look pretty much the same as ‘inflation’ eats into confidence
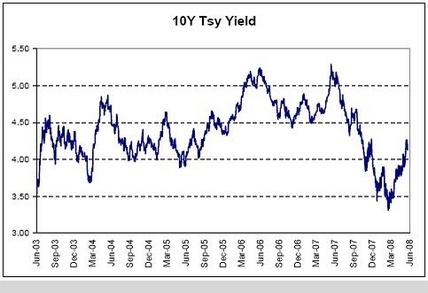

10Y Tsy Yield

And with all the weakness rates have generally moved higher as it seems inflation is doing more harm than ultra low interest rates are helping, perhaps causing the Fed to reverse course.
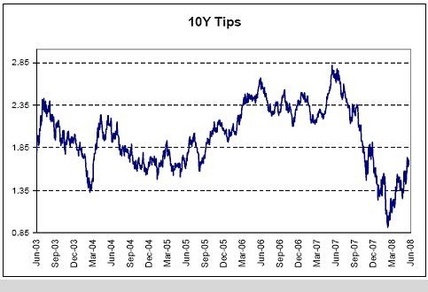

10Y Tips

The TIPS market has been discounting higher ‘real’ rates from the Fed.
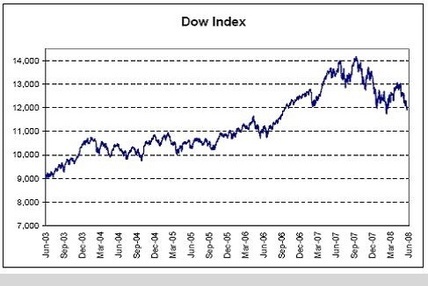

Dow Index

Even as stocks look to test the lows

[top]

Another look at Kohn’s June 11th speech


[Skip to the end]

This still reads hawkish to me:

The results of such exercises imply that, over recent history, a sharp jump in oil prices appears to have had only modest effects on the future rate of inflation. This result likely reflects two factors. First, commodities like oil represent only a small share of the overall costs of production, implying that the magnitude of the direct pass-through from changes in such prices to other prices should be modest, all else equal. Second, inflation expectations have been well anchored in recent years, contributing to a muted response of inflation to oil price shocks. But the anchoring of expectations cannot be taken as given; indeed, the type of empirical exercises I have outlined reveal a larger effect of the price of oil on inflation prior to the last two decades, a period in which inflation expectations were not as well anchored as they are today.

Nonetheless, repeated increases in energy prices and their effect on overall inflation have contributed to a rise in the year-ahead inflation expectations of households, especially this year. Of greater concern is that some measures of longer-term inflation expectations appear to have edged up since last year. Any tendency for these longer-term inflation expectations to drift higher or even to fail to reverse over time would have troublesome implications for the outlook for inflation.

The central role of inflation expectations implies that policymakers must look beyond this type of reduced-form exercise for guidance. After all, the lags of inflation in reduced-form regressions are a very imperfect proxy for inflation expectations. As emphasized in Robert Lucas’s critique of reduced-form Phillips curves more than 30 years ago, structural models are needed to have confidence in the effect of any shock on the outlook for inflation and economic activity.

This was considered the dovish part:

In particular, an appropriate monetary policy following a jump in the price of oil will allow, on a temporary basis, both some increase in unemployment and some increase in price inflation. By pursuing actions that balance the deleterious effects of oil prices on both employment and inflation over the near term, policymakers are, in essence, attempting to find their preferred point on the activity/inflation variance-tradeoff curve introduced by John Taylor 30 years ago.

So the question is whether that point was realized by a 2% Fed funds rate currently?

Such policy actions promote the efficient adjustment of relative prices: Since real wages need to fall and both prices and wages adjust slowly, the efficient adjustment of relative prices will tend to include a bit of additional price inflation and a bit of additional unemployment for a time, leading to increases in real wages that are temporarily below the trend established by productivity gains.

But it was then qualified by this return to hawkishness regarding the inflation expectations that he previously said showed signs of elevating:

I should emphasize that the course of policy I have just described has taken inflation expectations as given. In practice, it is very important to ensure that policy actions anchor inflation expectations. This anchoring is critical: As demonstrated by historical experiences around the world and in the United States during the 1970s and 1980s, efforts to bring inflation and inflation expectations back to desirable levels after they have risen appreciably involve costly and undesirable changes in resource utilization.11 As a result, the degree to which any deviations of inflation from long-run objectives are tolerated to allow the efficient relative price adjustments that I have described needs to be tempered so as to ensure that longer-term inflation expectations are not affected to a significant extent.

And the FOMC all agree that long term inflation expectations have been affected to some extent already.

Summary
To reiterate, the Phillips curve framework is one important input to my outlook for inflation and provides a framework in which I can analyze the nature of efficient policy choices. In the case of a shock to the relative price of oil or other commodities, this framework suggests that policymakers should ensure that their actions balance the deleterious economic effects of such a shock in the short run on both unemployment and inflation.

Of course, the framework helps to define the short-run goals for policy, but it doesn’t tell you what path for interest rates will accomplish these objectives. That’s what we wrestle with at the FOMC and is perhaps a subject for a future Federal Reserve Bank of Boston conference.

This all could mean a Fed funds rate that causes unemployment to grow and dampen inflation expectations down, but not grow so much as to bring inflation down quickly is in order.

The question then is whether the appropriate Fed funds rate for this ‘balance’ between growth, employment, and inflation expectations is 2% or something higher than that.

[top]

BOJ and inflation


[Skip to the end]

Bank of Japan keeps distance from Fed, ECB hawks

by Leika Kihara

(Reuters) Bank of Japan Governor Masaaki Shirakawa distanced himself on Friday from the hawkish tone of U.S. and European central bankers, and signalled slowing economic growth was still a key factor in deciding interest rates.

After keeping rates steady at 0.5 percent as expected, Shirakawa acknowledged that the rising global risk of inflation had prompted the U.S. Federal Reserve and the European Central Bank to deliver unusually candid warnings to markets this month.

But he said it was equally important to monitor the risk of slowing economic growth in Japan, with financial markets still bruised by a credit crisis weighing on the global economy.

My take is that over the years voters repeatedly show a larger dislike of inflation vs unemployment. They would rather have a slow down and rising unemployment than high inflation. That’s why the politicians charge the CB with controlling inflation. Inflation will get them kicked out of office even faster than unemployment will.

If the BOJ members ‘allow’ inflation and doesn’t hike rates to fight it (that’s what they all think fights inflation), I would expect the politicians will replace them members who will hike.


[top]

Watch for full employment to be redefined


[Skip to the end]

It’s about that time of the cycle for ‘learned’ academic papers to start popping up claiming the NAIRU, the ‘non accelerating inflation rate of unemployment’ (or something like that) is in actual fact more like 7% rather than the currently believed 5%.

And expect these findings to show that it’s always been closer to 7%, but that a temporary glut in global supply, due to the removal of prior international trade constraints, temporarily permitted lower unemployment rates to not trigger accelerating inflation.

Now, however, this ‘slack’ has been used up.

That will suggest that inflation will continue to accelerate until the unemployment rate is over 7%, much like it is in the eurozone.


[top]