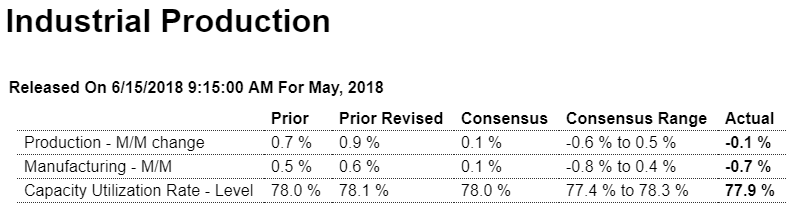
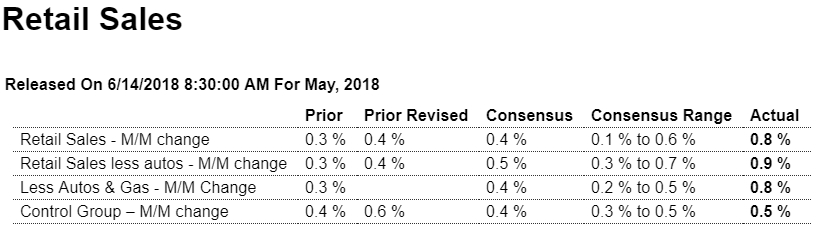
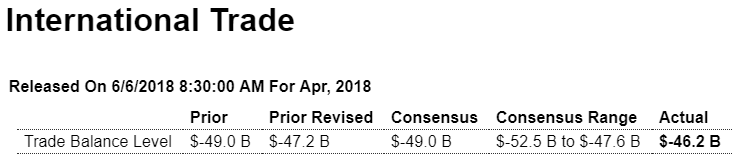
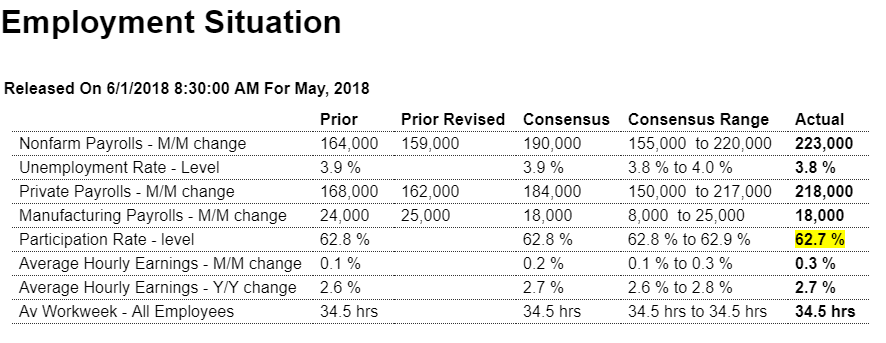
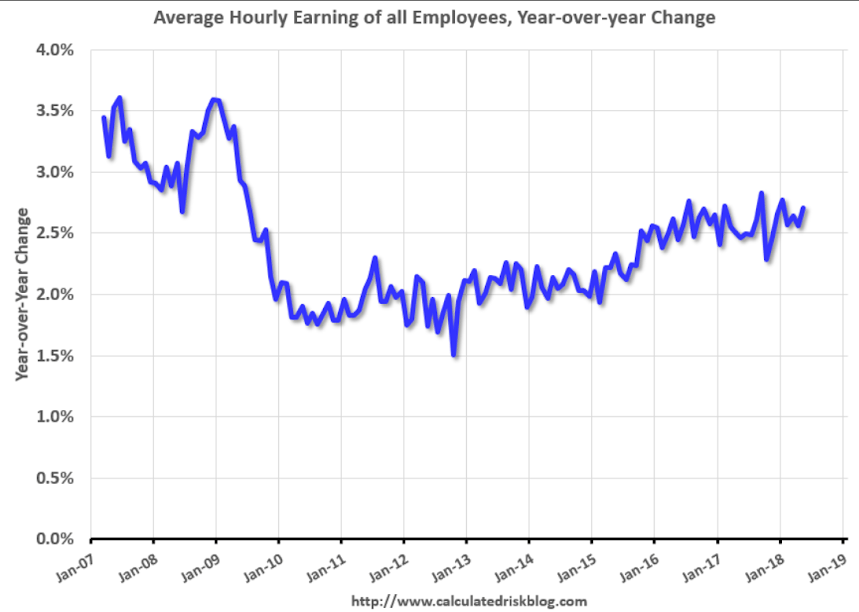
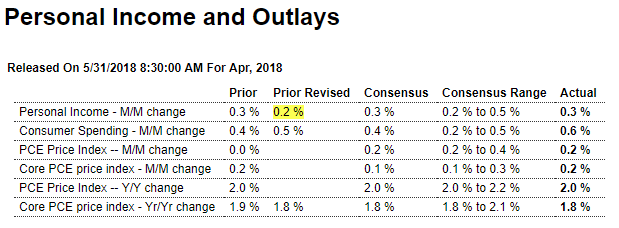
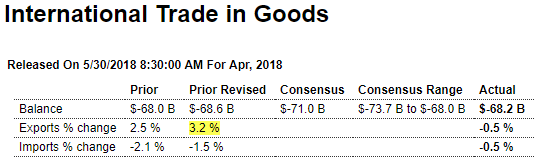
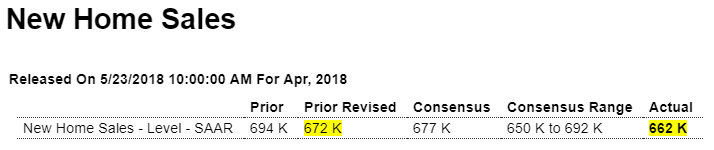
Pretty much as expected. These numbers are not adjusted for inflation, which is running around 2%:
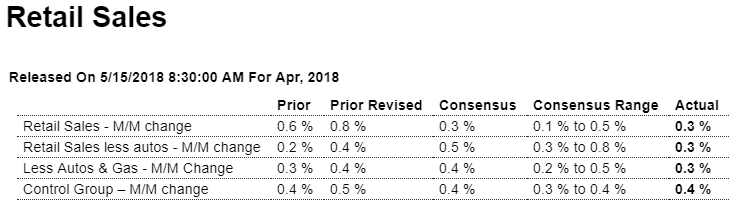
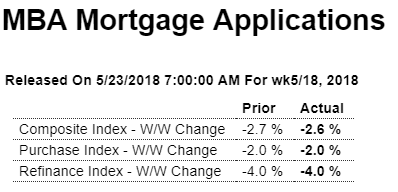
Highlights
Consumer spending was weak in the first quarter and the first look at the second quarter is no better than moderate. Total sales rose an as-expected 0.3 percent in April which pretty much tells the story of the month. Vehicle sales, despite a decline in previously reported unit sales, did post a rise of 0.1 percent in the month which is very respectable given the oversized comparison with March when sales jumped 2.1 percent. Gasoline sales rose an outsized 0.8 percent on higher prices in the month and when excluding both vehicles and gas, retail sales matched the 0.3 percent showing at the headline level.
Details throughout the report are mixed: furniture, which offers a reading on housing demand, extended recent strength with a 0.8 percent gain but restaurants, and their indication on discretionary spending, fell 0.3 percent but following a sharp gain in February. Apparel sales, which have been mixed, surged 1.4 percent but sales at department stores, which have been very weak, managed only a 0.2 percent gain. Building materials rose 0.4 percent in another positive sign for residential investment while nonstore retailers, the report’s strongest component, posted a solid 0.6 percent gain.
Control group sales, which are another core measure and a direct input into GDP, rose 0.4 percent which, given the weak comparison in the first quarter, does point to an early lift for second-quarter consumer spending. But the lift is not dramatic especially considering this year’s tax cut, which has raised disposable income, and of course the enormous demand in the labor market. Note that today’s report includes upward revisions to March, up another 2 tenths to 0.8 percent, and a 1 tenth upward revision to February which now stands at unchanged. These revisions will help limit the weakness of consumer spending in the second estimate for first-quarter GDP.
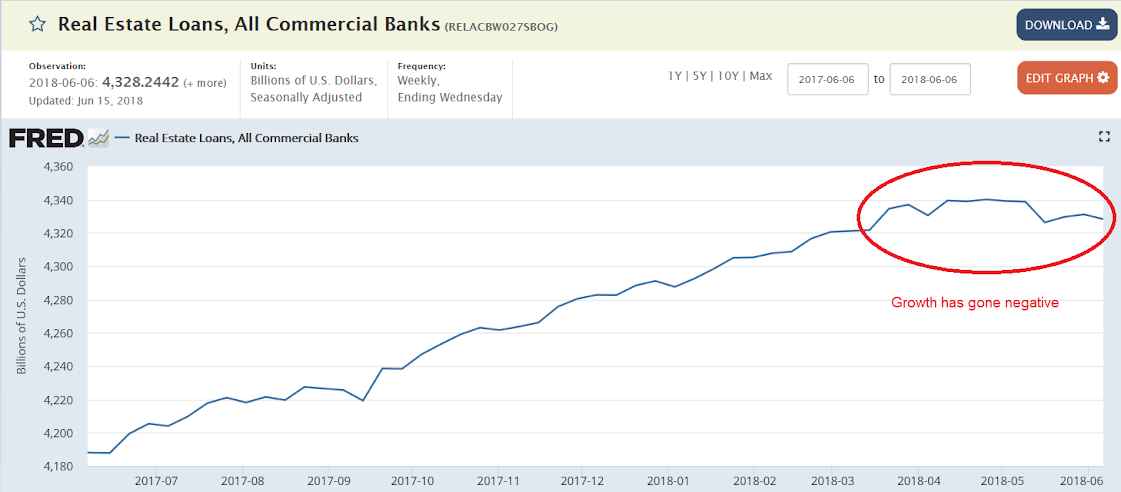
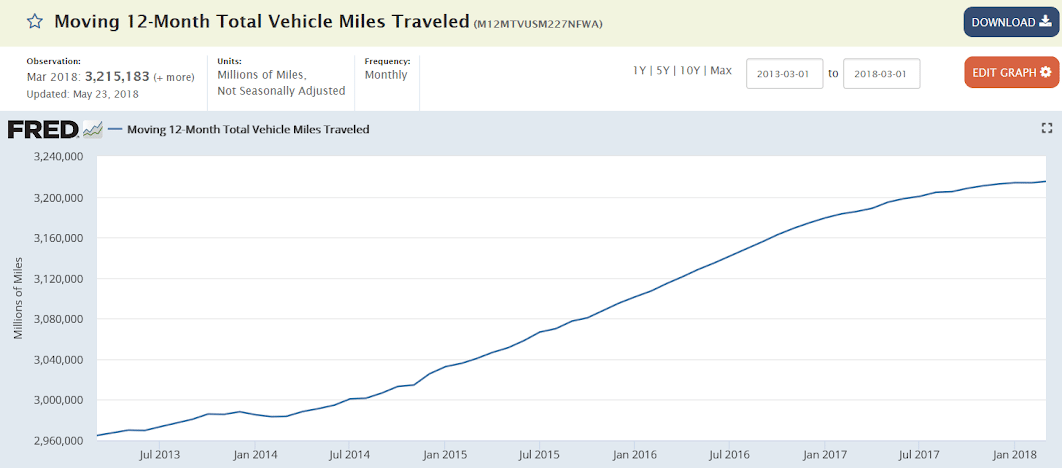
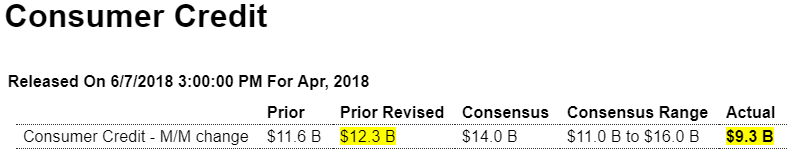
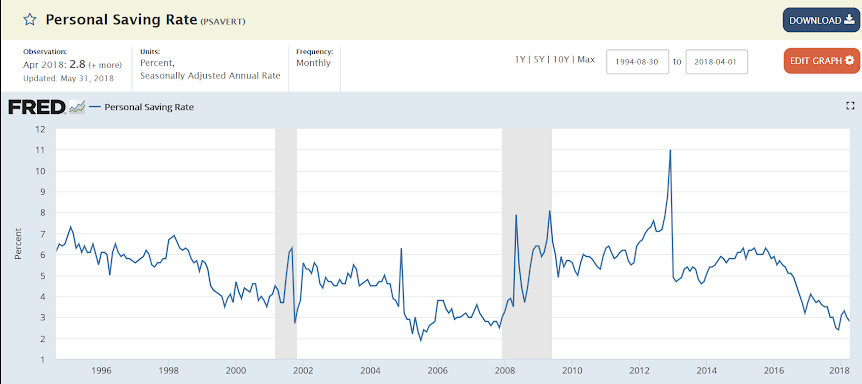
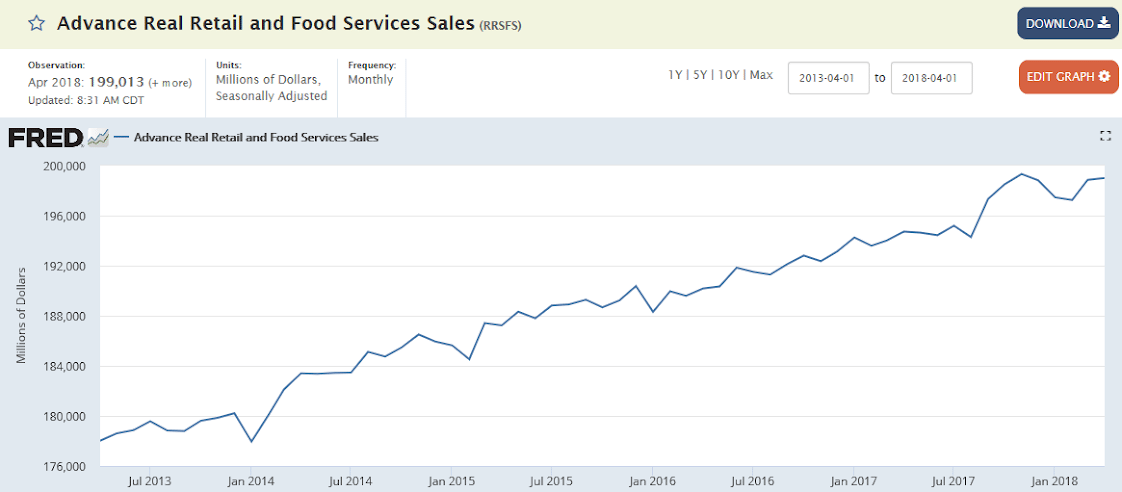
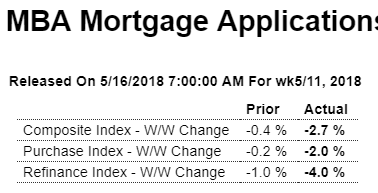
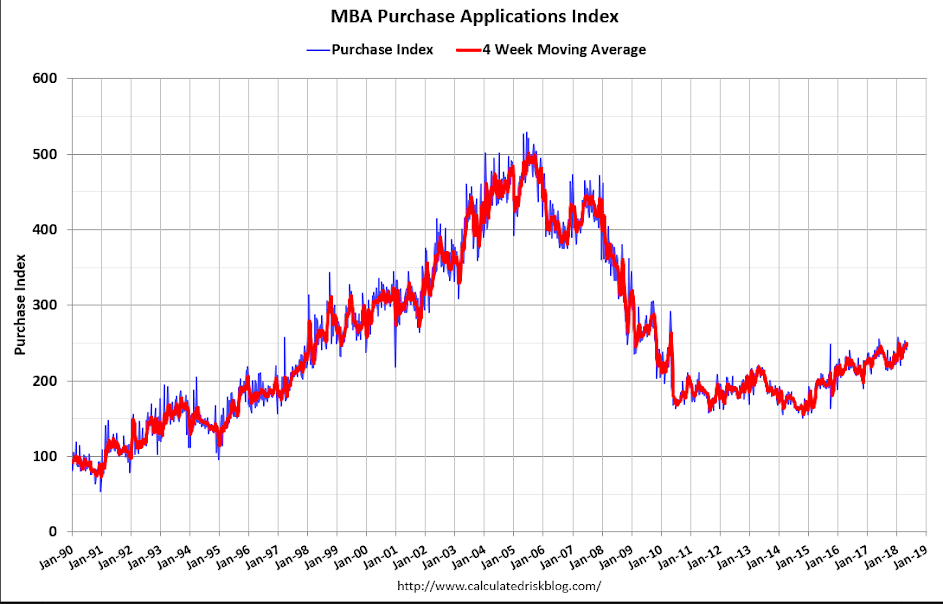
The December spike coincided with a spike in credit card balances, as well as the peak in Bitcoin prices. Seems to have leveled off since then?
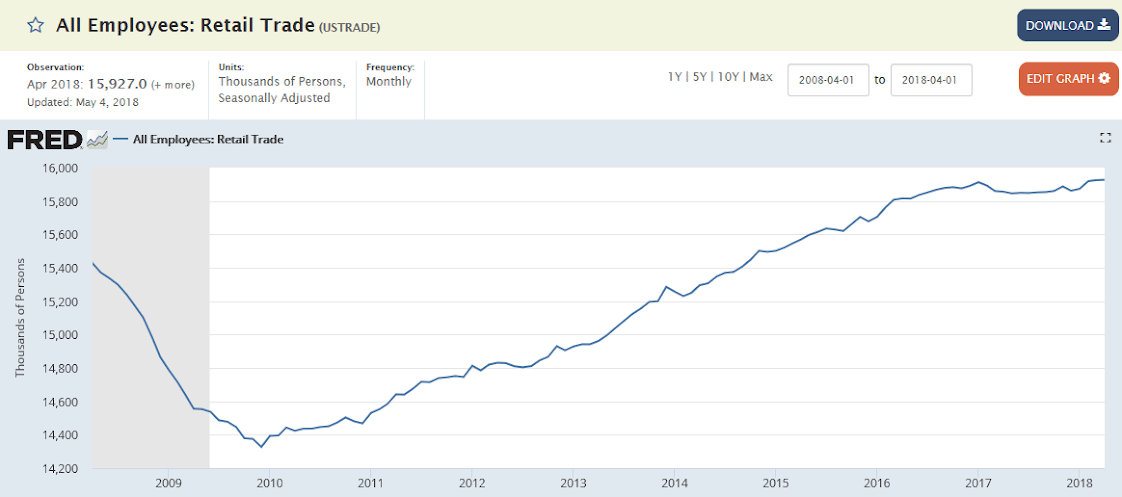
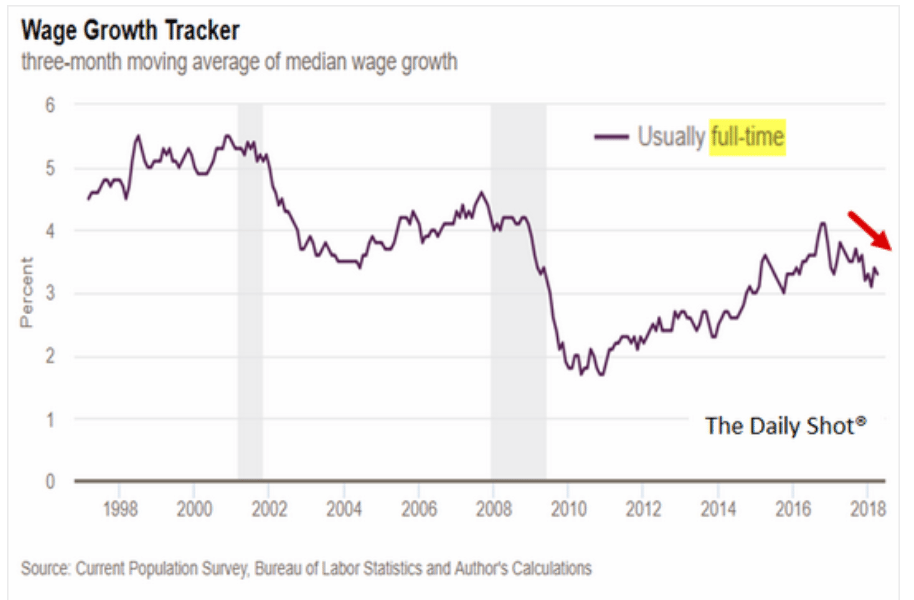
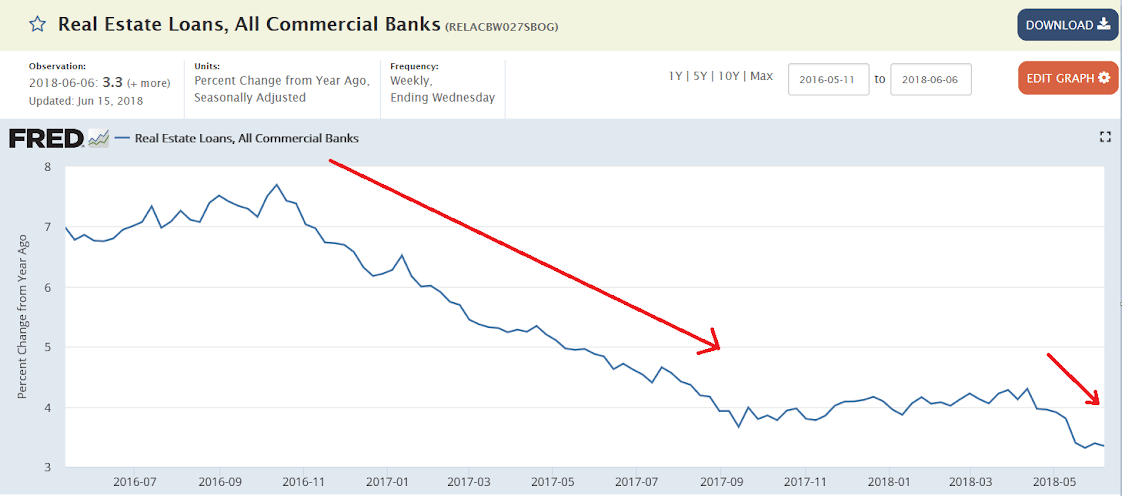
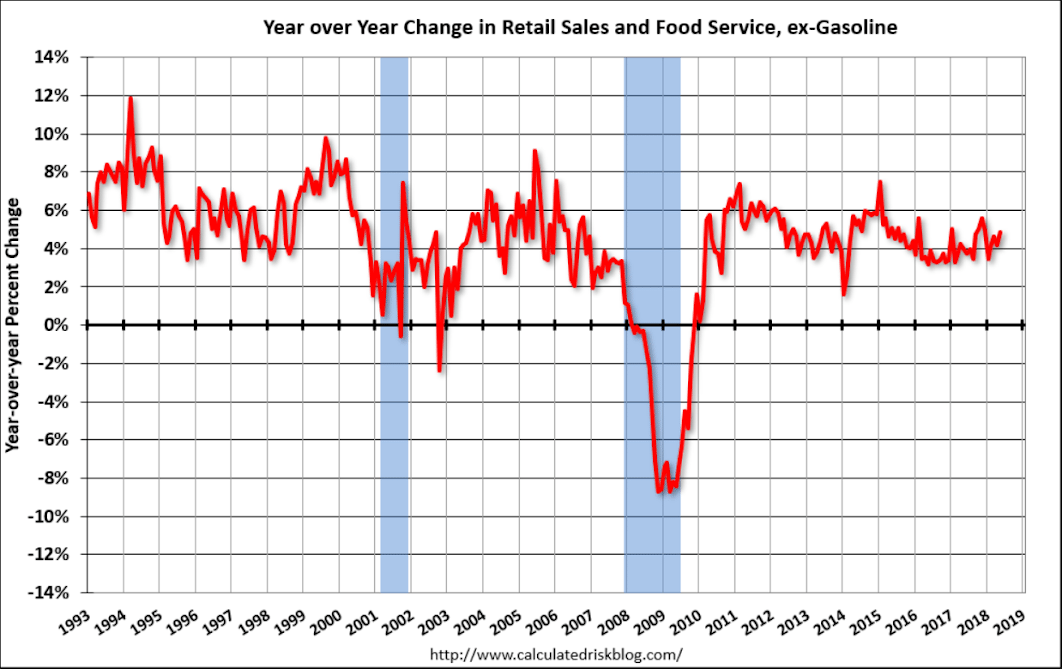
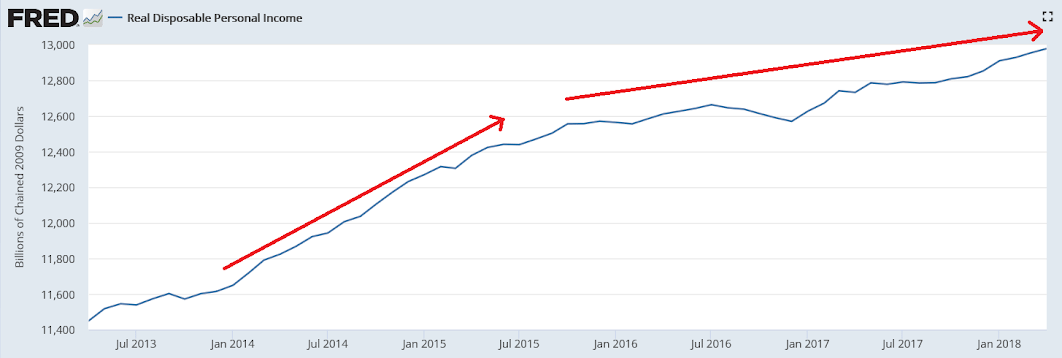
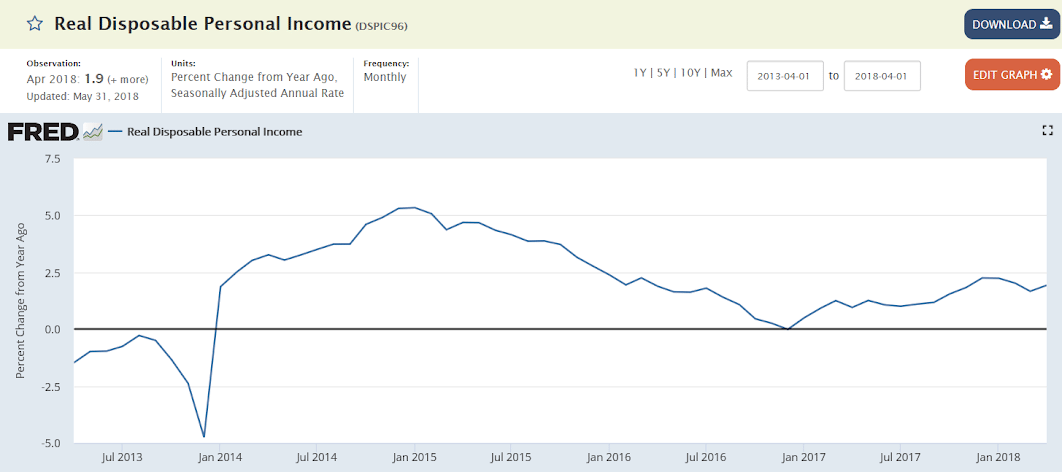
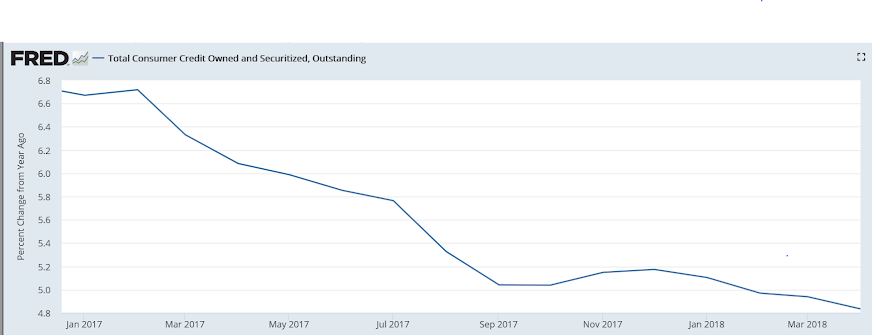
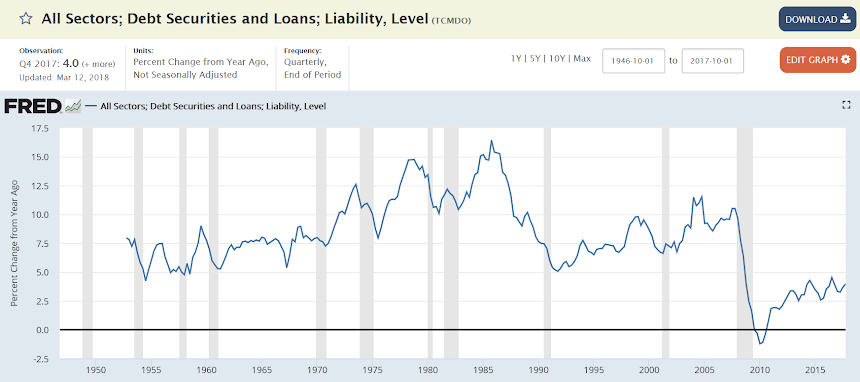
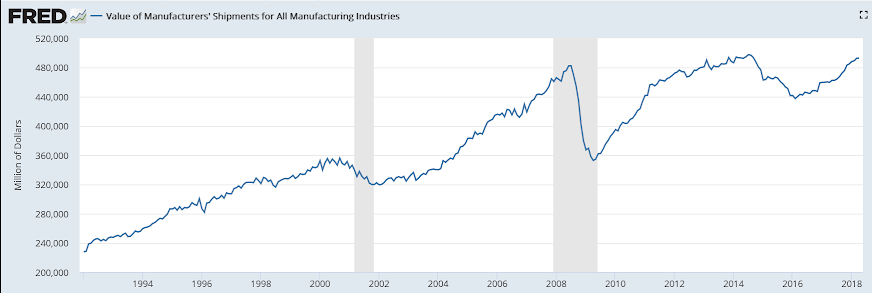
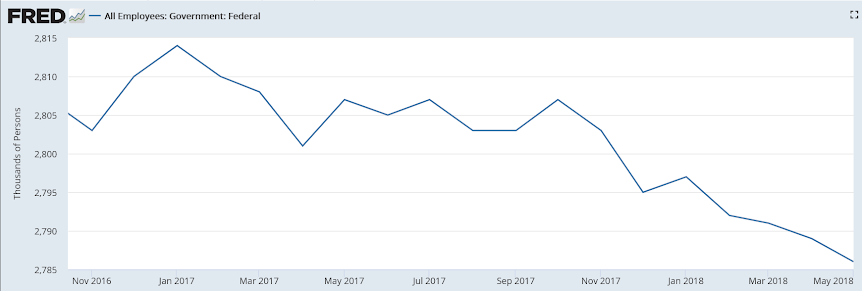
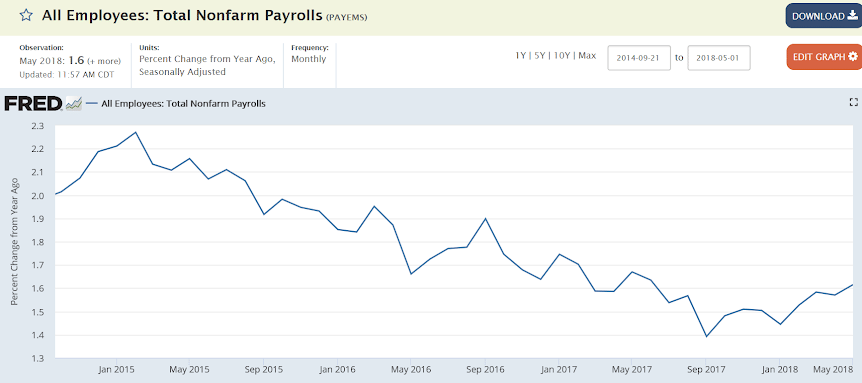
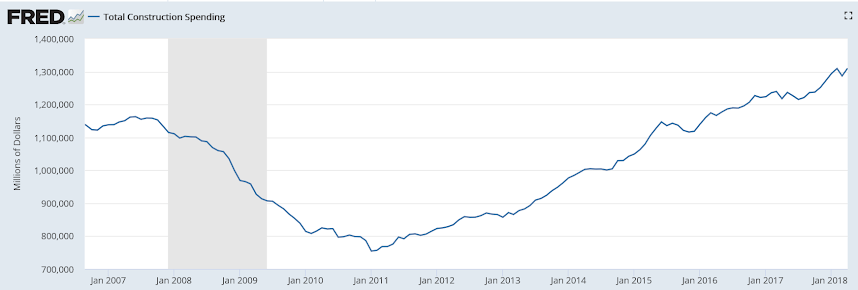
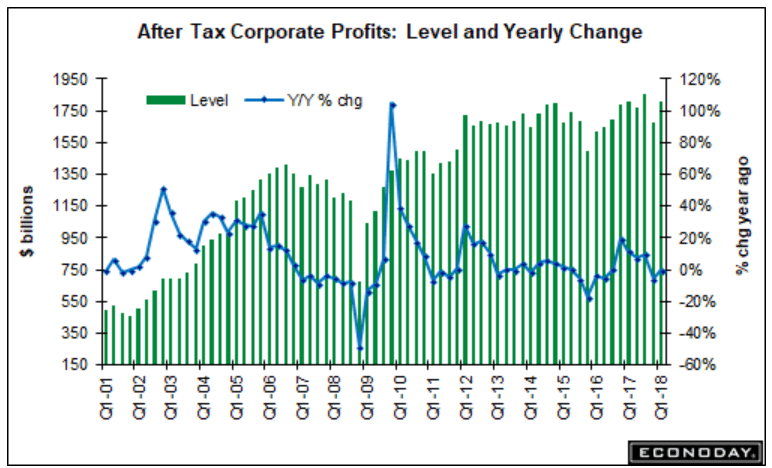
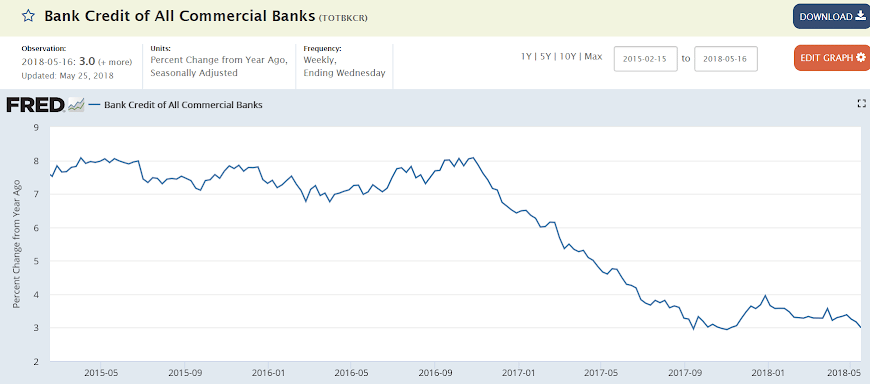
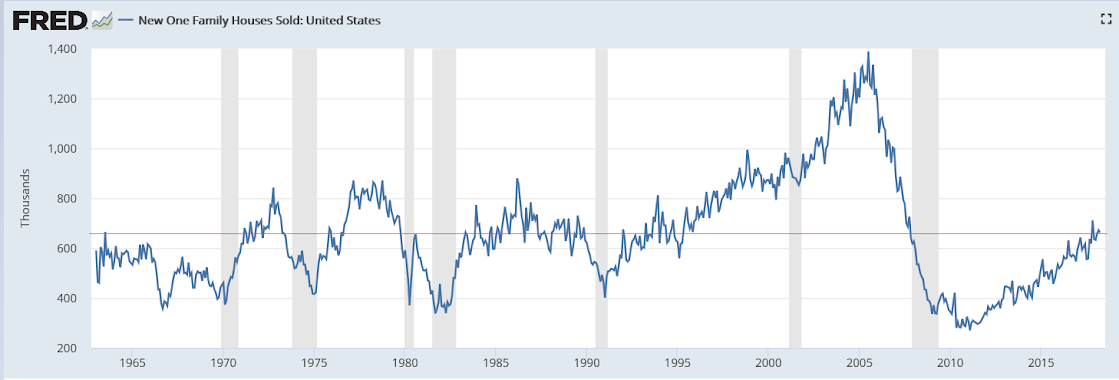
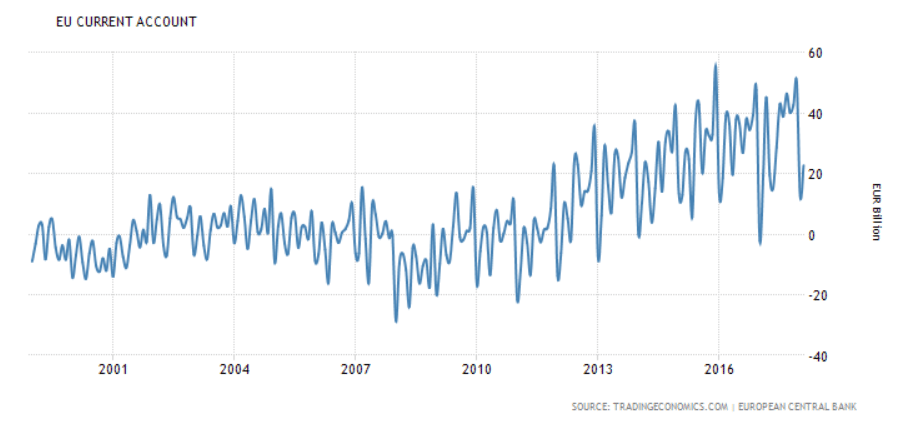
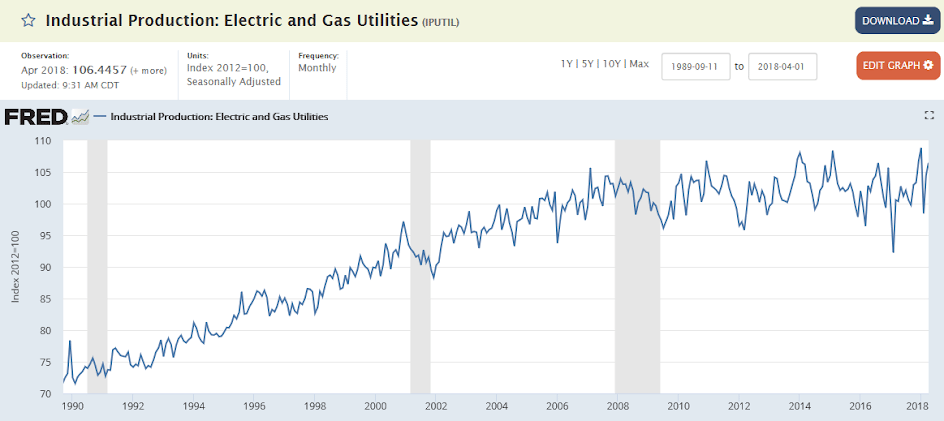
From very modest growth to nearly no growth and only about half what it was some 10 years ago:
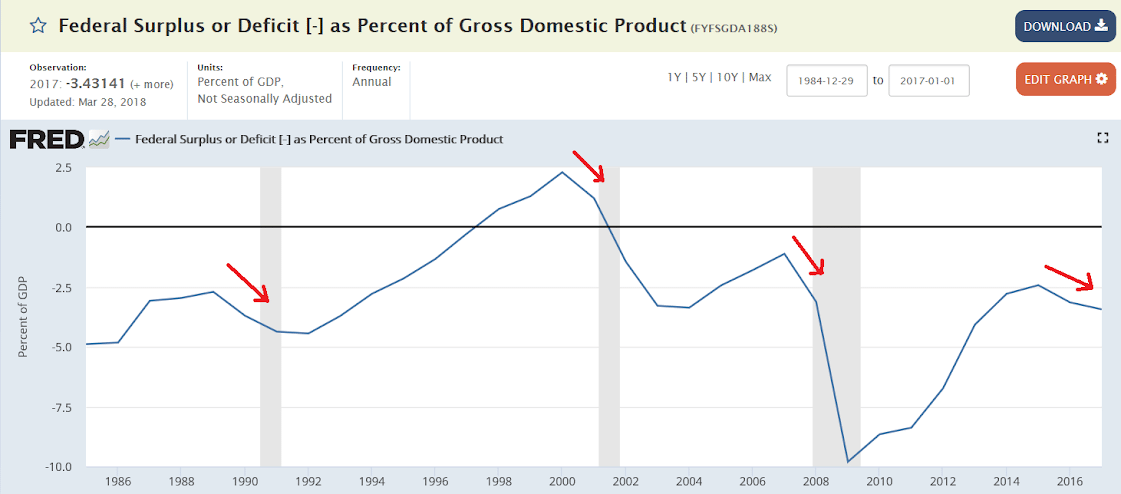
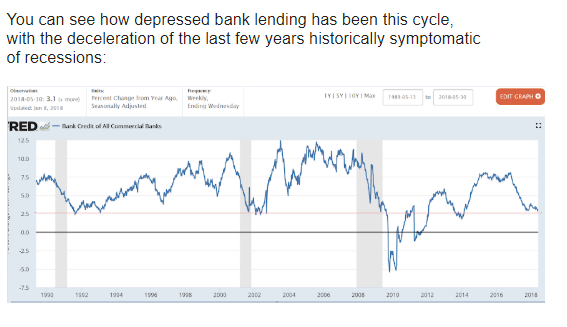
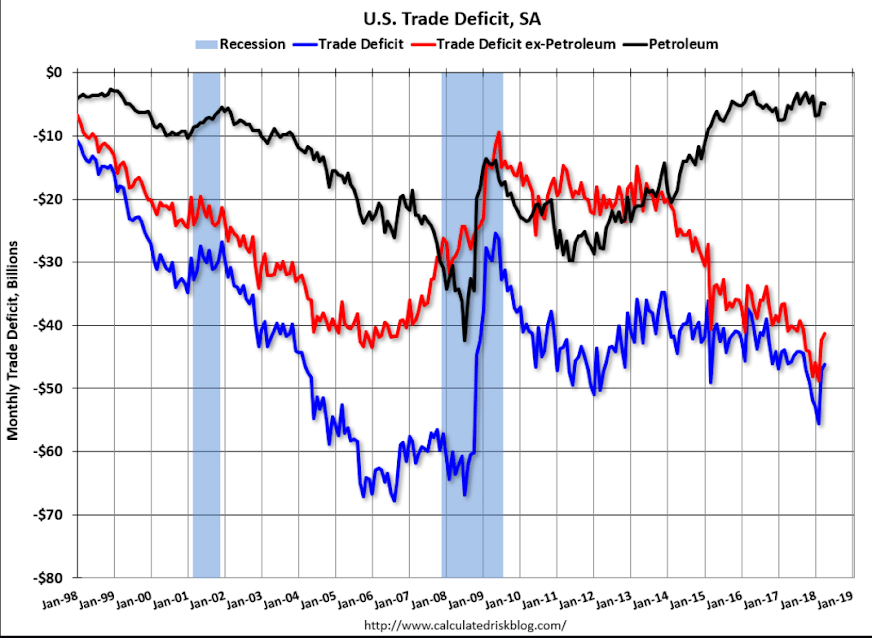
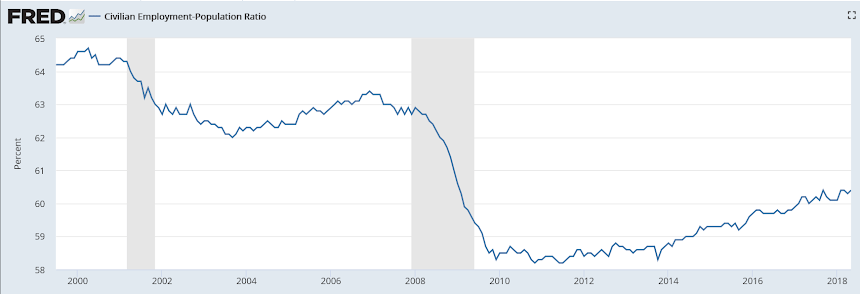
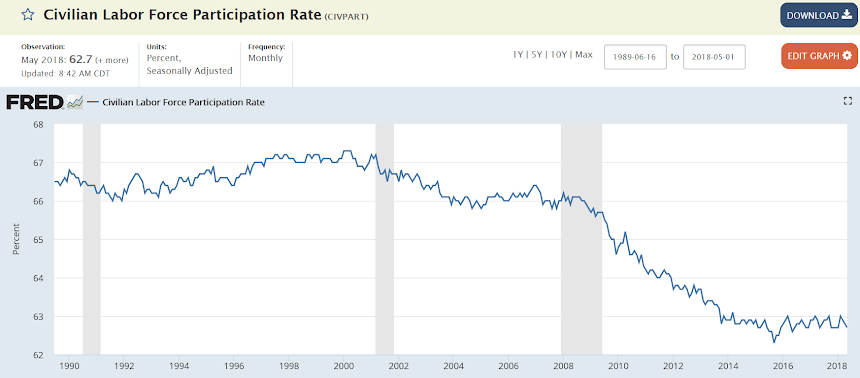
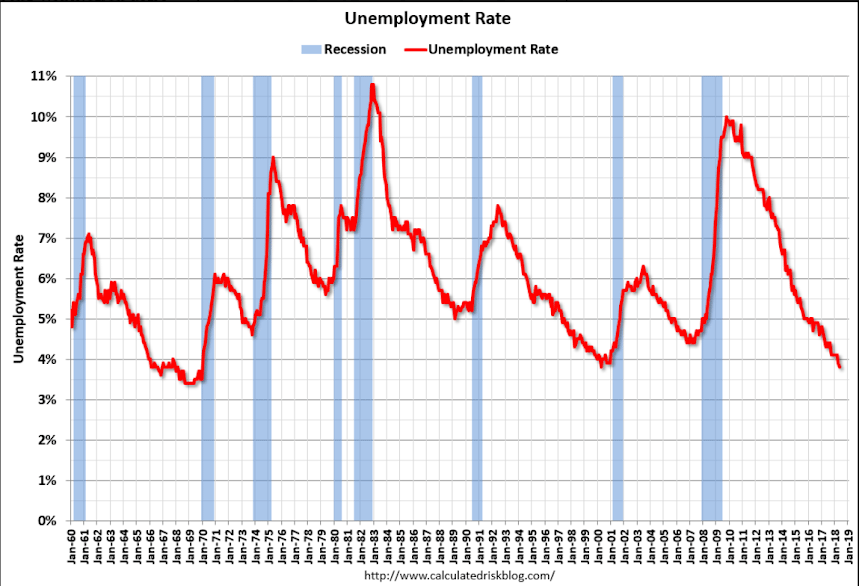
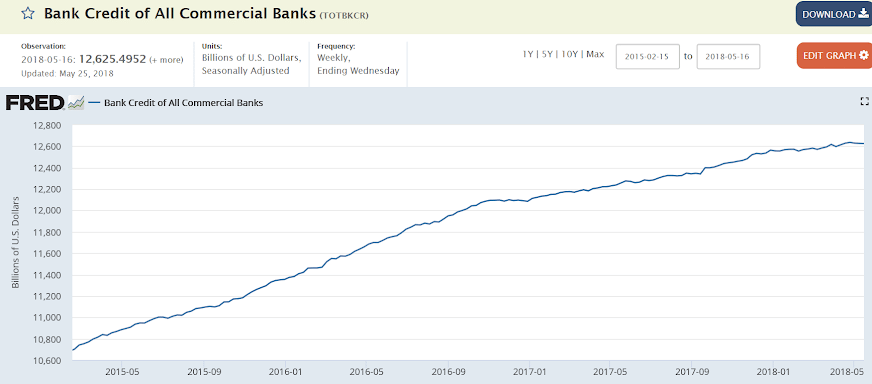
Looks to me like a serious lack of aggregate demand:
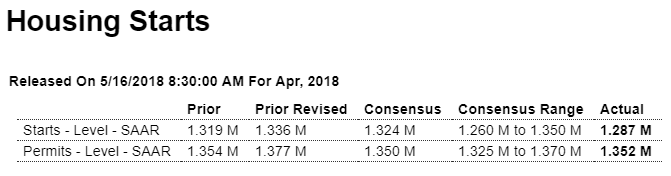
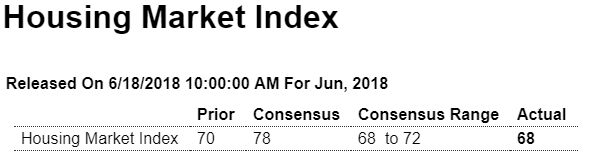
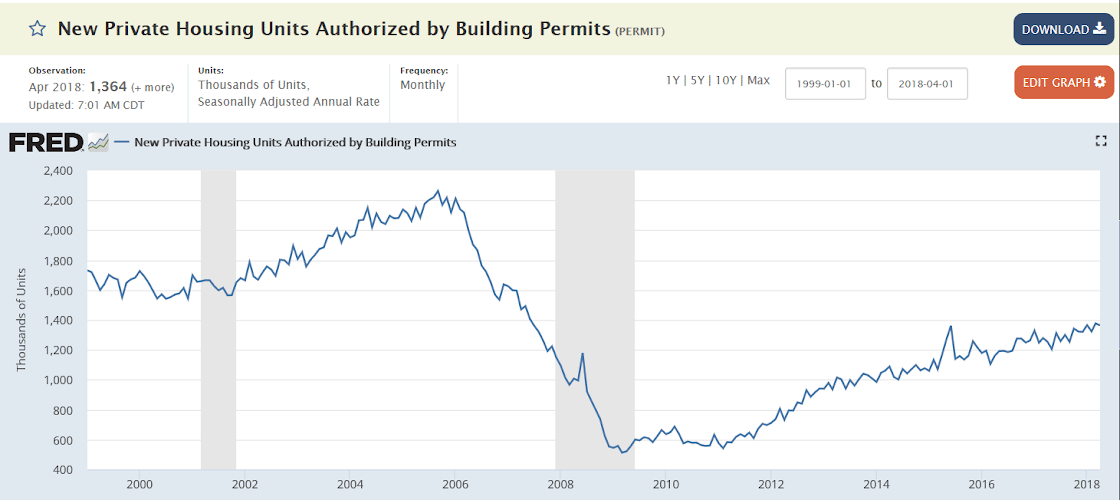
Highlights
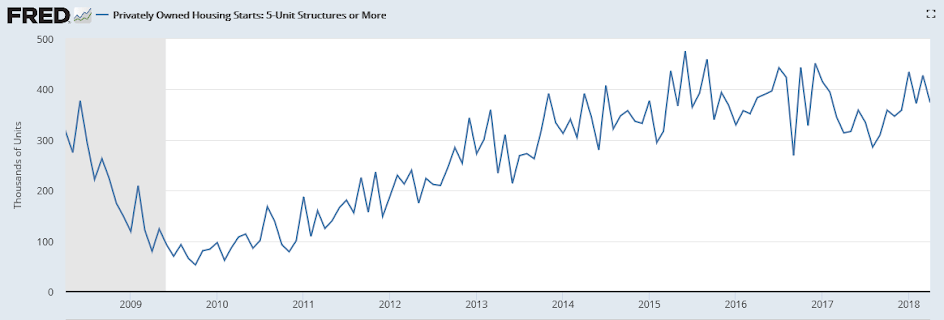
Despite headline declines, the housing starts and permits report for April is mostly positive. First the negatives: starts fell 3.7 percent in the month to a lower-than-expected 1.287 million annualized rate while permits fell 1.8 percent to an as-expected 1.352 million rate. The decline for both starts and permits reflects give back from multi-units which fell sharply in April after rising sharply in March.
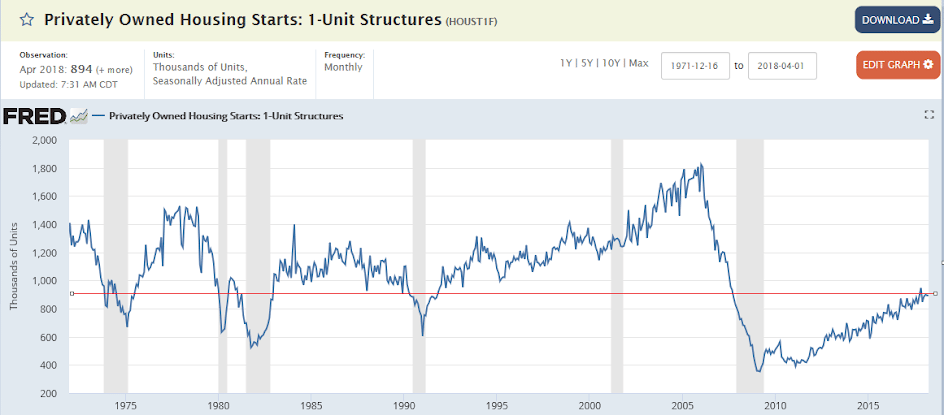
Steady readings for single-family homes are the positives in today’s data. Starts here posted a 0.1 percent increase to an 894,000 rate while single-family permits, which are the best news in the report, rose 0.9 percent to an 859,000 rate. But not all the single-family news is positive as completions fell 4.0 percent in the month to an 820,000 rate for a decline that is not welcome in a housing market starved of supply.
But behind all the volatility in the numbers is a housing sector that continues to climb at a solid rate, reflected in year-on-year change that shows total starts up 10.5 percent and permits up 7.7 percent.
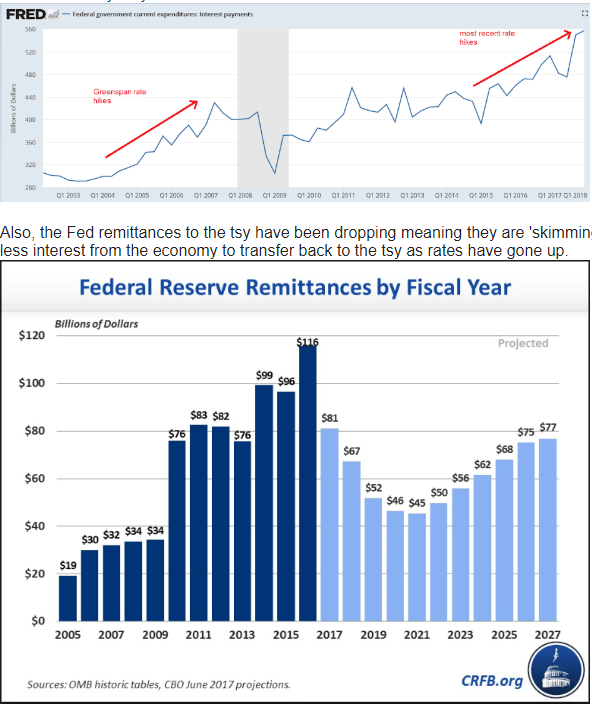
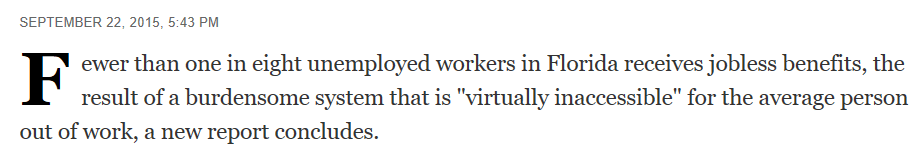
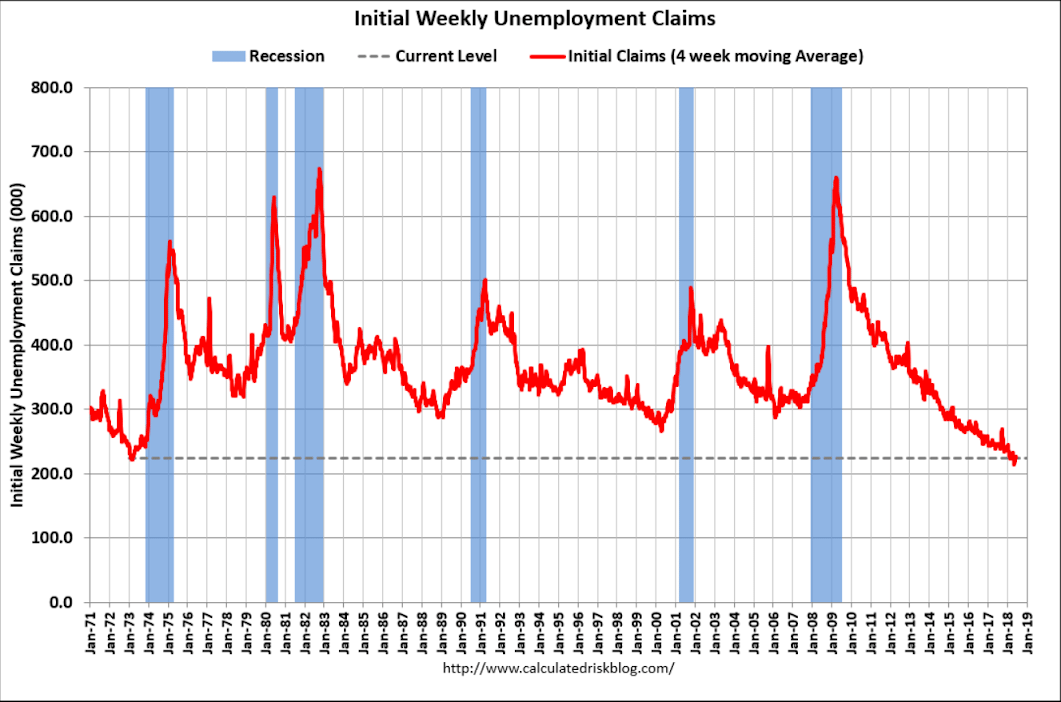
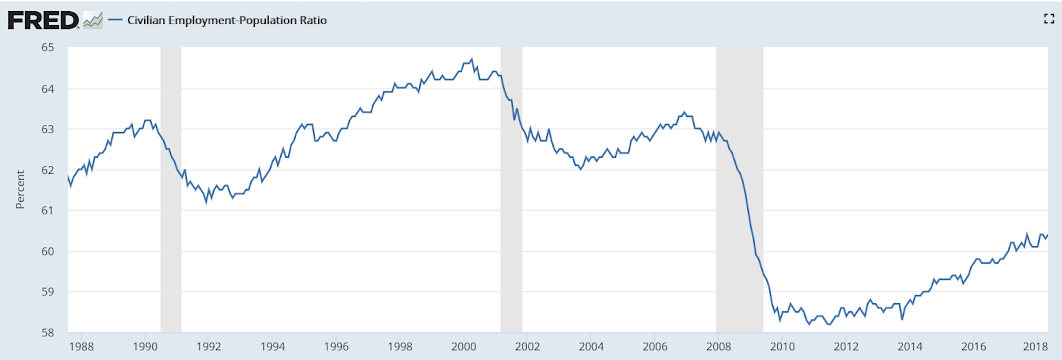
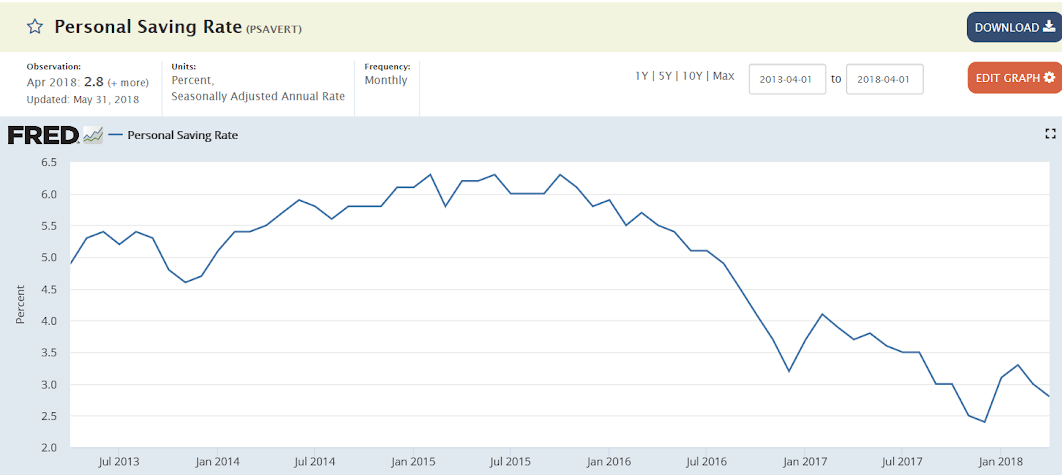
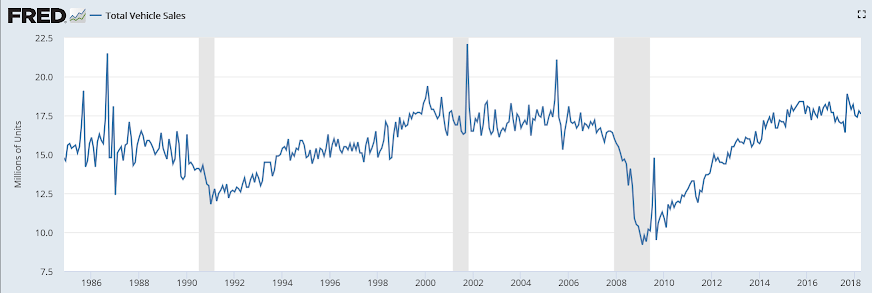
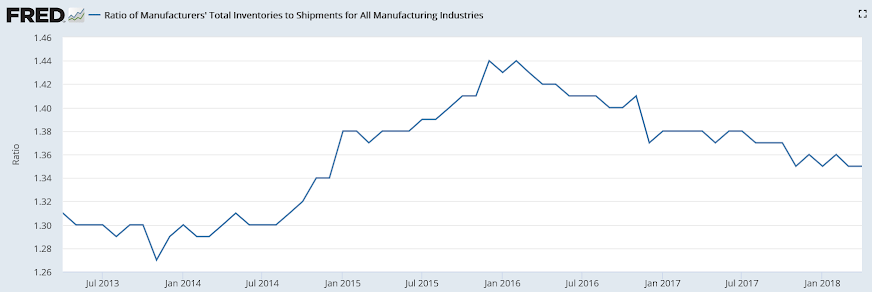
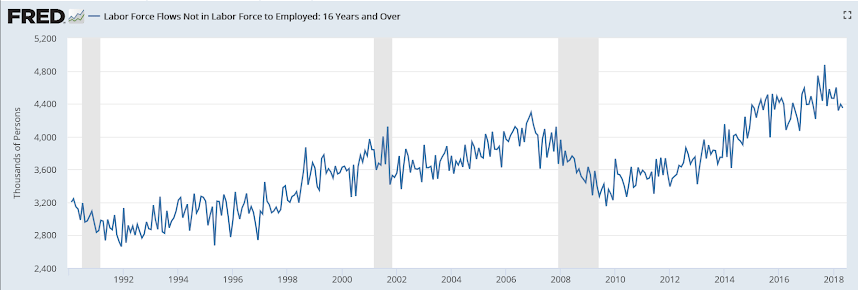
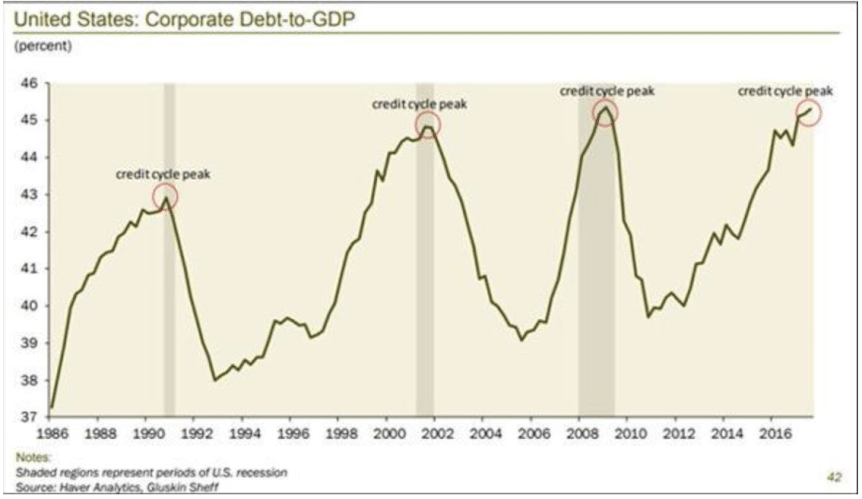
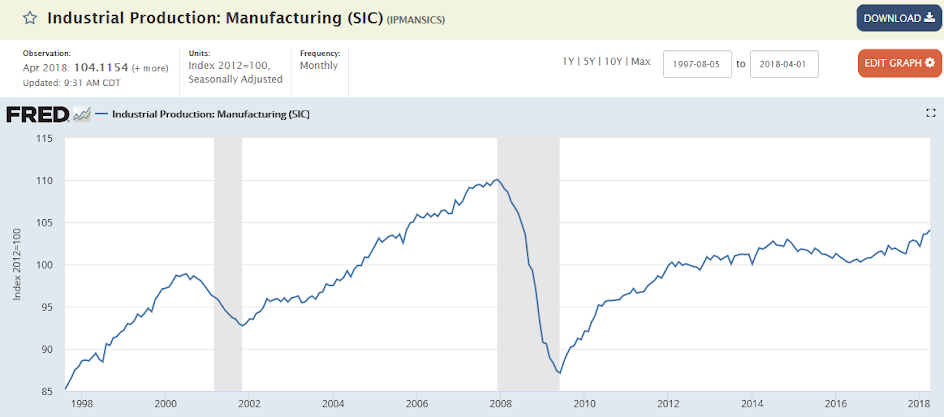
Slowly climbing back to levels historically seen only in recessions, and these numbers are not population adjusted:
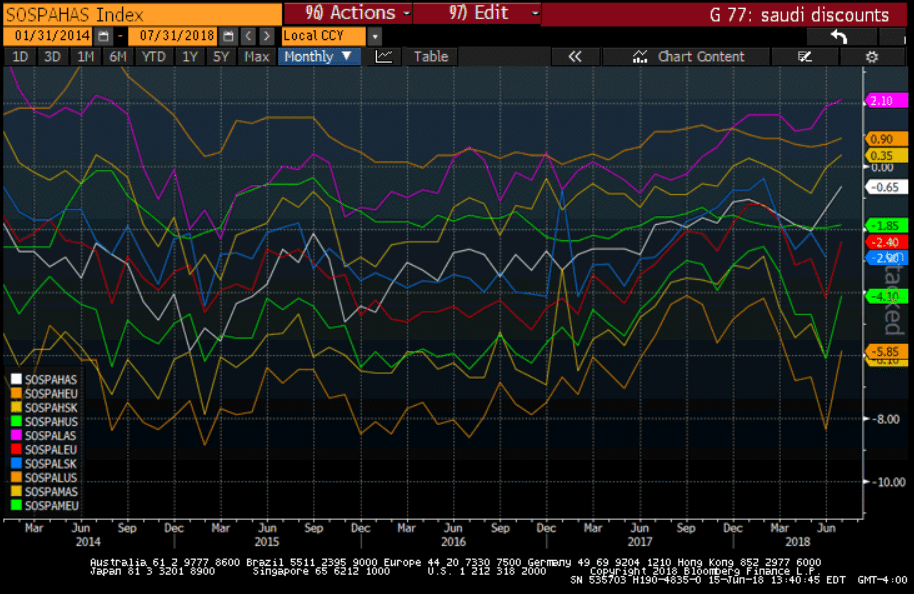
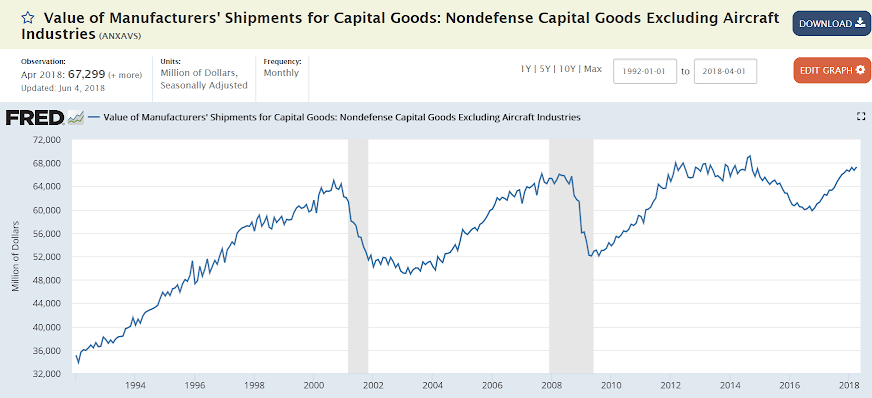
No growth here since oil capex collapsed about 2 1/2 years ago;
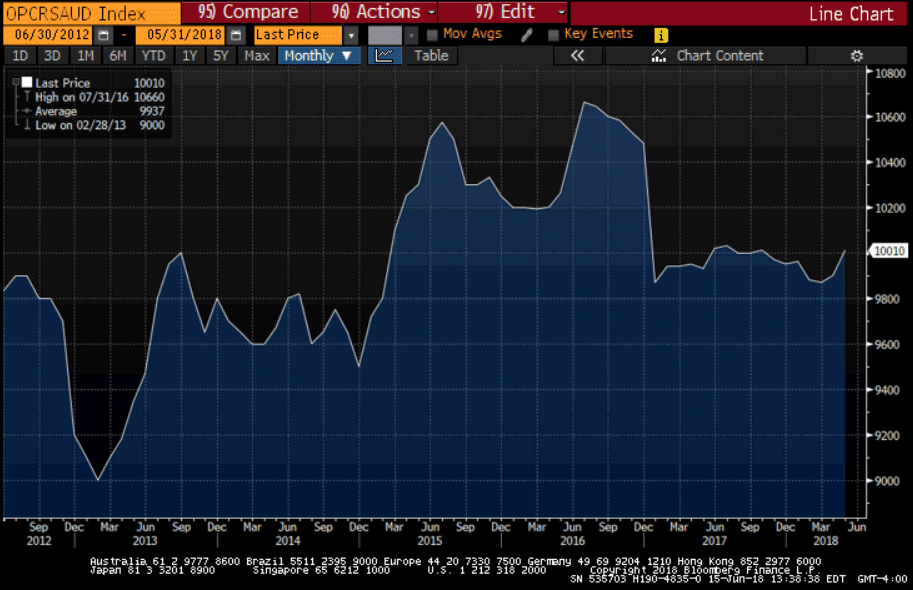
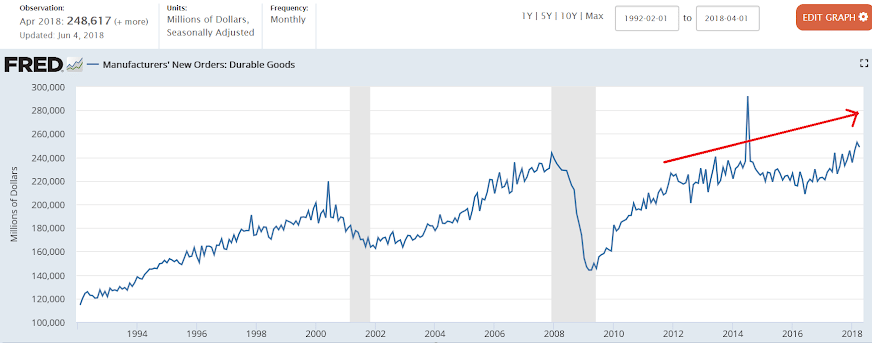
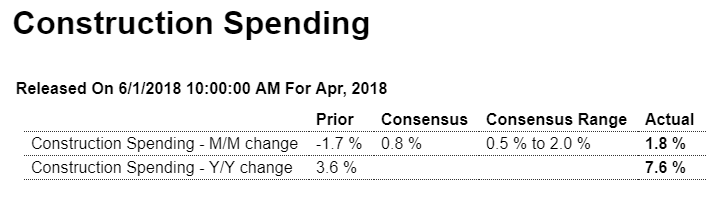
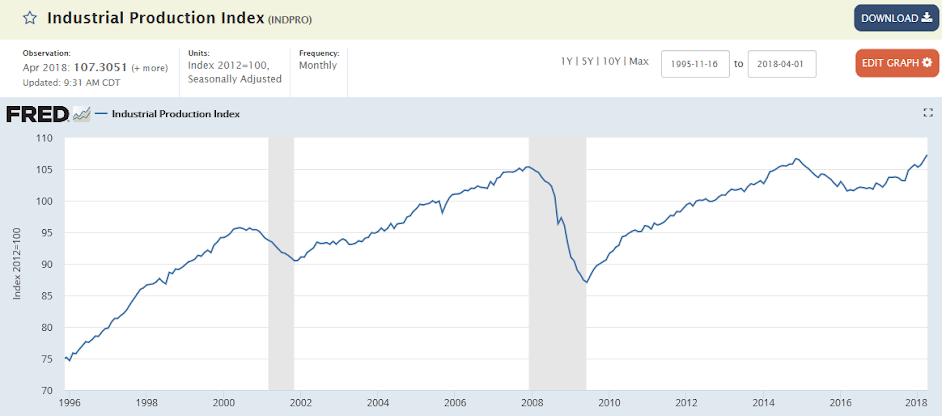
Back through the 2015 highs, growing at modest rates;
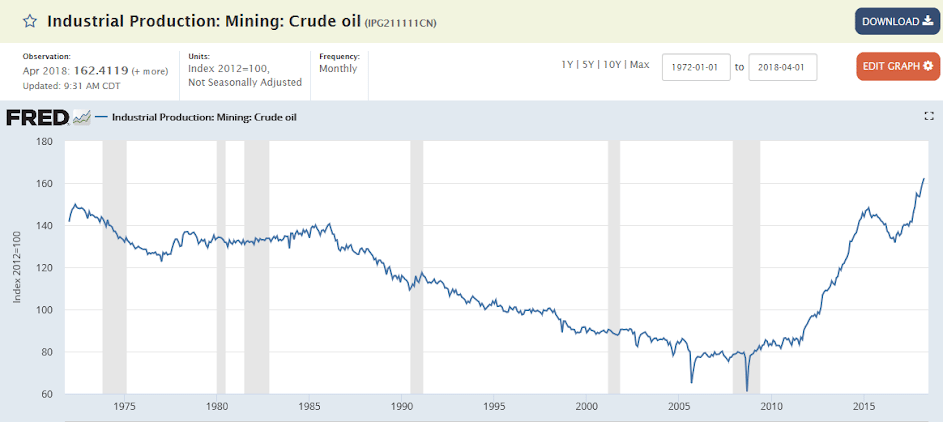
Led by oil, though oil related capital expenditures aren’t back to where they were:
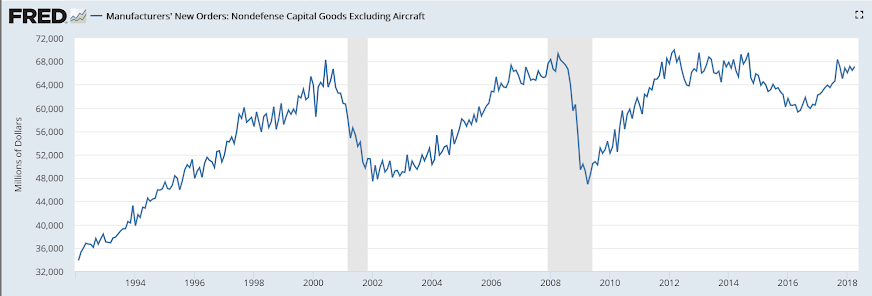
This more general categories have been going mostly sideways since the oil capex collapse:
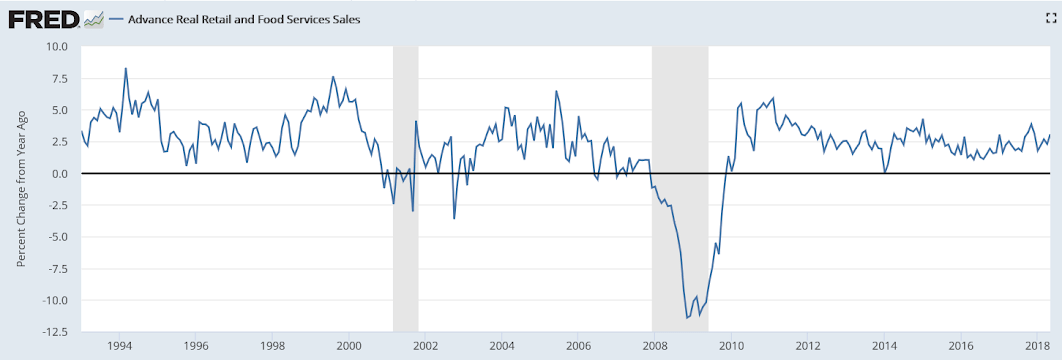
Looks to me like a serious lack of aggregate demand: