Above expectations and indicative of continuous modest growth. However, I have trouble making it all ‘add up’. More comments below:
Highlights
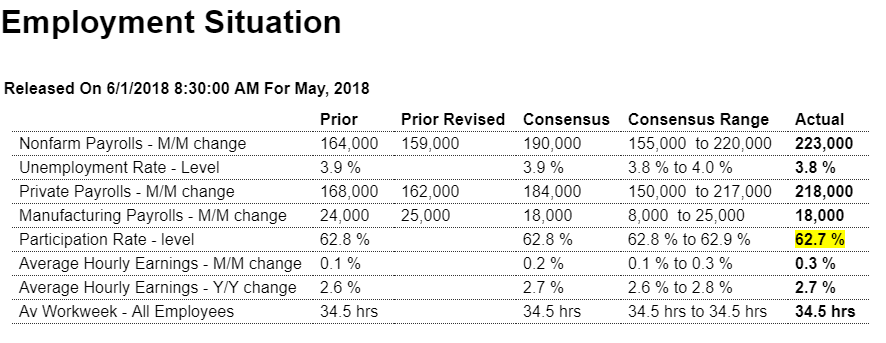
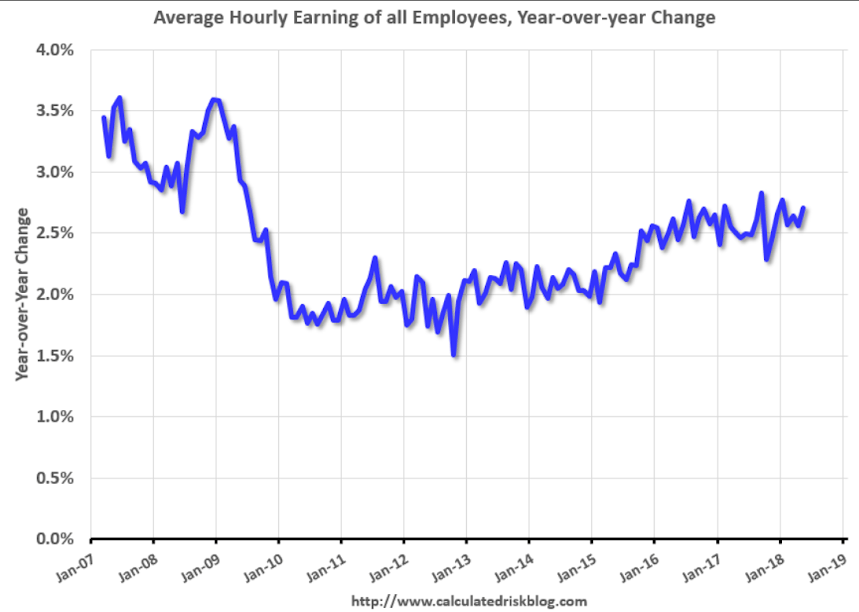
Employment growth is strong and it is not entirely without wage pressure. Nonfarm payrolls rose 223,000 in May to just top Econoday’s high estimate while the unemployment rate moves down a tick to a new expansion low of 3.8 percent. The monthly gain for average hourly earnings came in at the high end of expectations, up 0.3 percent for a year-on-year rate that is up a tenth to 2.7 percent.
Payroll gains are led by trade & transportation, up 53,000 in the month for a sector where delivery delays have been climbing, and include solid 31,000 gains for both retail and also professional & business services with the gain for the latter suggesting that employers are scrambling to fill positions. Manufacturing payrolls rose 18,000 which hits Econoday’s consensus with construction payrolls up 25,000.
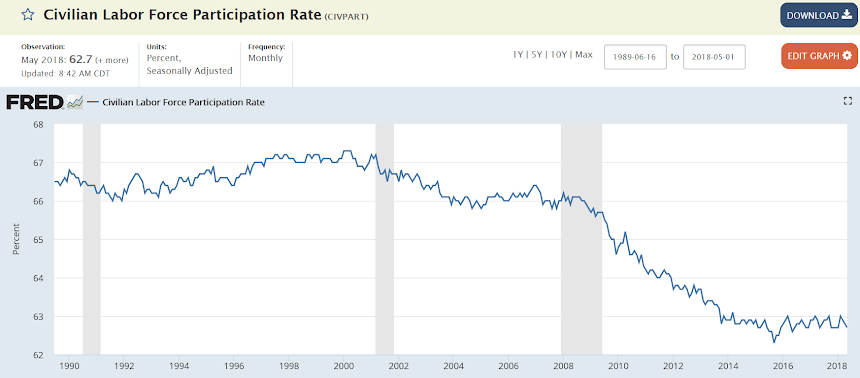
The participation rate moves down a tenth to an even thinner 62.7 percent as the number of people actively looking for work is down 281,000 to 6.065 million. The workweek for all employees is unchanged at 34.5 hours though factory hours and factory overtime are down which point to give back for May’s industrial production report.
But today’s report is about strength and the risk that available slack in the labor force is disappearing and in turn raising the potential of wage inflation. The results clearly support expectations for a rate hike at this month’s FOMC.
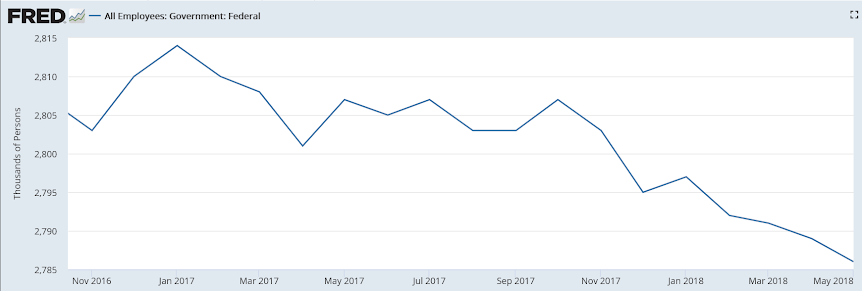
The federal government continues to reduce headcount:
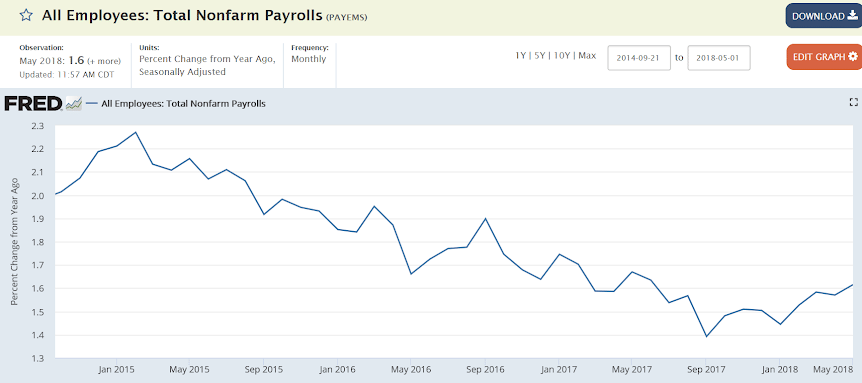
Seems the deceleration in payroll growth reversed around year end, perhaps in reaction to the change in tax laws:
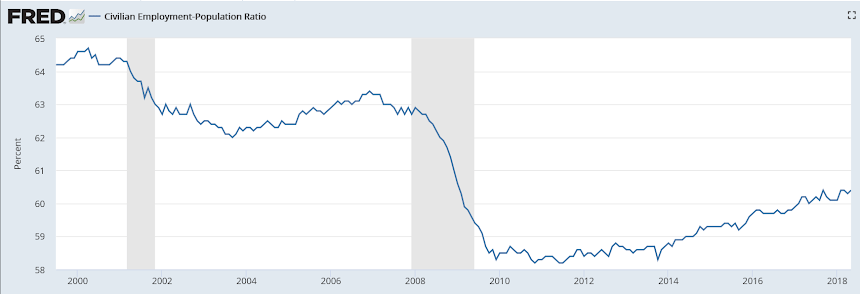
This dropped dramatically with the 2008 recession, recovered only modestly, and most recently seems to have leveled off at historically low levels:
The participation rate began falling with the recession, leveled off for the last two years, and has yet to recover:
Wage growth shows a lack of demand as well:
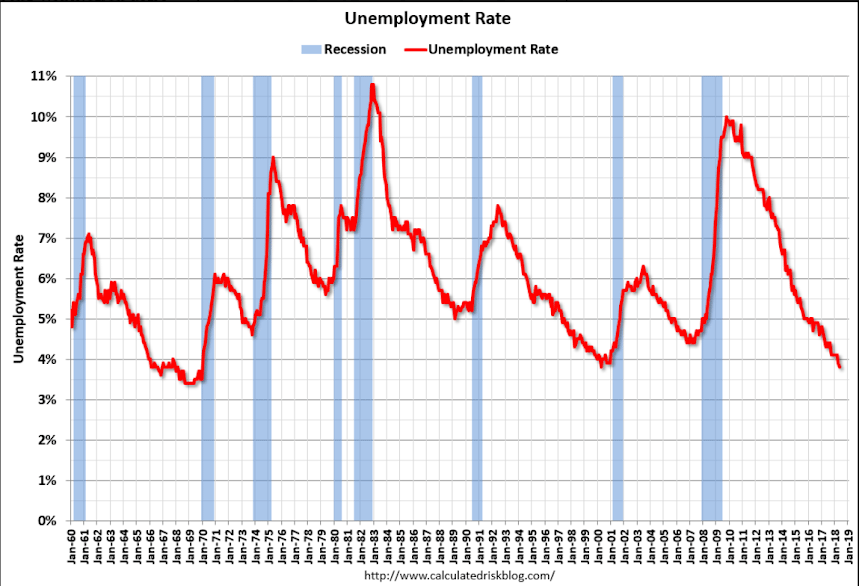
Unemployment as defined has hit a multi cycle low even with weaker wage growth and weaker GDP growth.
Might have something to do with healthcare? Increasingly health insurance is available only through employment? Maybe there’s been a reduction of illegal workers which would also explain in part the reduction in productivity?
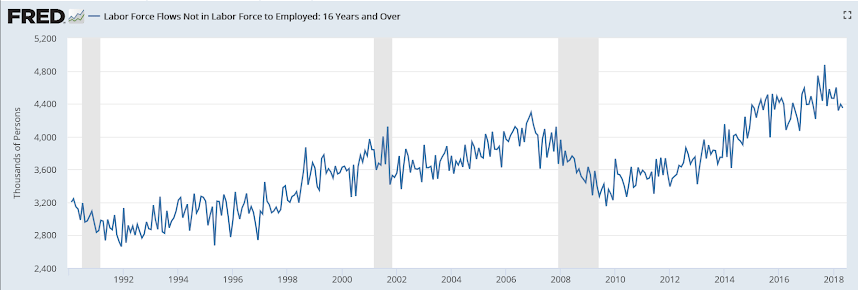
And this chart shows that 4.3 million people took jobs last month who previously were not classified as unemployed and were not even considered as part of the labor force:

Highlights
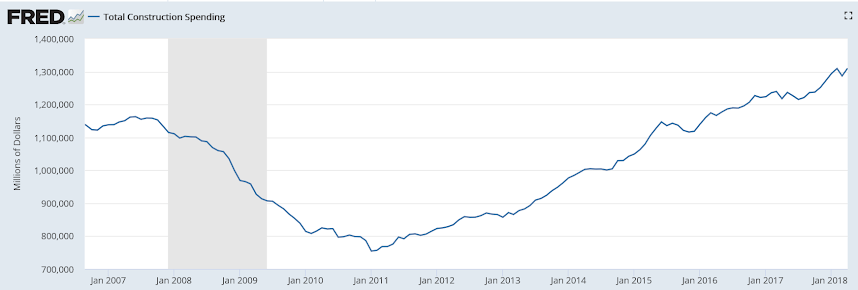
A rebound in multi-family units helped drive construction spending 1.8 percent higher in April to fully reverse the prior month’s 1.7 percent decline. Spending on multi-family units rose 3.6 percent in the month following March’s 4.3 percent decline in a gain, however, that can’t overshadow no change for spending on single-family homes. But home improvements were a big positive rising 0.7 percent in the month.
Non-housing data are mixed with private nonresidential, led by transportation and power, up a strong 0.8 percent but with highways & streets down 1.0 percent.
This report is often very volatile making year-on-year readings useful to gauge trends. And there is clear strength here, with total spending up 7.6 percent including a very strong 9.6 percent gain for single-family homes that puts April’s no change in perspective. Housing is in short supply which has been holding down home sales and the question for the sector is whether builders can pick up their pace to meet demand.
This chart is not adjusted for inflation. On an inflation adjusted basis it’s still short of the prior cycle highs:
