Personal income and spending, Pending home sales

No drama here:

More housing weakness news:

Highlights

This has not been a good run for housing data. Pending home sales fell a very steep 2.6 percent in October which is far below Econoday’s consensus range. Existing home sales did end a long downturn in last week’s report but today’s results point strongly to another leg down for final sales.

The West is the weakest region with pending sales falling very sharply in the month for a year-on-year decline of 8.9 percent. The Midwest and South show single-digit declines with the Northeast a marginal yearly gain. The overall year-on-year rate for pending sales is minus 6.7 percent.

Case-Shiller and FHFA home price data opened the week showing softness followed by yesterday’s tumble for new home sales followed now by a tumble for pending resales. Housing has had a flat year and looks to be limping badly into year end.

Trade, New home sales, Federal interest payments

Trade deficit still increasing:

Highlights

The goods portion of October’s trade deficit is deeper than expected, at $77.2 billion vs expectations for $76.9 billion and compared with a monthly average in the third-quarter of $74.6 billion. October’s data opens fourth-quarter net exports on a negative note following the third quarter when trade pulled down GDP pace by nearly 2 percentage points. Today’s results point to further downward pressure for the fourth quarter.

Exports open the quarter down 0.6 percent to $140.5 billion in October yet are still up 7.8 percent from a year ago. In a possible tariff effect, exports of food, feeds & beverages continue to turn lower, down 6.8 percent in the month to $10.3 billion with this year-on-year rate negative at minus 2.8 percent. Exports of capital goods also fell as did auto exports with consumer goods and industrial supplies showing gains.

Imports, at $217.8 billion, rose only 0.1 percent in October for a year-on-year gain of 10.0 percent. Imports of consumer goods, at $57.4 billion and a sensitive topic in the trade wars, rose an outsized 3.5 percent in October with auto imports up 2.3 percent. Imports of capital goods fell sharply in the month in a negative sign for business investment.

Tariffs effects have been elusive in the nation’s economic data but may now be appearing in the trade data, and the initial results may be holding down GDP.

The housing decline continues:


Rate hikes cause gov interest payments to rise and provide income that works to support the economy:

Home sales, Durable goods, Philly Fed index


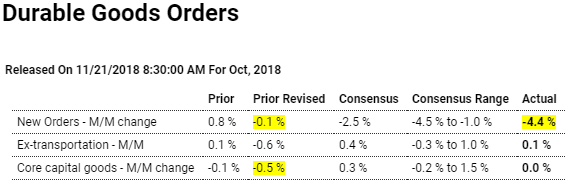
Last month revised lower and looking weak:

Highlights

A drop for primary metals, a sharp drop for machinery, and a reversal for defense aircraft all pulled down durable goods orders in October which fell a sharper-than-expected 4.4 percent. A very sharp downward revision to September, revised from a 0.8 percent gain to a 0.1 percent decline, is another unfavorable headline in today’s report.

Orders for primary metals, down 2.3 and 1.2 percent the past two reports, continue to weaken following tariff-related pre-buying earlier in the year, while orders for machinery — which are at the center of the capital-goods group — fell 0.5 percent in October following lifeless gains of 0.1 and 0.2 percent in September and August.

Defense aircraft was the star of the September report, more than doubling but orders in the latest month fell 59 percent. Civilian aircraft, which had been on the climb, has been pulling down the last two reports, down 21 and 19 percent. When excluding aircraft and all other transportation equipment, orders managed only a 0.1 percent gain to fall 3 tenths short of consensus.

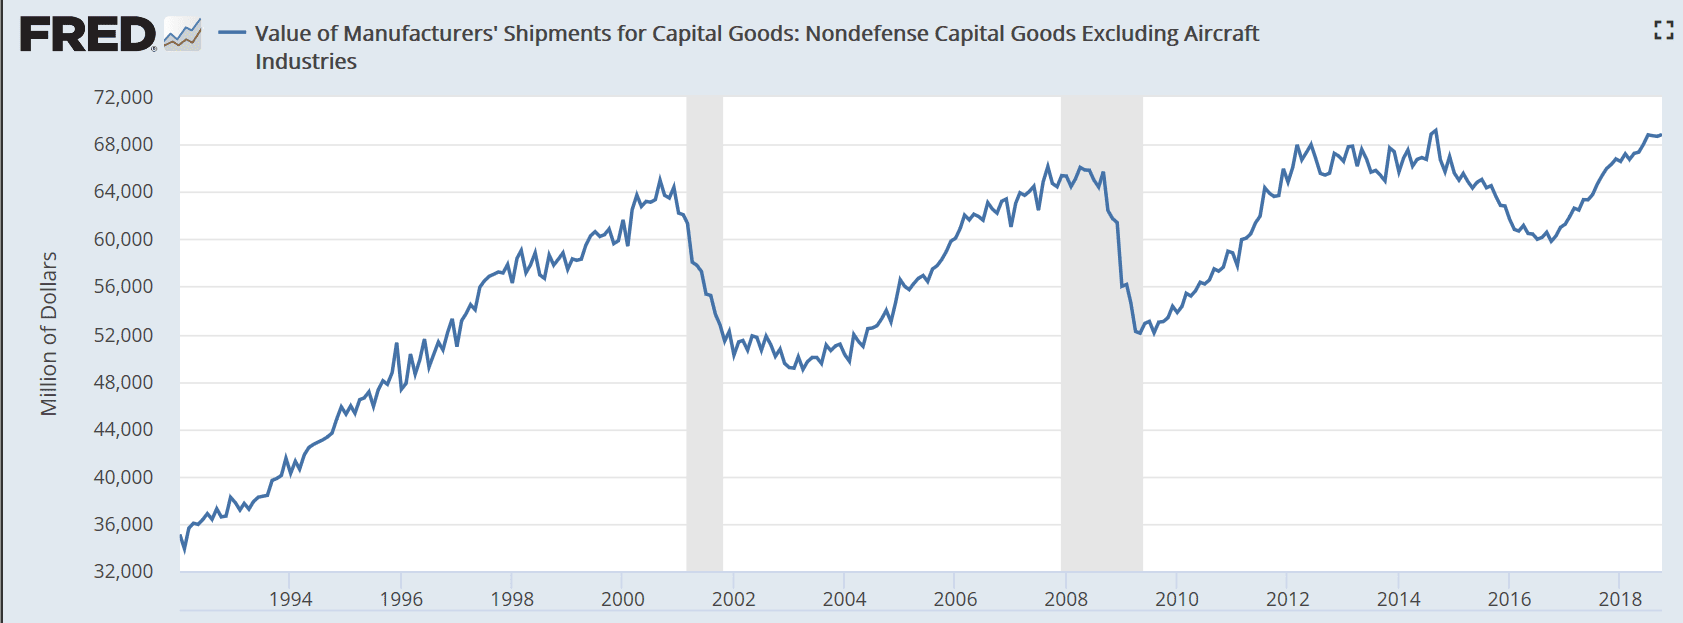
Orders and shipments for capital goods (nondefense ex-aircraft) are key indications for GDP business investment and the readings in this report are not pointing to much of a rebound for fourth-quarter nonresidential fixed investment. Orders here came in unchanged in October to miss Econoday’s consensus by 3 tenths with September revised 4 tenths lower to a 0.5 percent decline. Shipments in October, which will be a direct input into fourth-quarter GDP, did rise a respectable 0.3 percent though September is revised 1 tenth lower to a 0.2 percent decline which will be marginal negative for third-quarter GDP revisions.

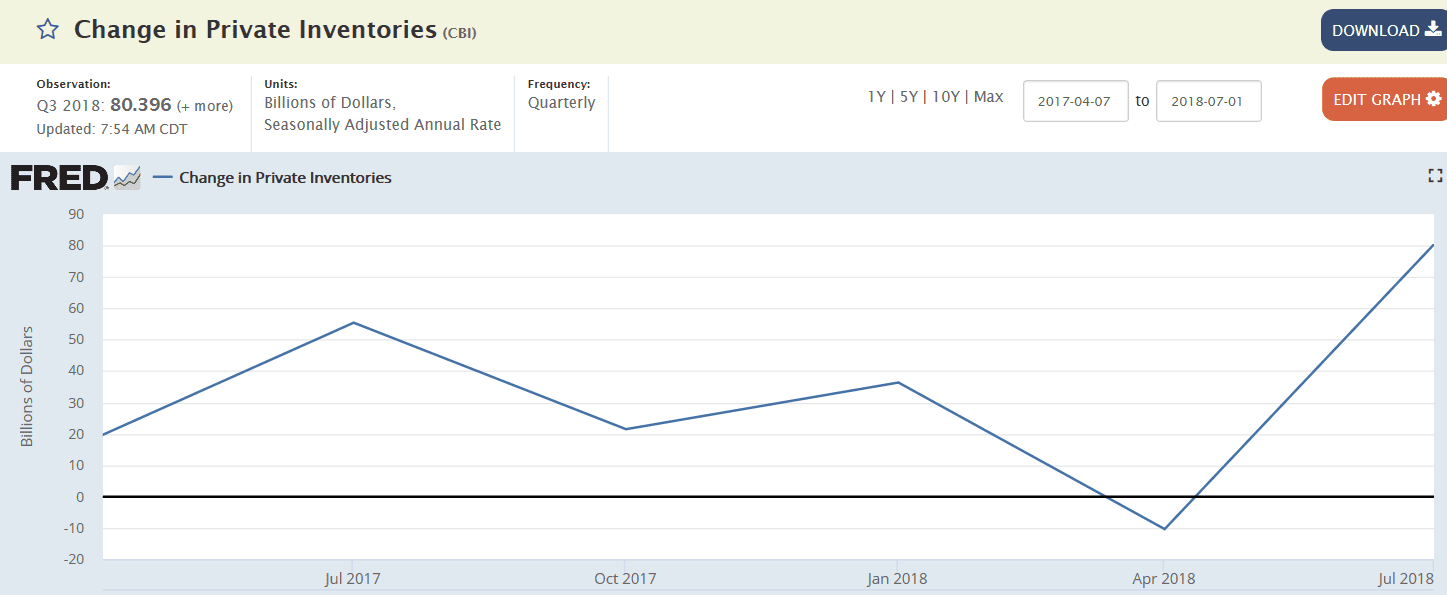
But there are solid positives in the report including sharp order gains for electrical equipment, communications equipment, computers, and also fabrications. Yet moderation is nevertheless today’s theme with total shipments falling 0.6 percent, inventories showing no growth, and unfilled orders, after two strong prior months, slipping 0.2 percent.


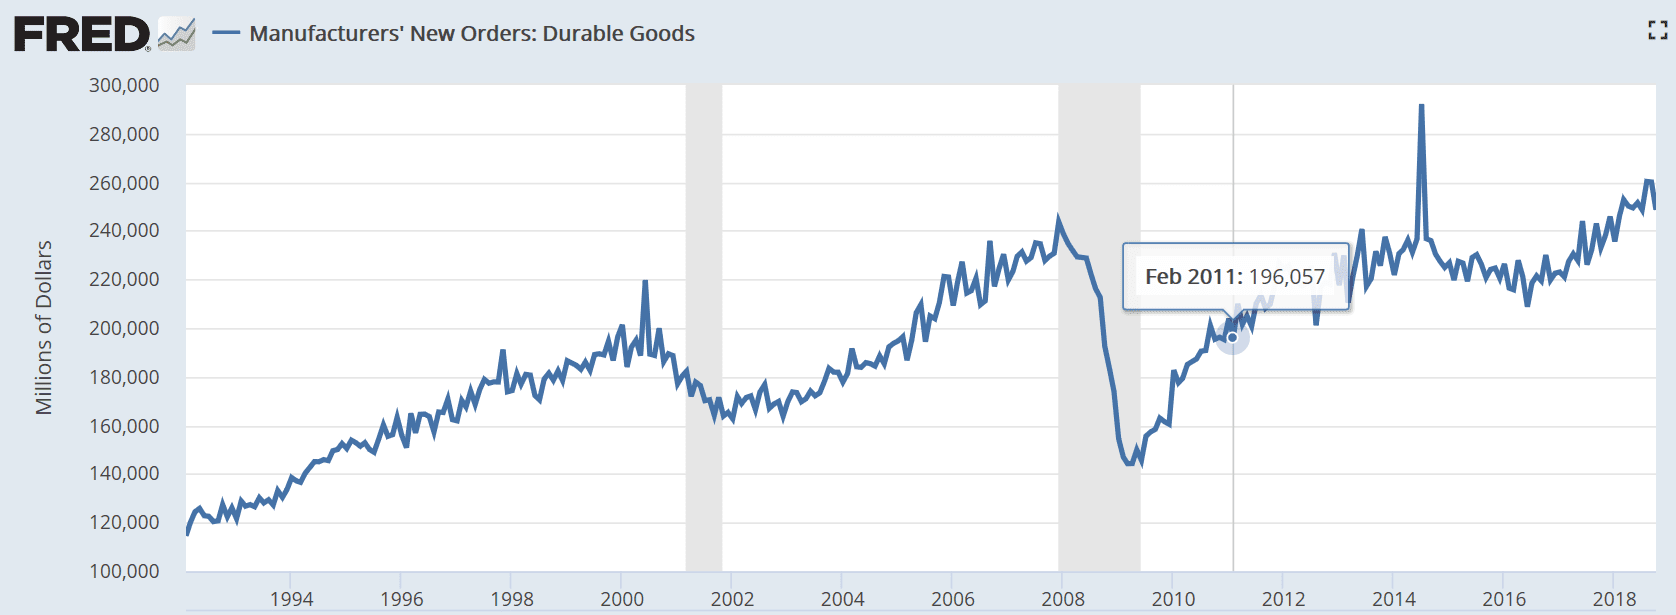
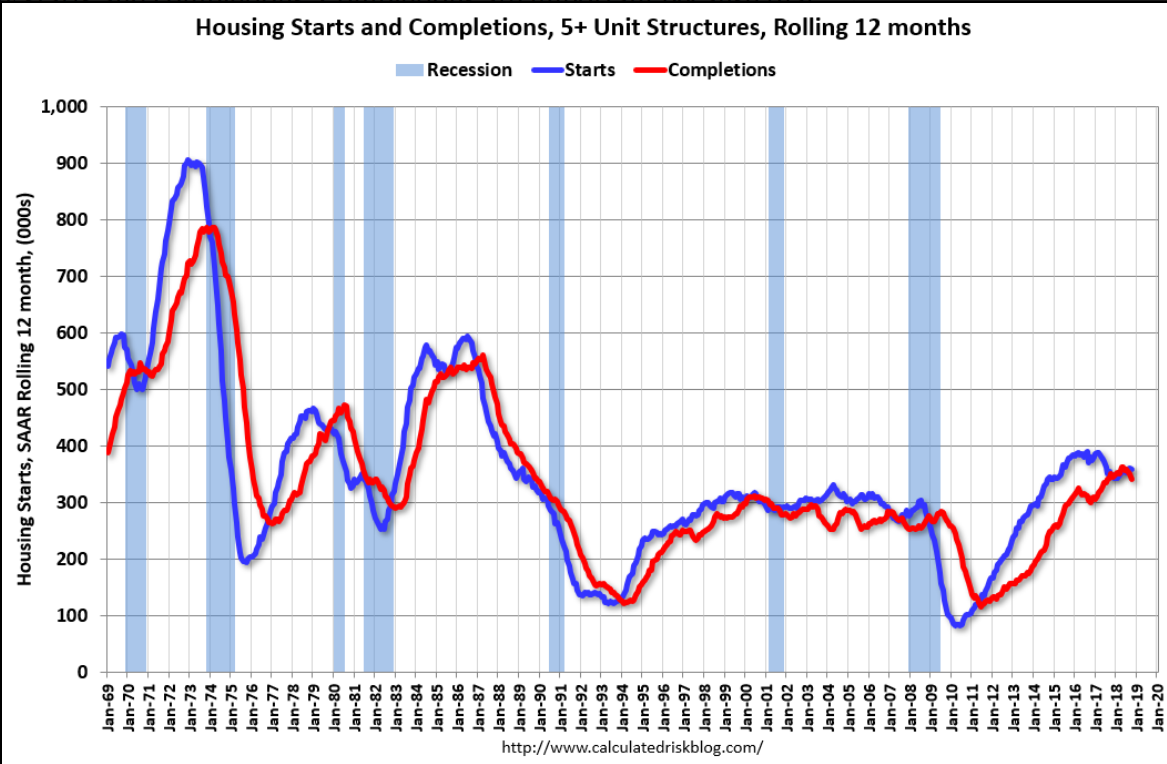
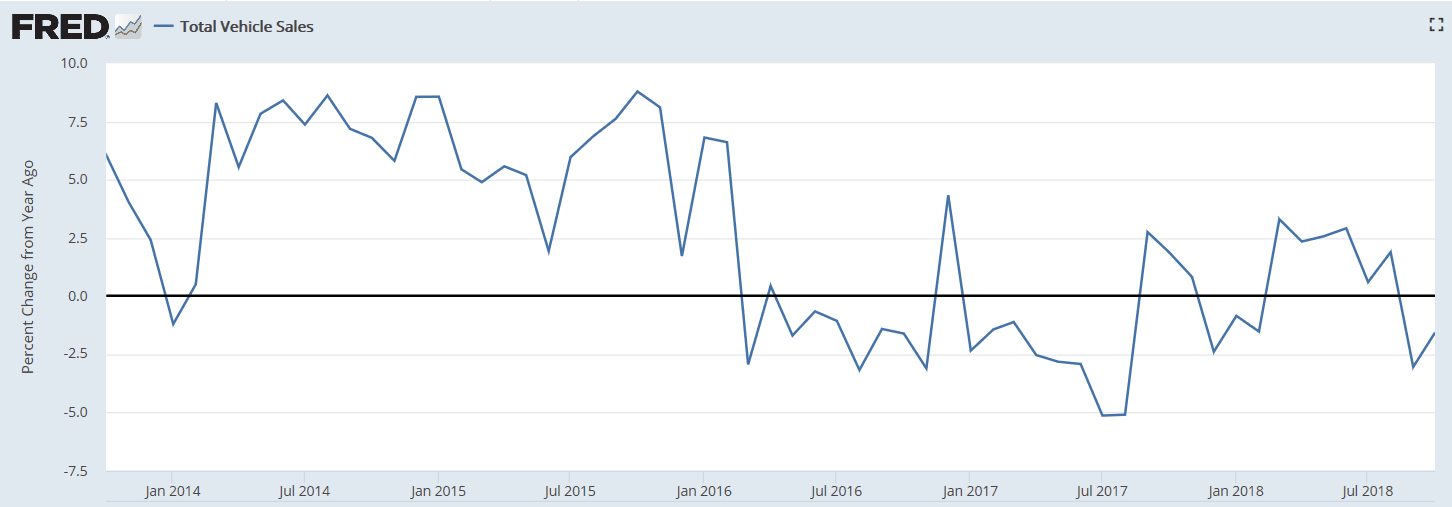
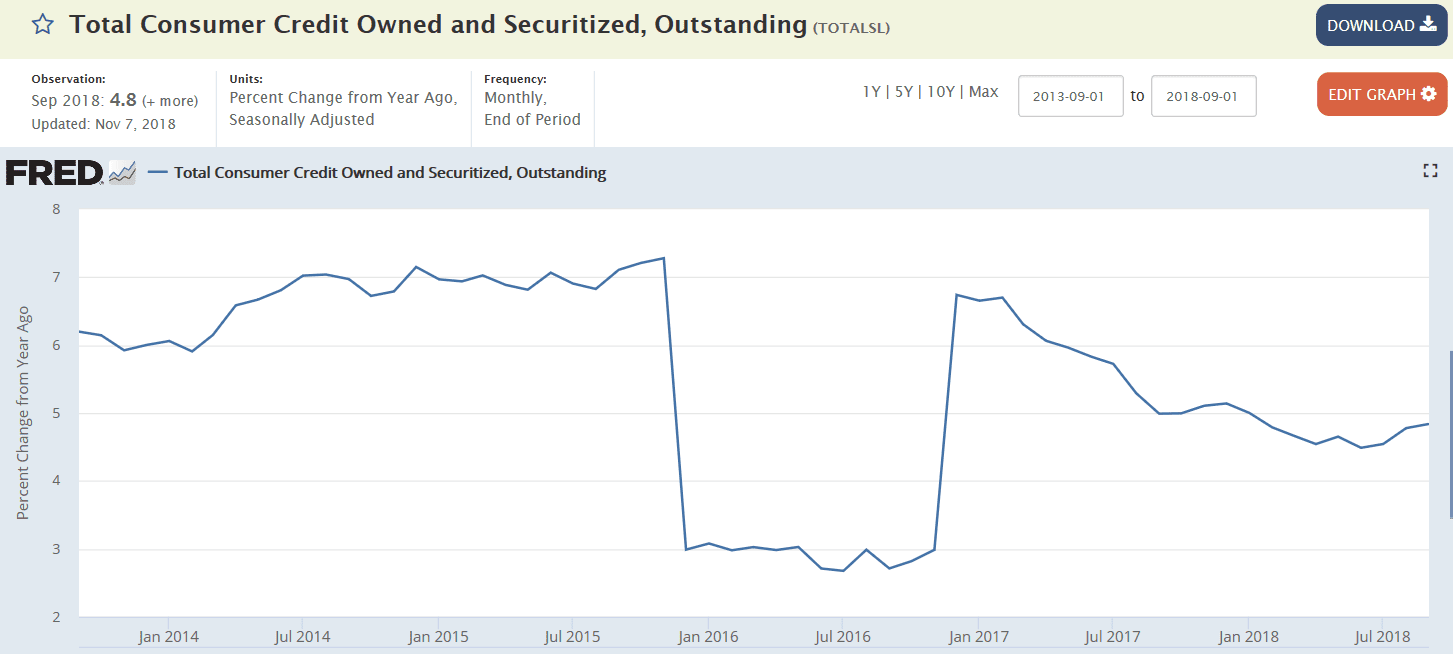
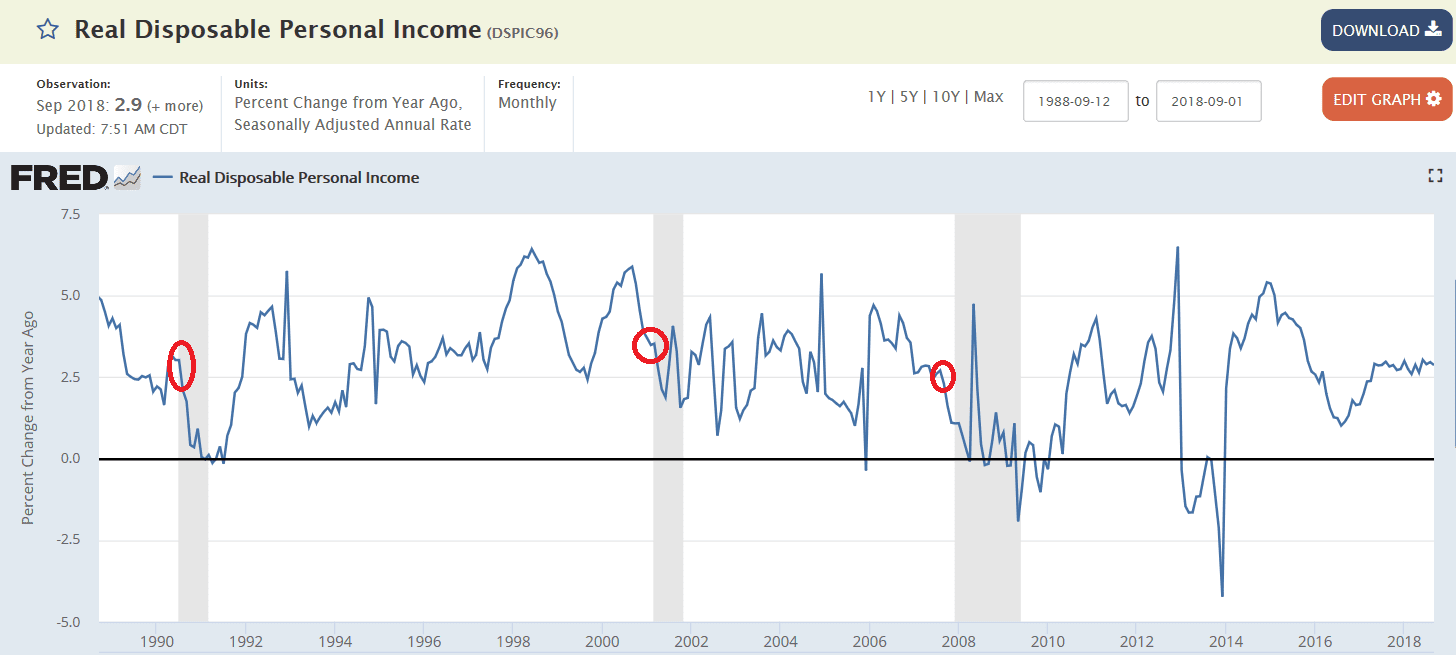
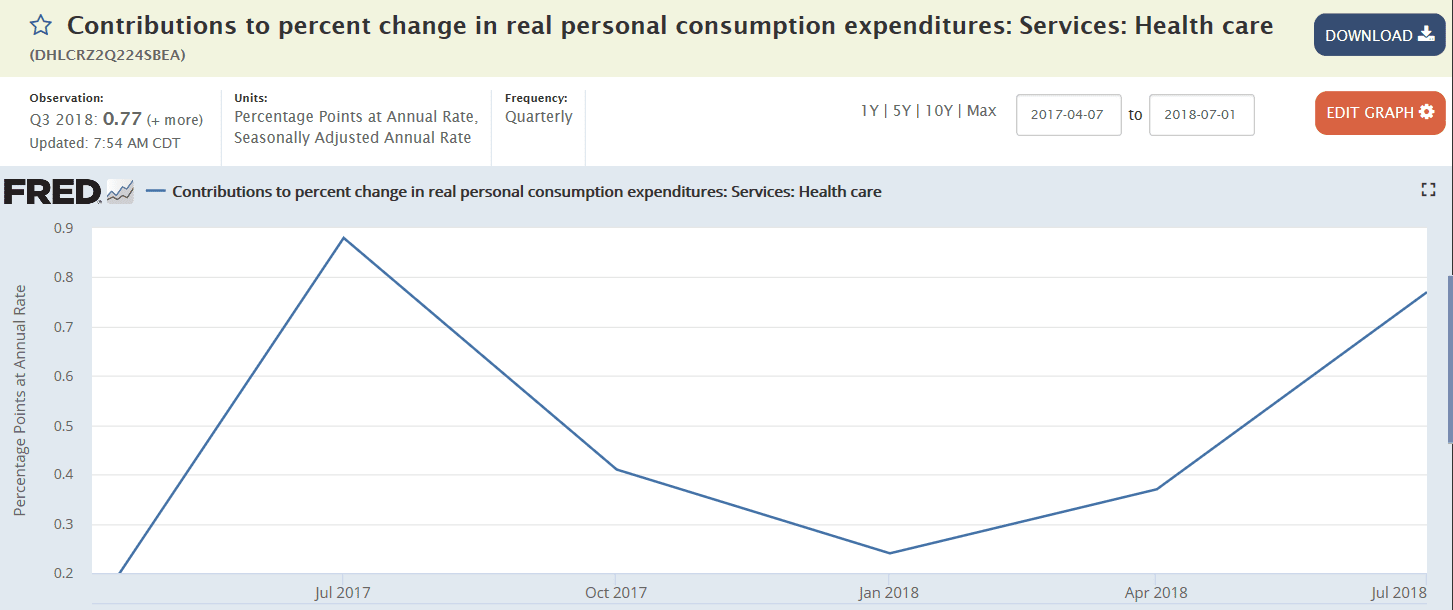
Consumer goods remain weak and below 2008 levels, and the chart is not inflation adjusted:

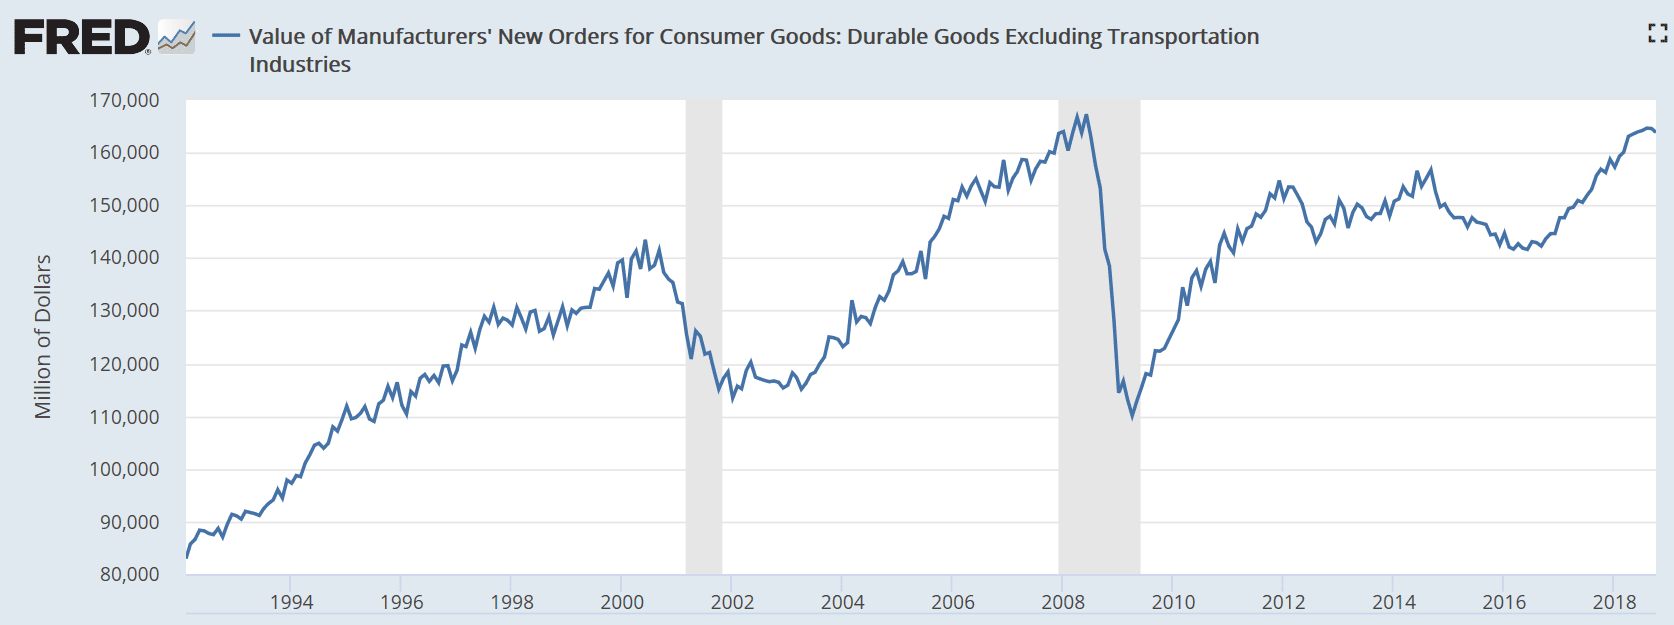
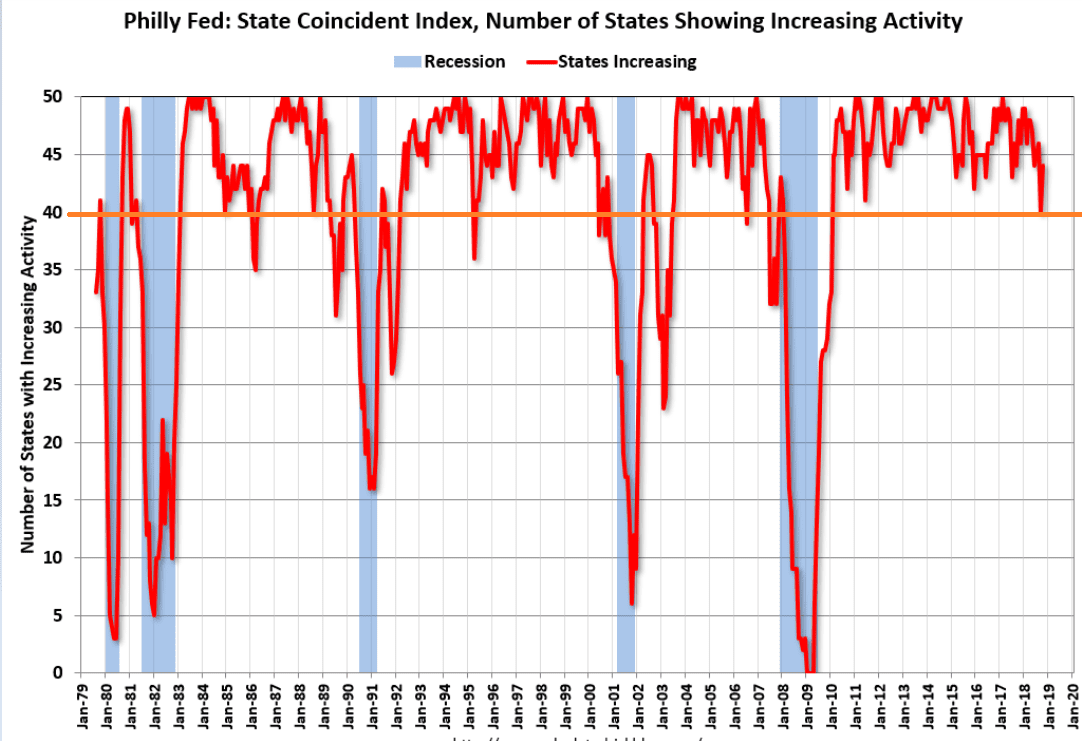
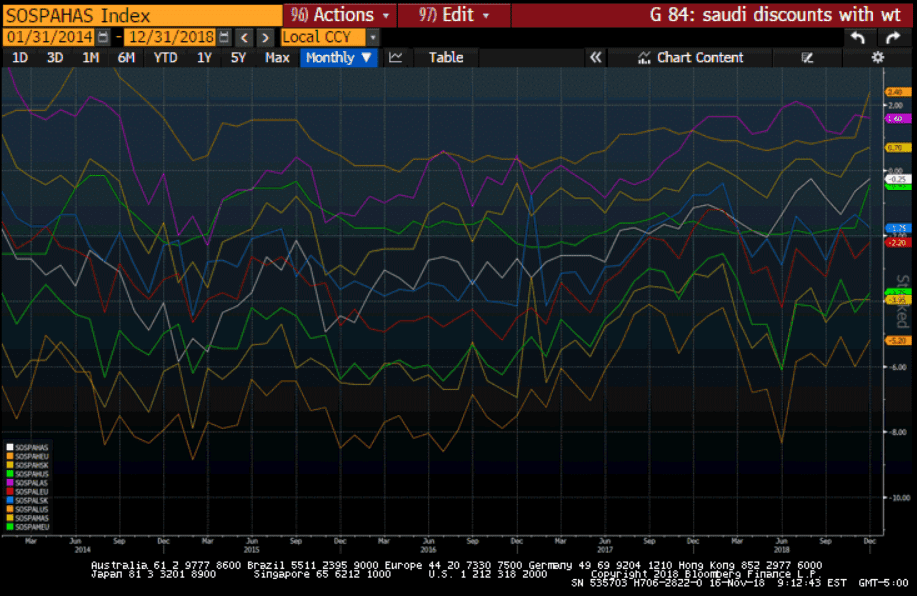
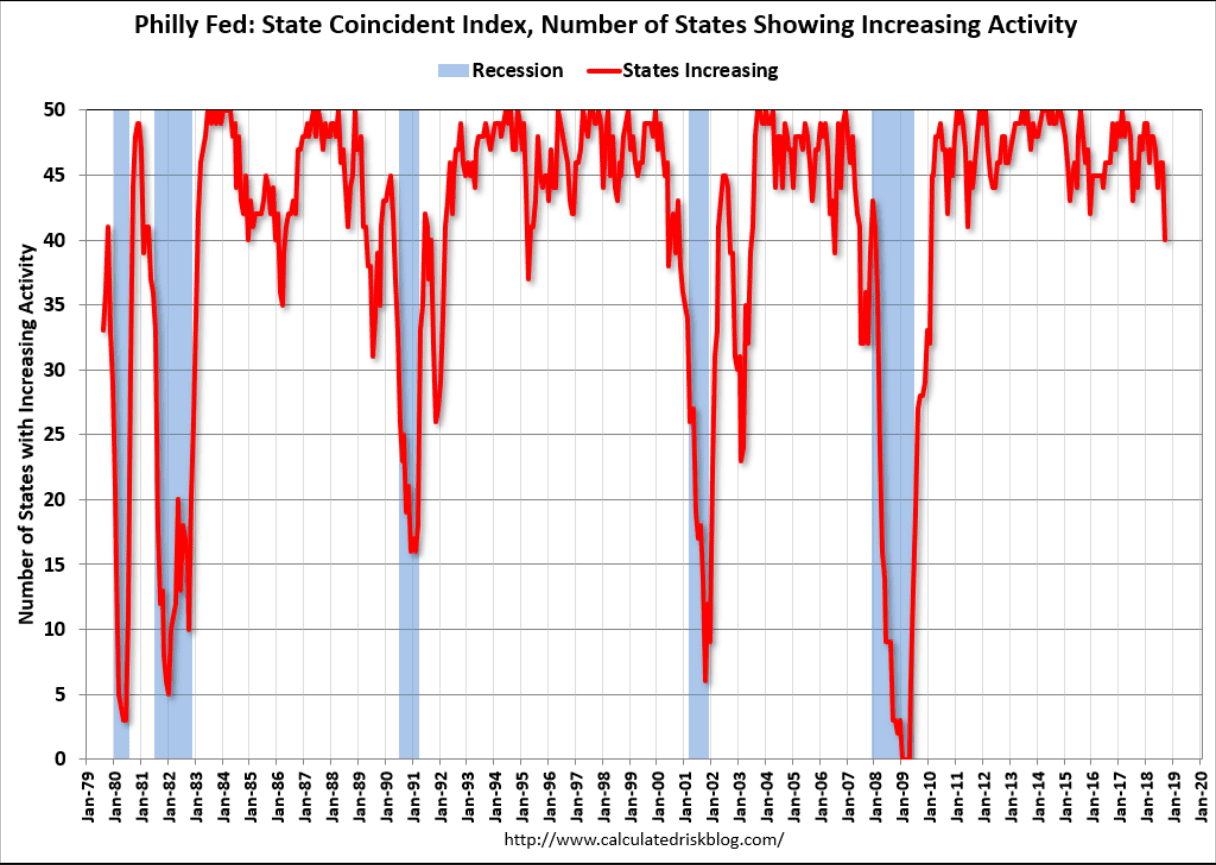
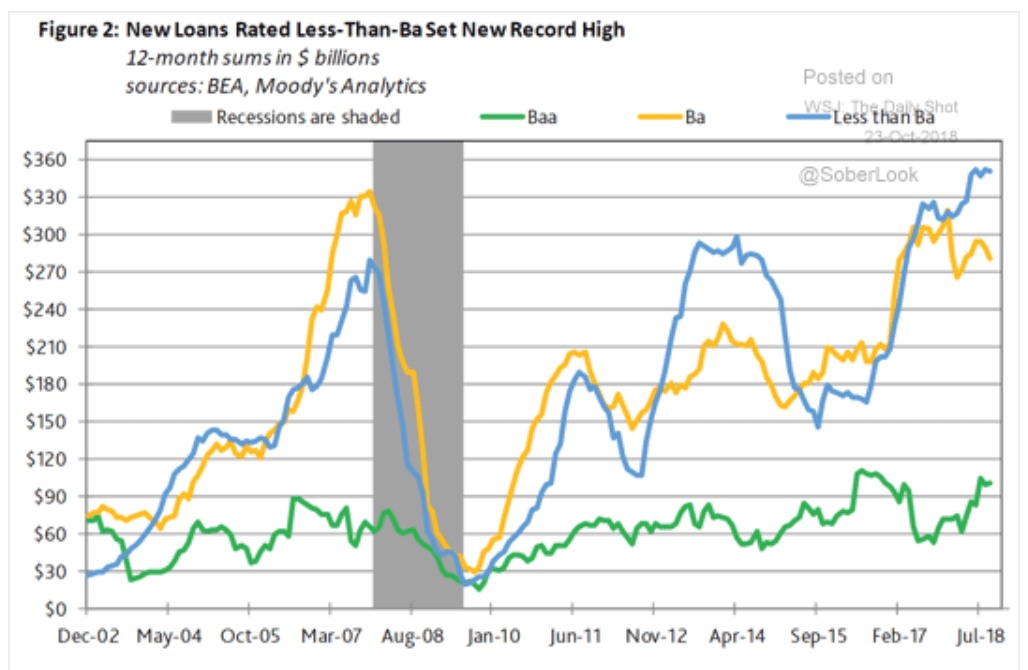
Once again this index has fallen to levels associated with entering recession. But last time this happened a few years back they revised the numbers a few months later to where they are now in the chart:

Housing starts

Not good:

Highlights

Yesterday’s housing market index may have unexpectedly plummeted but today’s housing starts and permits report, though soft, at least is in the ballpark of expectations. Starts in October rose 1.5 percent to a 1.228 million annualized rate that compares with Econoday’s consensus for 1.240 million. Permits edged past expectations, at a 1.263 million rate vs a consensus for 1.260 million though down 0.6 percent from September.

The good news on starts comes from multi-family units, jumping 10.3 percent to a 363,000 rate which offsets a second straight decline for single-family starts which slipped 1.8 percent to an 865,000 rate. Hurricane Michael which struck Florida and Georgia during October but did not skew the data as starts in the South rose 4.7 percent. Starts were also strong in the Midwest with the West and Northeast posting declines.

Permits show nearly equal declines for single-family and multi-units, down 0.6 percent and 0.5 percent respectively. The bad news on the permit side comes from the West which is a focused region for home builders and which declined 7.9 percent for a 17.2 percent year-on-year drop.

And the year-on-year rates do underscore the weakness in housing with total starts down 2.9 percent and total permits down 6.0 percent. Completions aren’t doing much better, down 3.3 percent overall in the month for a year-on-year drop of 6.5 percent. Single-family completions fell 1.2 percent in the month with multi-family completions down 9.1 percent in results that won’t be giving any boost to underlying sales.

Rising mortgage rates, tied directly to Federal Reserve rate hikes, are proving a major headwind for housing as are material and labor shortages. However strong the 2018 economy has been, housing is not part of the success story.

Mtg apps, China exports, Oil

Continuing to be negative year over year:

Highlights

Rising interest rates continue to dampen mortgage activity, with purchase applications for home mortgages falling a seasonally adjusted 2.3 percent in the November 9 week to the lowest level since February 2017 while refinancing applications decreased by 4.3 percent to the lowest level since December 2000. Unadjusted, purchase applications fell further into negative year-on-year territory and were 3 percent below their level in the same week last year. The refinance share of mortgage activity rose 0.3 percentage points from the prior week to 39.4 percent. Climbing to the highest level since 2010, the average interest rate on 30-year fixed rate conforming mortgages ($453,100 or less) was up 2 basis points from the prior week to 5.17 percent.

Trade issues taking their toll and bringing down the entire global economy:

Sometimes the headlines make no sense to me vs the data…

Consumer credit, Employment

Highlights

Consumer credit growth slowed more than expected to just $10.9 billion in September, below Econoday’s consensus range and less than half of the upwardly revised $22.9 billion August increase. Growth slowed in nonrevolving credit, which rose $11.2 billion in September versus $18.3 billion previously, while growth in revolving credit stalled completely and posted a marginal decline of $0.3 billion. Gains in nonrevolving credit reflect vehicle financing and student loans while gains in revolving credit reflect credit-card debt.

Today’s report shows that despite strong employment, consumers were cautious in September after splurging a little in August and chose to pay down some of their credit card debt instead. While it may be a plus for household wealth, the thriftiness exhibited is not a plus for consumer spending and the GDP.

Highlights

In a very strong showing in which wage pressures may be less severe than they look, October’s nonfarm payroll growth easily surpassed expectations, rising 250,000 in the month and with strength centered in two sensitive components to economic pivots: manufacturing with a much higher-than-expected 32,000 gain and professional & business services where payrolls rose 35,000. And available labor in construction is now more scarce with payrolls here up a very sharp 30,000.

Average hourly earnings posted an expansion high year-on-year rate, up 3 tenths to 3.1 percent. But, importantly, this reflects an easy comparison with October last year. The month-to-month pace actually eased, rising at 0.2 percent vs two 0.3 percent gains and one 0.4 percent gain in the three prior reports.

The unemployment rate held at a low and favorable 3.7 percent with the labor participation rate improving 2 tenths to 62.9 percent.

The monthly slowing in wages removes at least some of the urgency felt by the hawks at the Federal Reserve who were voicing their views at the September FOMC that policy may, in a need to cool the economy and the labor market, have to rise beyond neutral and into the restrictive zone. The Fed may not raise rates at their meeting later this month, but today’s report does confirm, and strongly so, expectations for a rate hike at the December FOMC.

Housing prices, Consumer confidence, Investment

More housing weakness:

Highlights

Growth in home prices, as it is for home sales, is almost at a standstill, at least on a monthly basis for Case-Shiller’s 20-city adjusted index which inched only 0.1 percent higher in August. Year-on-year, the unadjusted index is still growing at healthy rate of 5.5 percent which, however, is down from 6.8 percent as recently as March and is the lowest rate since December 2016.

Outright monthly declines were posted in two cities where price traction is clearly slipping, Seattle at minus 1.0 percent in the month for year-on-year growth still very strong at 9.6 percent, and San Diego which fell 0.3 percent in the month for a mediocre year-on-year rate of 4.8 percent.

Las Vegas is once again the big headliner in the data, posting 1.1 percent monthly growth in August following 1.2 and 1.1 percent in the prior two months. Las Vegas leads the year-on-year growth rates at 13.9 percent. At the bottom, however, remain Washington DC and New York City at only 2.8 percent growth with Chicago little better at only 2.9 percent.

These results and trends are consistent with weakness seen in last week’s FHFA house price index as well price data in the existing home sales report. However strong the 2018 economy is, it doesn’t include home prices which are a central source of household wealth.

Confidence remains high:

Highlights

The consumer confidence index continues to hold near 18-year highs, at 137.9 in October vs a revised 135.3 in September. The index remains within striking distance of the all-time high at 144.7 reached in 2000.

A closely watched reading in this report, one used by forecasters to track the monthly employment report, is pointing to increasing strength for the labor market. Those saying jobs are currently hard-to-get fell nearly 1 percentage point to 13.2 percent. Strength in the labor market is also indicated by a 1.8 percentage rise in a less closely watched reading: those who say jobs are currently plentiful which is now at 45.9 percent.

Hiring and investment are largely functions of sales, not marginal income tax rates per se. So only to the extent that the lower tax rates somehow increase top line growth would hiring and investment tend to increase;

Most firms haven’t accelerated hiring or investments as a result of GOP tax cuts

(The Hill) Most firms haven’t accelerated hiring or investments as a result of the tax-cut law enacted by Republicans last year, according to a new survey by the National Association for Business Economics (NABE). Eighty-one percent of NABE members surveyed said the 2017 law, known as the Tax Cuts and Jobs Act, hasn’t led their firms to make changes to hiring or investment plans. More than three quarters of respondents said trade-policy changes haven’t affected their hiring, investment or pricing plans. NABE members work for private sector companies or industry trade associations.

Personal income and spending, GDP comments, Philly index

Income less than expected, spending ok, so savings fell:

Highlights

Income growth proved very slight in September with inflation steady and moderate and right on the Federal Reserve’s target. Personal income inched only 0.2 percent higher in September which misses the low end of Econoday’s consensus range. Wages & salaries are September’s weak link, managing only a 0.2 percent gain. When stripping out taxes and looking at inflation-adjusted data, disposable income gained only 0.1 percent in September.

Consumers had to slow their savings efforts to fund spending in the month as the savings rate fell 2 tenths to 6.2 percent. But spending was solid, at 0.4 percent in September with August revised 2 tenths higher to 0.5 percent. Spending on durables, reflecting strong vehicle sales that may have gotten a lift on replacement demand from Hurricane Florence, jumped 1.4 percent in the month with spending on nondurables and services both at 0.3 percent.

If you’re a Fed policy maker, it’s impossible to do any better than this on inflation as both the overall PCE price index and the core came in exactly on target, at 2.0 percent year-on-year rates. Monthly rates show the overall index up 0.1 percent and the core at 0.2 percent.

Though inflation proved steady in September, it had been on an uptrend evidenced by last September’s core rate which was at 1.5 percent. The current on-target result justifies the Fed’s efforts and forecasts and though income is stubbornly weak, consumer spending is alive and well and is another factor confirming a path ahead of gradually rising interest rates.

On the low side of what’s needed to sustain growth:


From the GDP release; Inventory building is most often reactive;


Dipping again into the danger zone. Last time it dipped this much and more they revised the numbers originally reported and it went away.

GDP, Pending home sales, new home sales, leveraged loans, 3M chart

Looks like without the build in private inventories GDP was about 2% lower at about 1.4%, and health care added .77% where health care premiums paid count as personal consumption. Also, the price index deflator was lower by 1.3%:


Bad:


Bad:

Highlights

Lack of available new homes has been holding sales down this year though supply did move into the market in September, up 2.8 percent to 327,000 for a very strong 16.8 percent year-on-year gain that underscores how busy home builders have been. But relative to sales, given how weak they now have turned, supply is suddenly over 7 months at 7.1 vs 6.5 months in August and 5.3 months in September last year.

Prices were flat in the month, up 0.3 percent to a median $320,000. Yet this may be rich relative to sales as the year-on-year slippage in the median, at minus 3.5 percent, is well below sales which are at minus 13.2 percent.

Regional sales data include a 12.0 percent drop in the West where year-on-year sales are at minus 15.8 percent. The Midwest is doing the best, up 6.9 percent in the month for a yearly gain of 4.1 percent.

Buyer blahs in the housing sector are one of the chief and unwanted features of the 2018 economy. Rising mortgage rates, now over 5 percent for 30-year fixed loans, aren’t helping though the strength of the jobs and stock markets should be pluses. September’s showing is lowest rate since July last year and follows last week’s disappointing results for existing home sales. Watch tomorrow for the pending home sales index where expectations are already very soft.