Employment, US PMI’s, Factory orders, Japan sales tax, HK, MMT comments

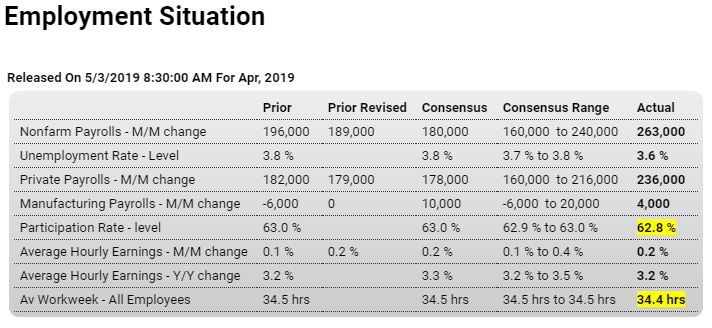
Headline number looks promising. The question is whether employment will lag the other indicators that are decelerating, or provide the support that turns them around. And note the .1 drop in the work week is equivalent to maybe to something over 100,000 jobs:
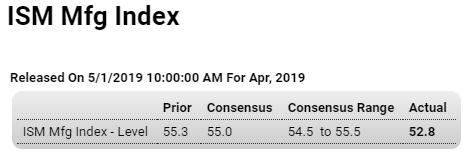
Highlights

That sound you hear is the economy revving up. Nonfarm payroll growth easily beat expectations at 263,000 in April as did the unemployment rate with an outsized 2 tenths decline to a 49-year low of 3.6 percent. Wages didn’t show any immediate jolt from the strength, coming in as expected for the monthly rate, at 0.2 percent, and 1 tenth under expectations for the year-on-year rate at 3.2 percent.

Tightening conditions are the signal from the pool of available workers which continues to be drained, down nearly 500,000 in the month to 10.9 million. The participation rate, reflecting the decline, fell 2 tenths to a lower-than-expected 62.8 percent.

Payrolls are headed by a second sharp gain for construction, up 33,000 in April after 20,000 in March, for a sector where scarcity of labor especially skilled labor has been an ongoing theme. Perhaps topping construction for April’s payroll highlight is a 76,000 surge in professional & business services that includes an 18,000 jump in temporary help. The strength here, which adds to prior gains, indicates that businesses, in an effort to get the people they need immediately, are turning to contractors to fill slots. Government payrolls are also very strong, up 27,000 in April.

The latest unemployment drop was for the wrong reason

The nation’s unemployment rate sank in April to the lowest rate since December 1969, but the milestone comes with a big caveat: The decline stemmed from more people quitting their search for work.

The jobless rate slipped to 3.6% last month from 3.8% in March, continuing a long downward arc from a 27-year high of 10% in 2009. Yet that doesn’t mean there aren’t some potential trouble spots.

Take the size of the labor force. It contracted in April by nearly half a million people and fell for the fourth straight month.

The last time the labor force fell four months in a row was during the waning stages of the 2007-2009 Great Recession. And before that one has to go back to 1950.

As a result, the so-called labor-force participation rate slipped to 62.8% from a six-year high of 63.2% in January. That is, every 63 of 100 able-bodied Americans 16 or older either have a job or are seeking one.

The shrinking labor force “is the primary factor behind the unexpected decline in the unemployment rate,” noted chief economist Richard Moody of Regions Financial.

This is from the household survey. The two surveys tend to converge over time, and the payroll survey is much larger and less subjective:

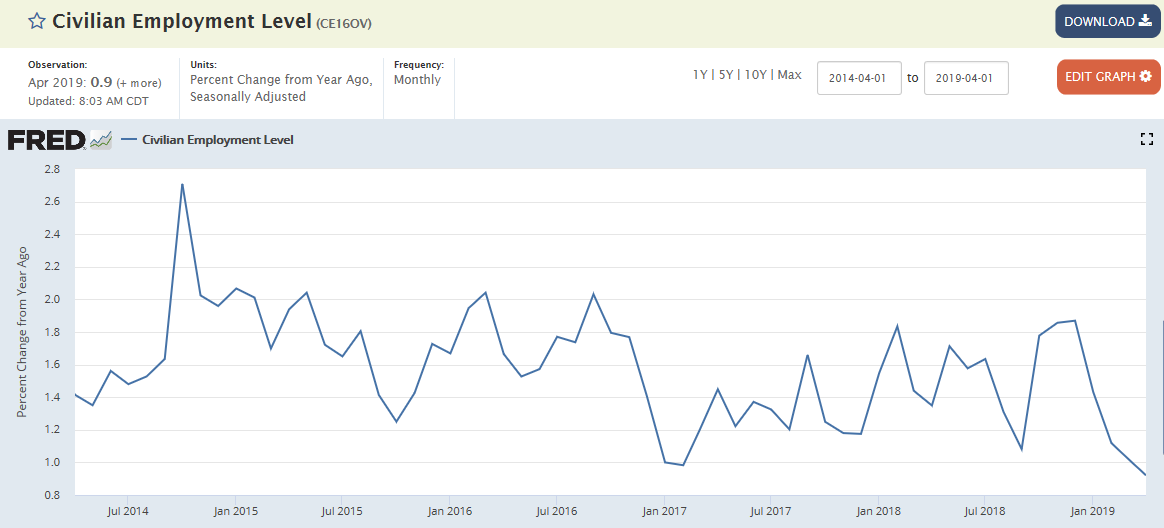
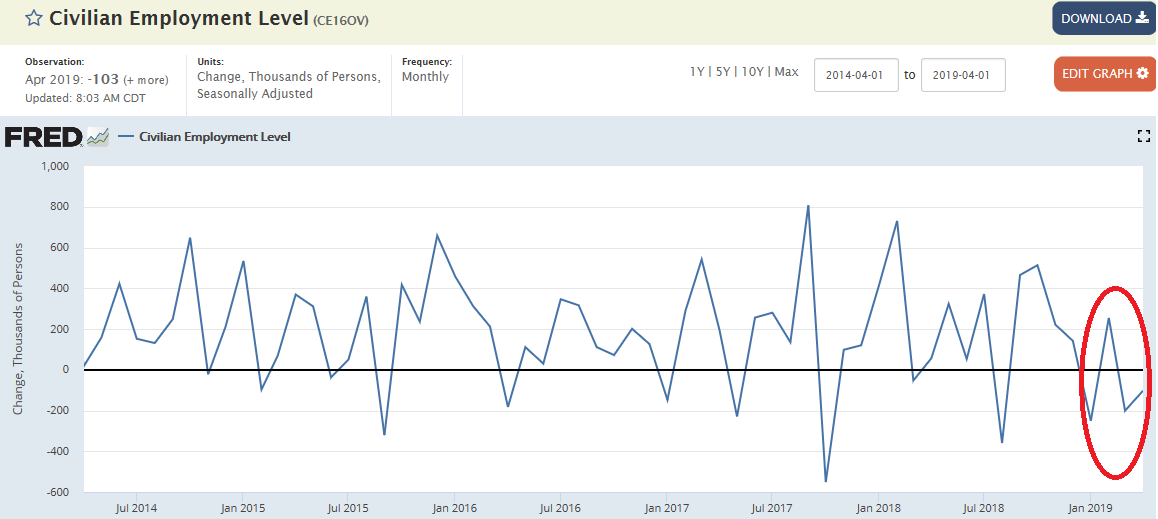
The household survey shows employment is down for the year:


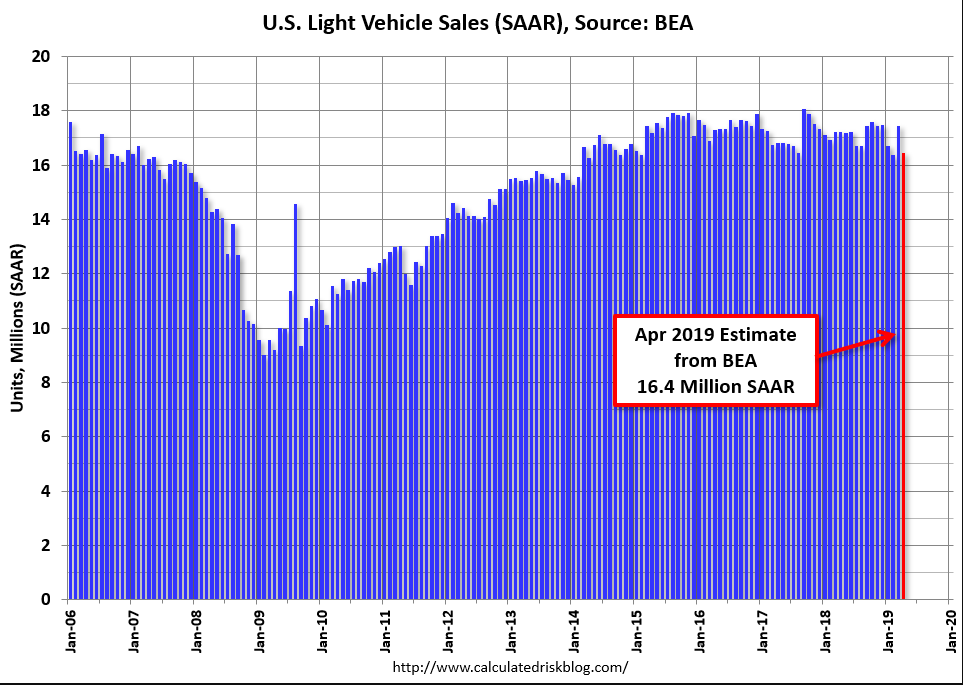
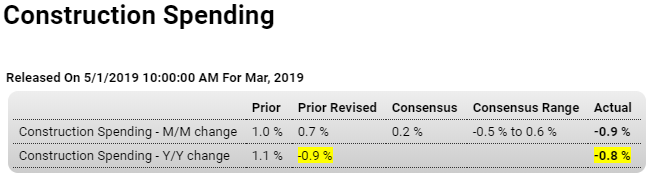
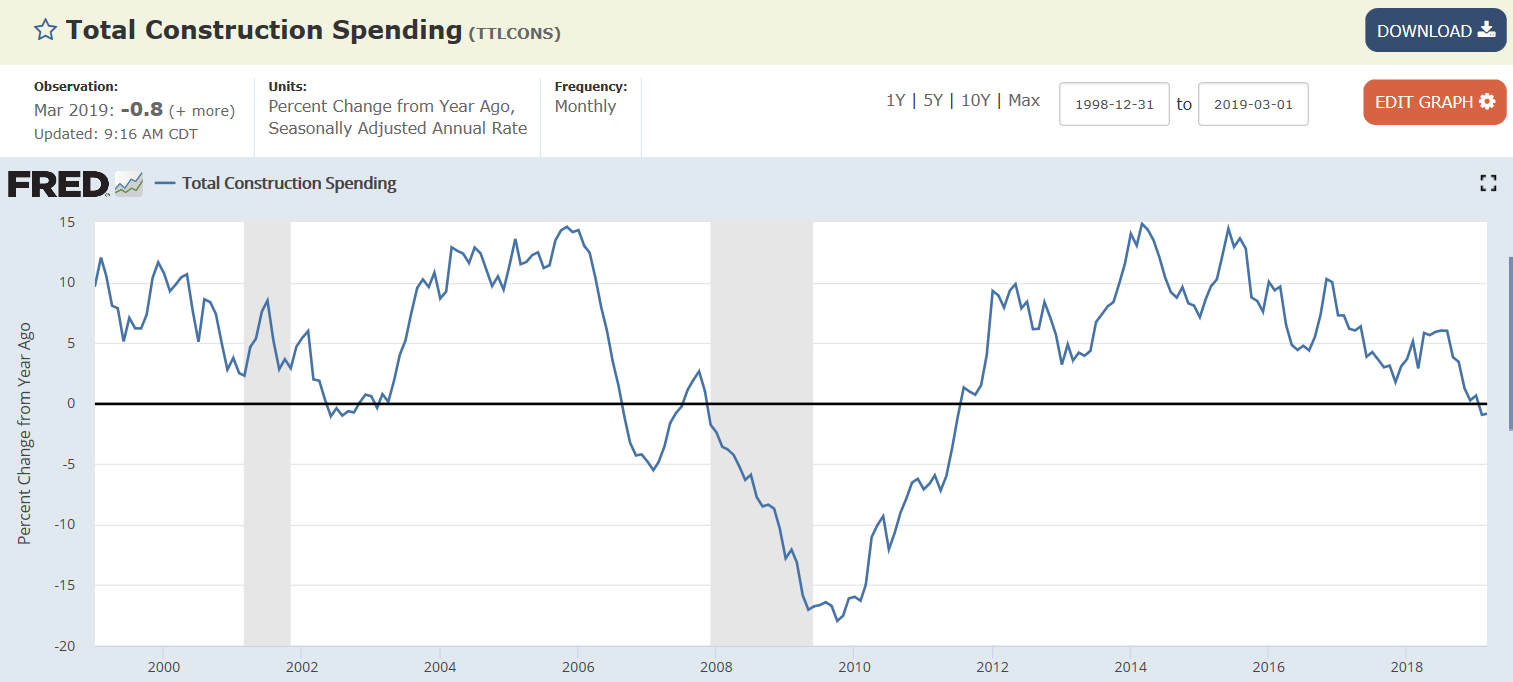
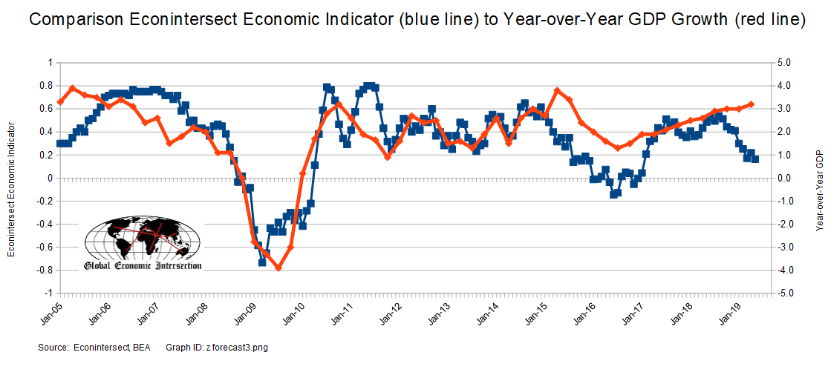
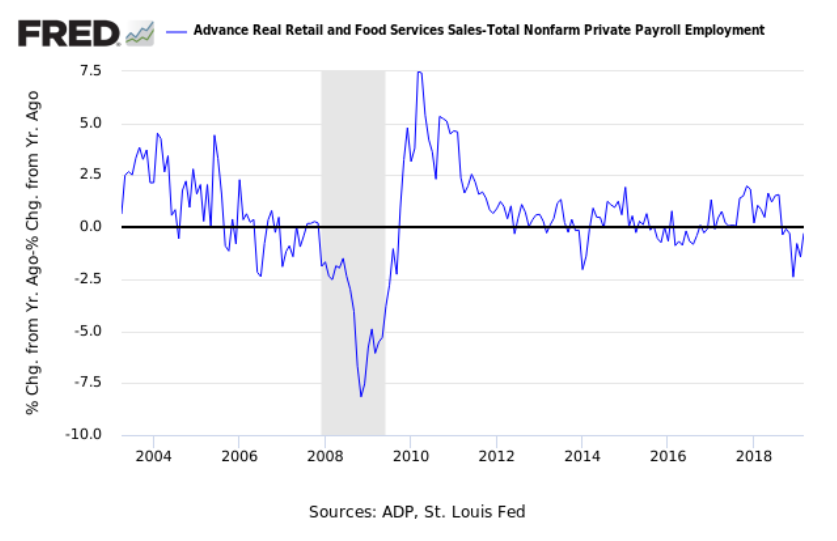
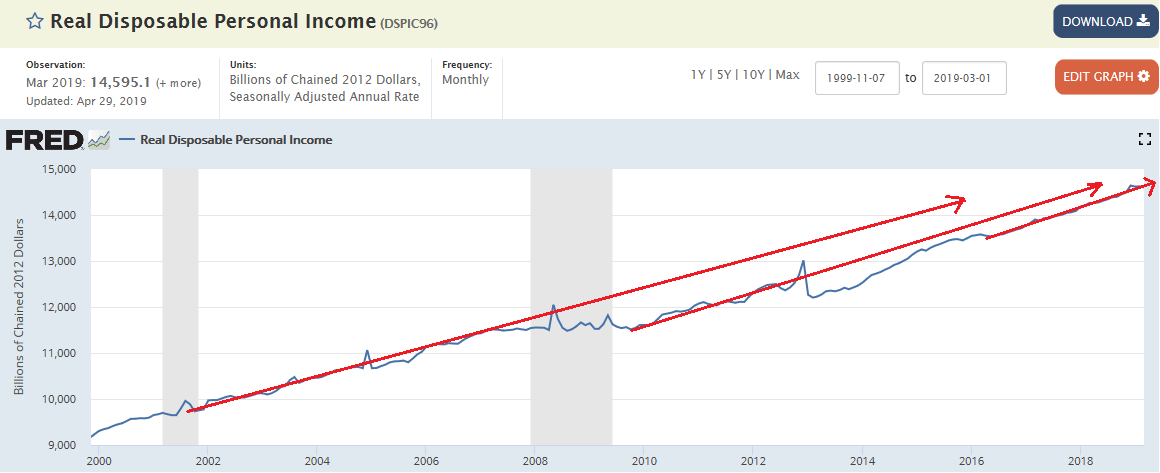
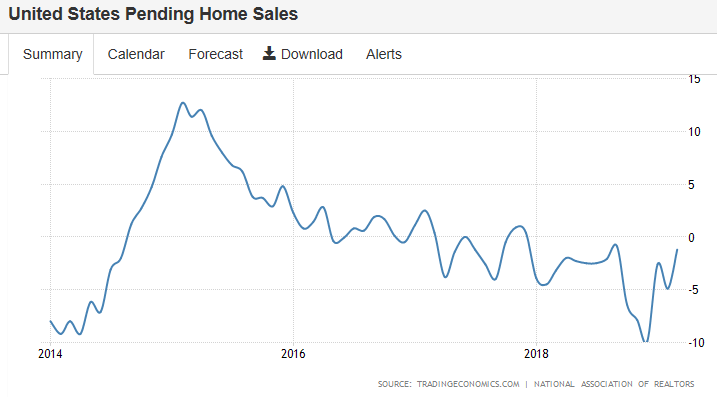
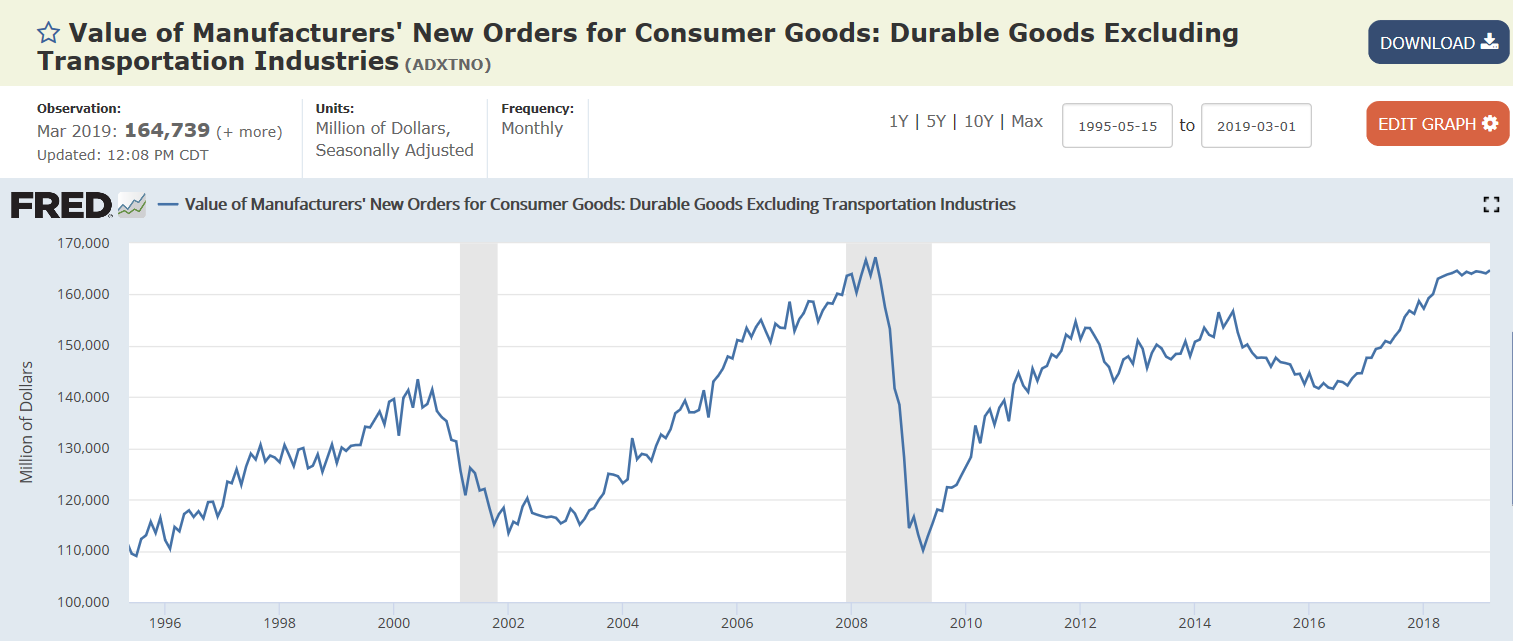
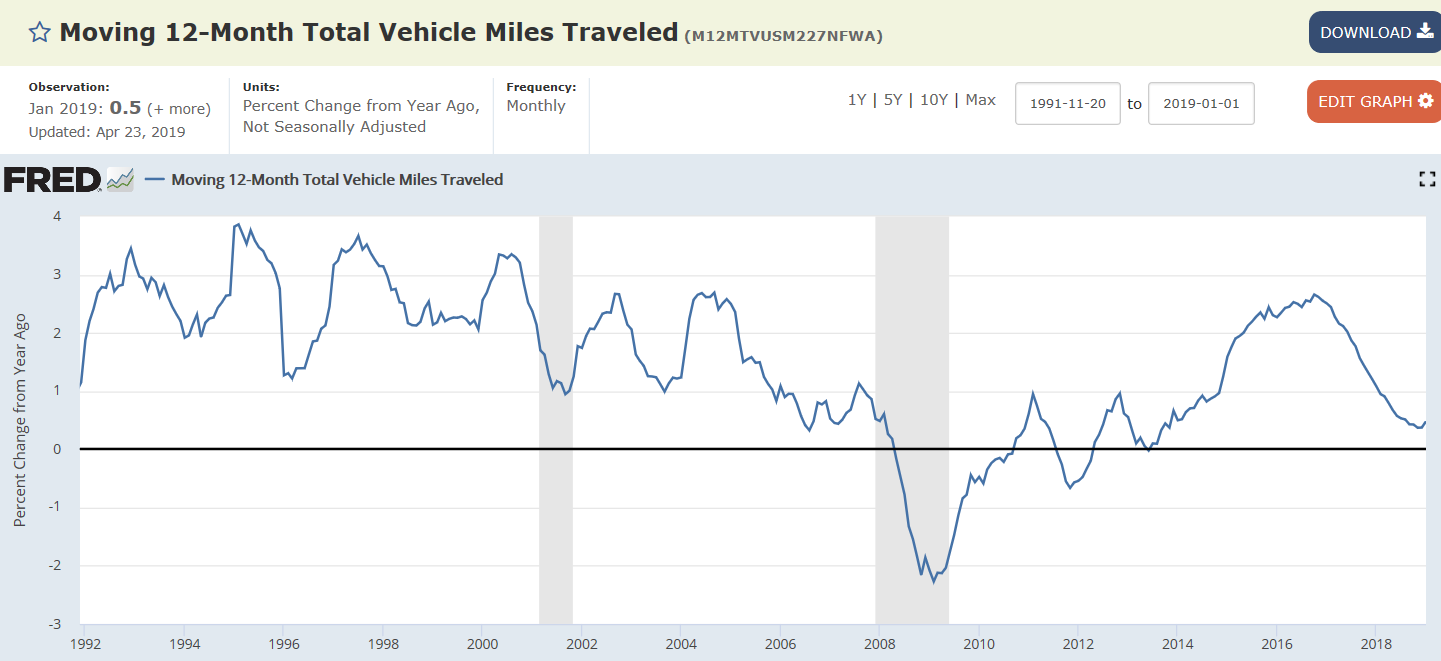
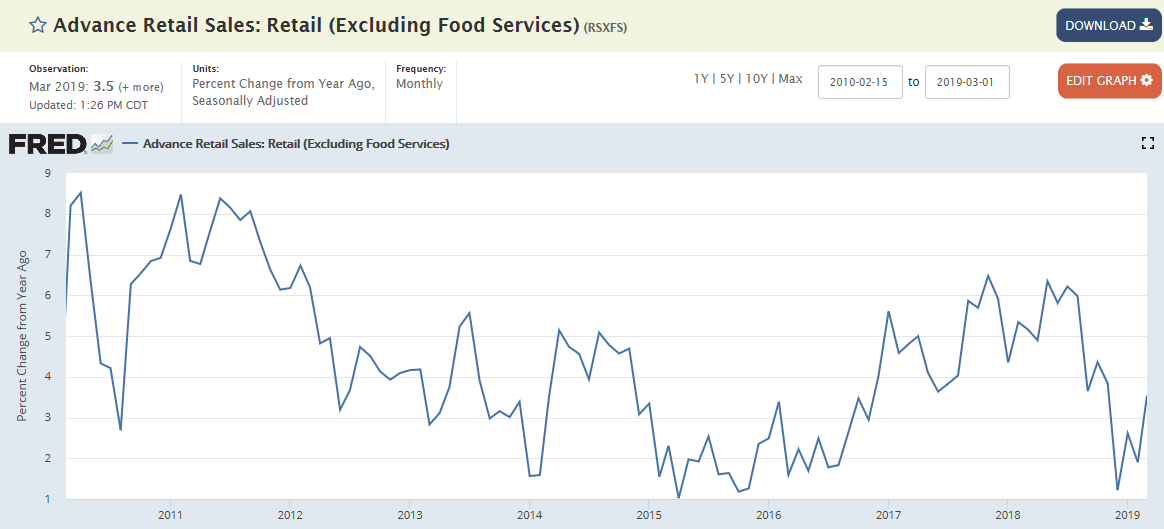
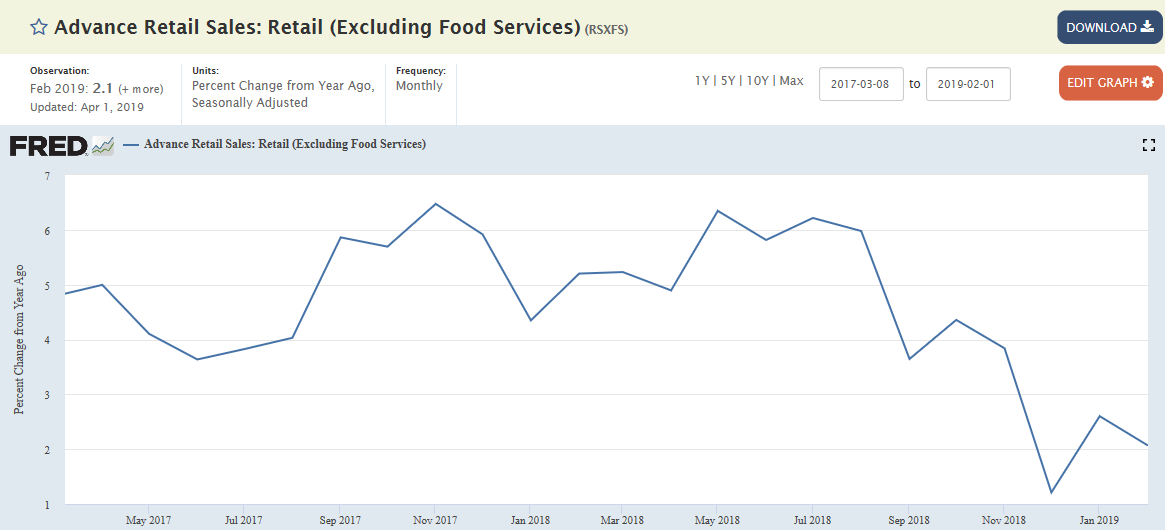
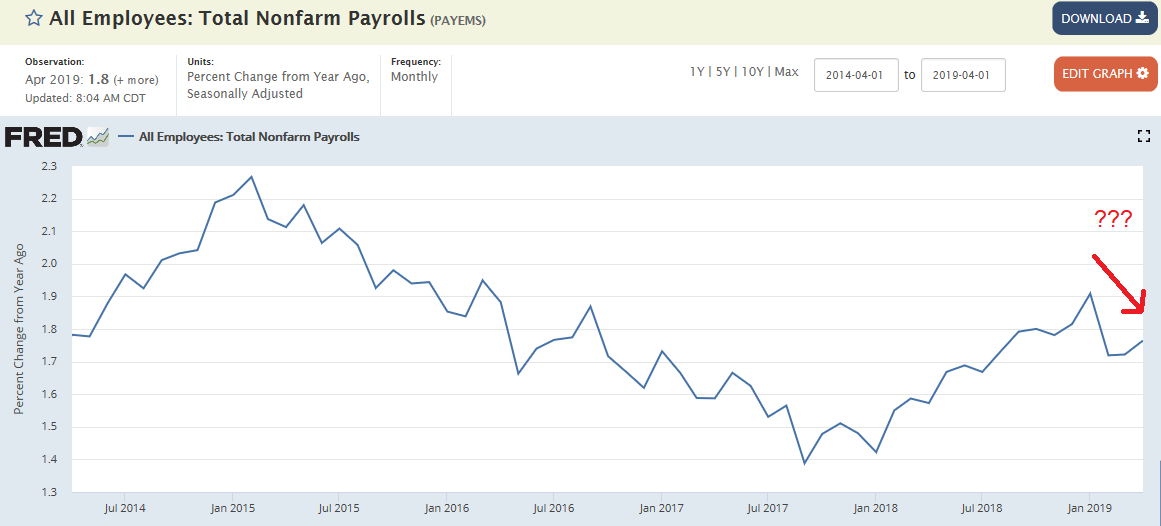
Up nicely for the month, but year over year growth still heading south, as per the chart:
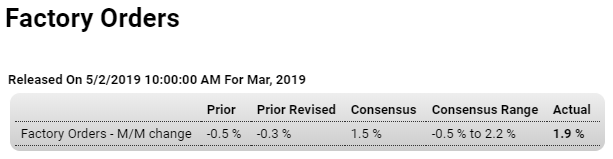
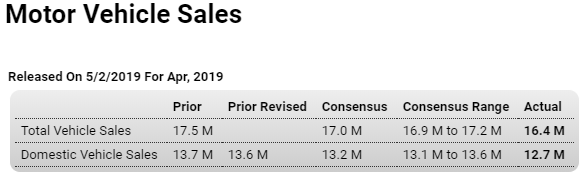
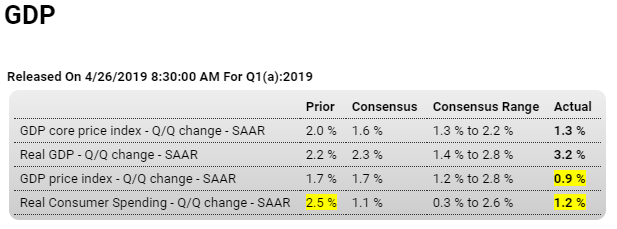
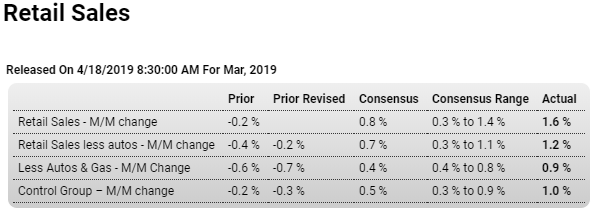
Highlights

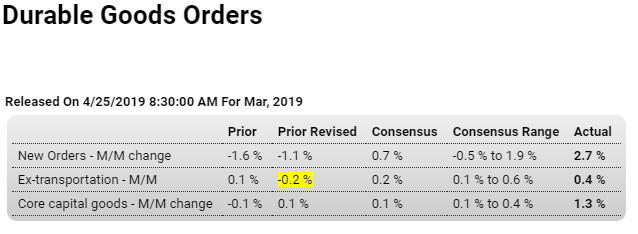
Factory orders rose 1.9 percent in a March report that is widely mixed yet fundamentally favorable. The least favorable reading in the report is a modest 0.3 percent rise when excluding transportation durables where however gains for aircraft, especially during the 737 Max grounding, are very welcome as was a strong gain in car and truck orders. The best news in the report is a 1.4 percent surge in orders of core capital goods (nondefense ex-aircraft) that hints strongly at second-quarter acceleration for business investment.

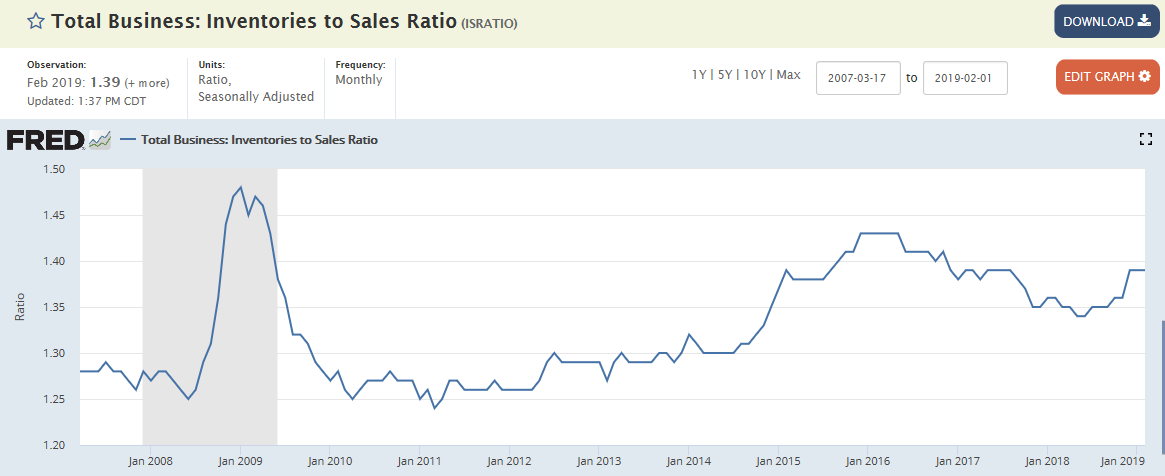
Inventories rose 0.4 percent in the month and though shipments jumped 0.7 percent, the inventory-to-sale ratio held unchanged at 1.36. Unfilled orders rose 0.2 percent and though a modest rate, is nevertheless welcome given what has been a long flat trend for this reading.

The strength of this report was signaled last week by advance data on the durables side of the manufacturing sector, where March orders growth is revised down 1 tenth to a nevertheless very sharp 2.6 percent gain. Nondurables are the fresh information in the report and they rose a strong 1.1 percent in March in a gain tied in part to higher prices for petroleum and related products.

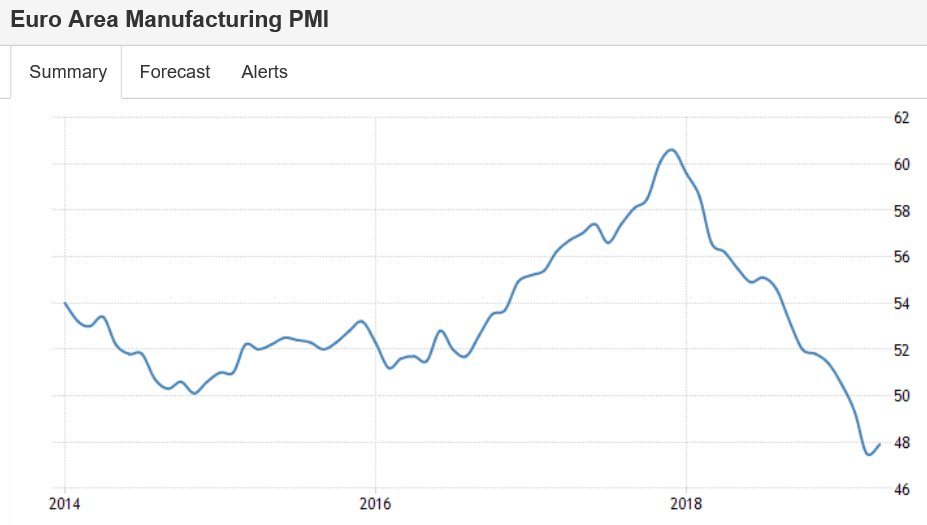
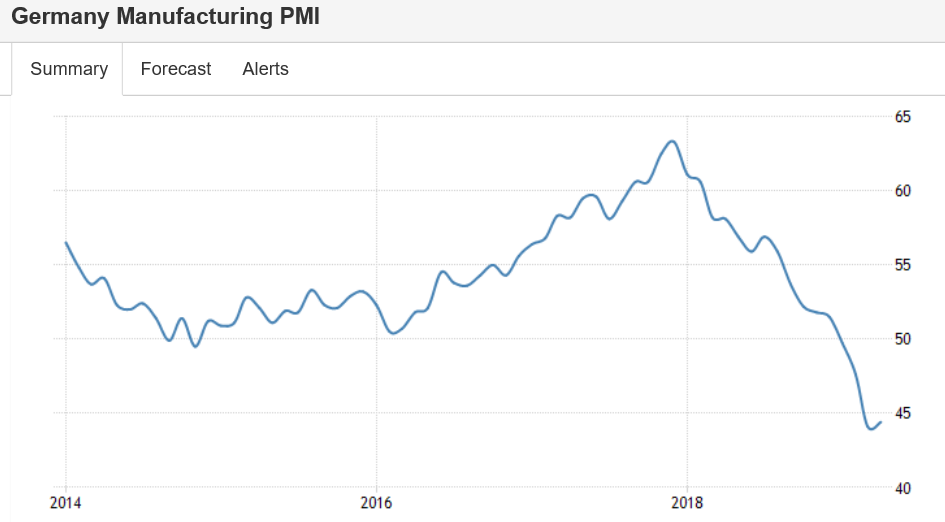
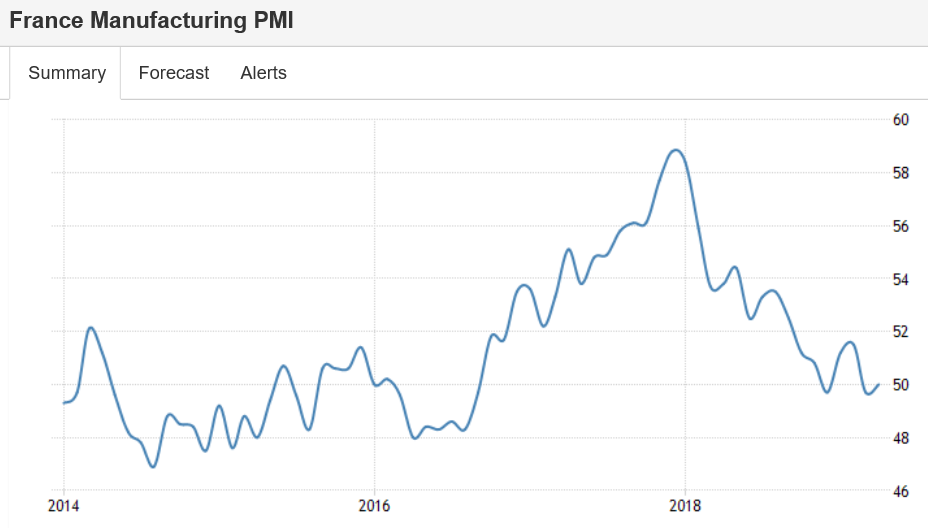
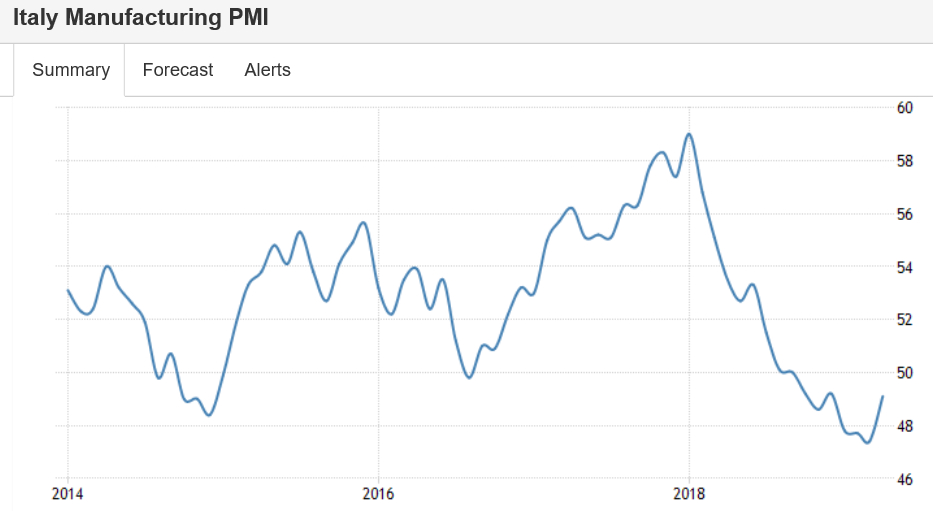
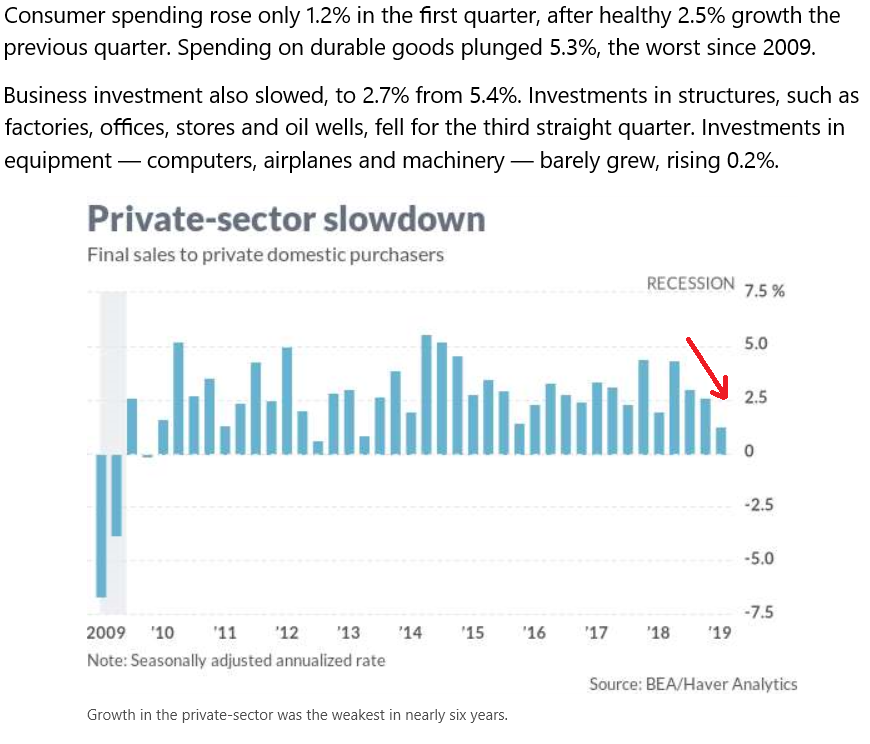
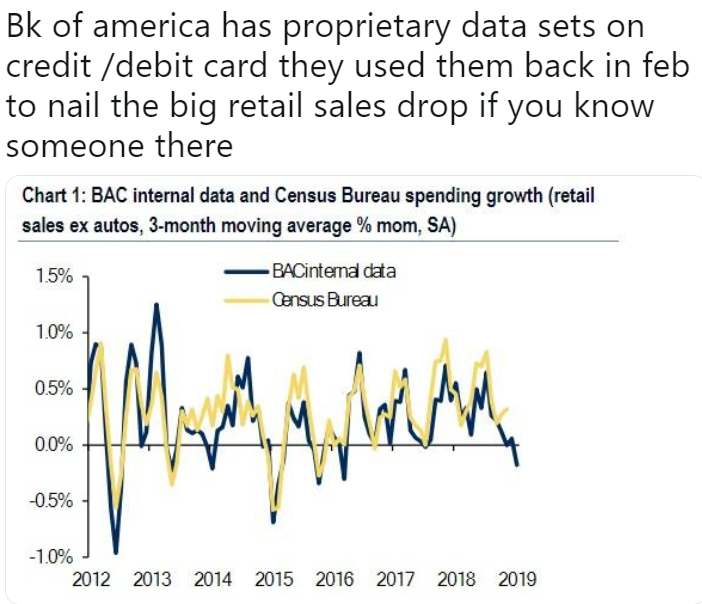
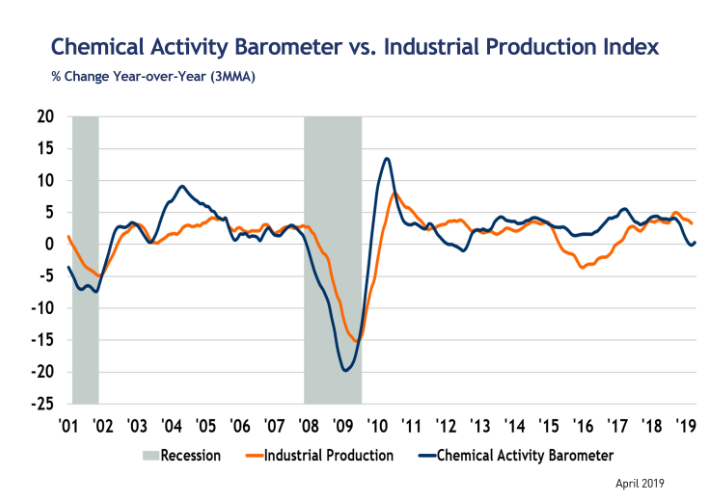
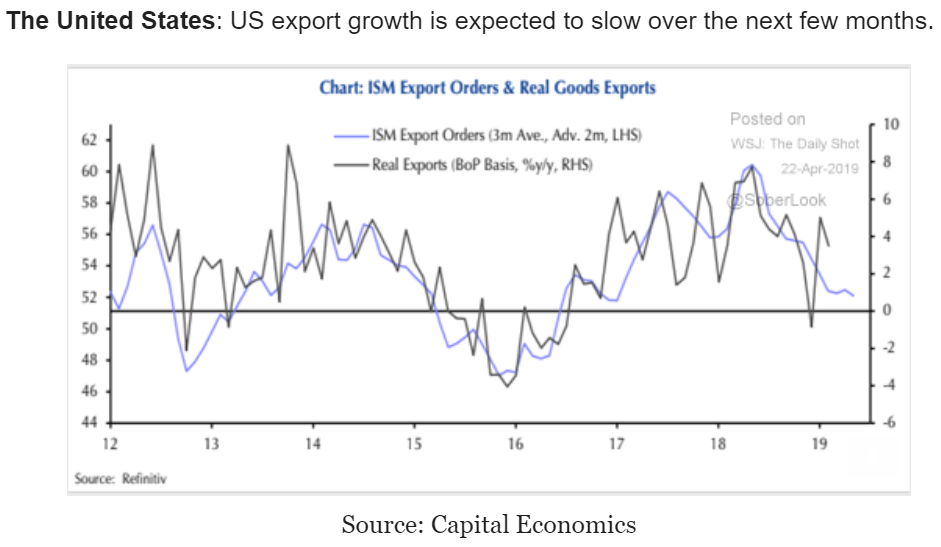
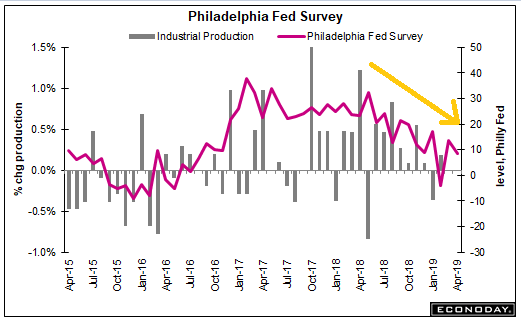
The President’s tariff war initiated to enhance manufacturing seems to instead be undermining it:

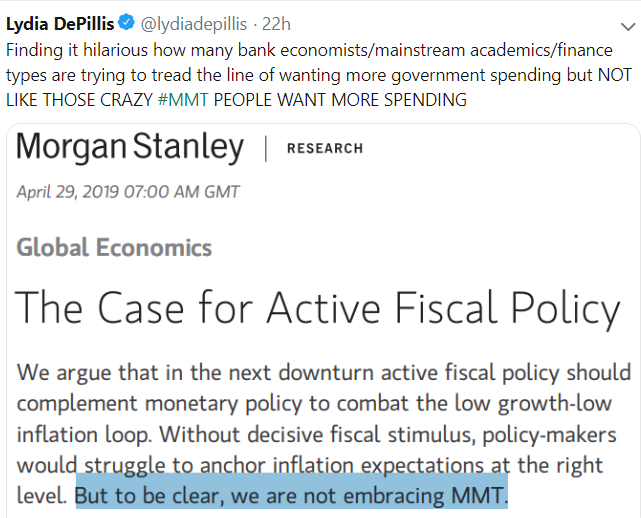
Here we go again. The exporters remain firmly in control, looking to depress domestic consumption and keep wages in check by fear mongering about the public debt has not abated:

Japan sales tax to rise as planned

(Nikkei) Japan will raise the 8% consumption tax to 10% as scheduled in October, barring a major financial crisis, a top official in the ruling party told Nikkei. “I haven’t heard anyone say that we could see something on the scale of the Lehman shock,” Katsunobu Kato, head of the Liberal Democratic Party’s General Council, said Wednesday. “It’s appropriate for us to proceed as planned.” Prime Minister Shinzo Abe decided to delay planned increases in 2014 and 2016. This time, he has said the government will go through with the increase, barring a disruption on par with the 2008 crisis.

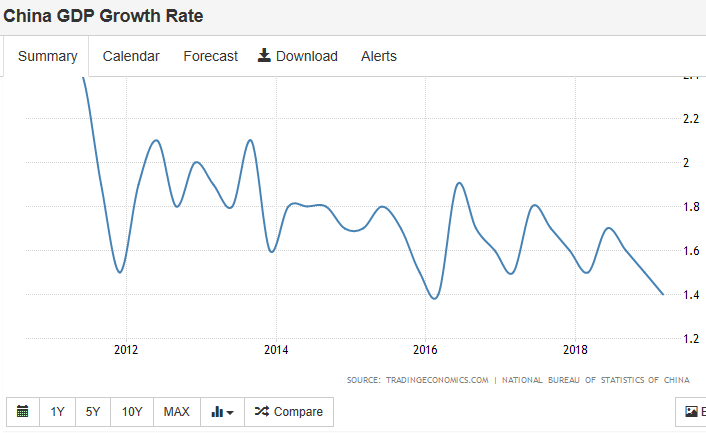
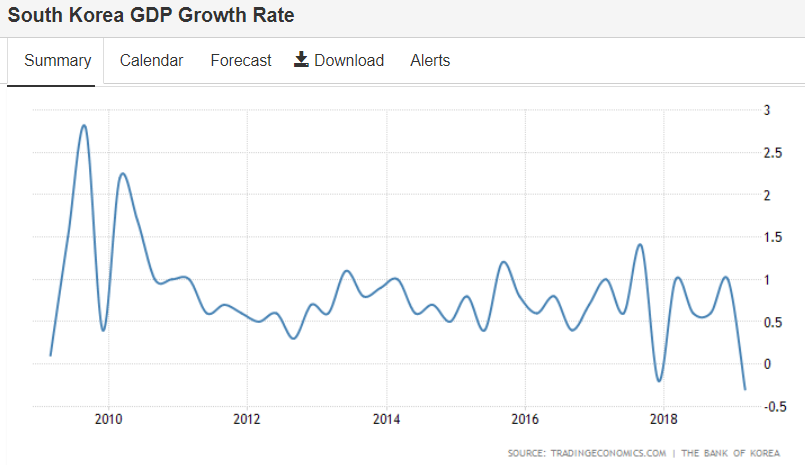
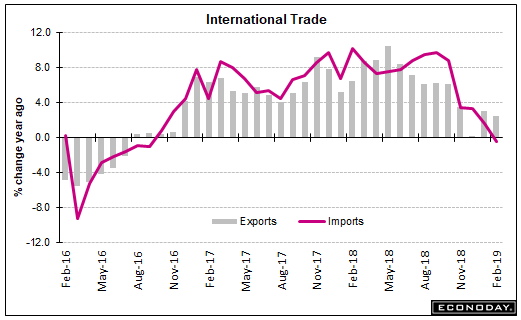
Global trade deceleration:

Hong Kong’s Q1 growth slips to slowest in a decade

(Nikkei) Hong Kong’s real gross domestic product rose 0.5% on the year in the January-March quarter. The economy expanded at the slowest rate since July-September 2009, and decelerated markedly from a 1.2% increase reported for the fourth quarter of 2018. Consumption edged up 0.1% on the year last quarter, compared with a 2.7% gain in October-December. Exports of goods fell 4.2%, while imports dropped 4.6%. Rapid growth in January-March 2018, which came to 4.6%, also left less room for improvement, according to the spokesperson.

How about this!!!

https://www.perdue.senate.gov/imo/media/doc/MMT%20Resolution.pdf

Car sales, Euro area PMI’s

Continues to decelerate:

Highlights

Jerome Powell may have cited March auto sales as an economic plus in yesterday’s FOMC press conference, but April sales couldn’t keep up the pace. Unit vehicle sales managed only a 16.4 million annual rate in April which was far below March’s 17.5 million rate and well below Econoday’s consensus range. The setback returns the sales pace to the disappointing mid-16 million range of January and February that was a ratcheting down from the fourth-quarter pace in the mid-17 million range.

Sales of domestic-made vehicles came in at a 12.7 million rate in April, also below the consensus range. Today’s results point to trouble for the motor vehicle component of the April retail sales report and, though unit sales data are a clouded mix of business and consumer sales, nevertheless hint strongly at an inauspicious second-quarter opening for consumer spending in general.


Deep in negative territory as trade wars continue:

Mtg purchase apps, Construction, SF home prices, ISM manufacturing, PMI chart, Trade agreement, Econ indicators

Dismal:

Highlights

The purchase index is down a sharp 4.0 percent for a second straight week, this time for the April 26 week. Year-on-year, the index is up only 1.0 percent which is not a favorable signal for the Spring housing push. Refinancing is also coming down, 11.0 percent lower for the fourth straight weekly decline after having spiked dramatically on a break lower in mortgage rates. And rates are still very low, down 4 basis points in the week for 30-year conventional loans to an average 4.42 percent.

March was a very strong month for the housing market, evidenced not only by prior data on the month’s new and existing home sales but also yesterday’s surprisingly strong jump in the month’s pending home sales index. Yet April, based at least on this report’s purchase index, looks to have slowed significantly.

Dismal:

Highlights

Construction spending came in much weaker than expected in March, down 0.9 percent on the month and well under Econoday’s consensus range. Weakness is centered in the most sensitive spot of all: single-family homes where spending fell 1.5 percent in what may point to a downward revision to what was already a weak residential component in the first-quarter GDP report.

Private nonresidential spending did better, rising a solid 0.5 percent led by gains for manufacturing and transportation which may lift the GDP revision for first-quarter business investment. Yet spending on commercial projects remains weak, down 2.6 percent in the month with this year-on-year rate well into contraction at minus 8.6 percent.

Public spending has been holding up this report but showed sharp give backs in March, down a monthly 1.5 percent for educational projects and down 1.9 percent for highways & streets. Federal spending fell 2.7 percent in the month with state & local down 1.1 percent, though year-on-year gains are still strong at 5.7 percent for Federal and 8.9 percent for state & local.

Overall construction was down 0.8 percent on the year in March in a measure that is not pointing to improvement yet for 2019. Housing sales did show solid signs of pick-up in February and March as mortgage rates came down, but today’s results for single-family spending aren’t promising much new supply for the new home market. And in an unfavorable indication on discretionary spending and demand for building materials, spending on home improvements fell 3.1 percent in the month with this yearly rate deep in contraction at minus 14.1 percent.

San Francisco Bay Area home prices fall for the first time in 7 years

The global deceleration from the trade war includes the US:

Highlights

In the weakest report in nearly two years, the April ISM manufacturing index came in far below expectations at 52.8 for a 2.5 point decline from March. New orders, at 51.7, are down 5.7 points in April with related export orders down 2.2 points and in technical contraction at 49.5. Employment fell 5.3 points to 52.4 in what is an unfavorable indication for Friday’s factory payroll data where a solid gain was expected. The significant slowing in demand is reflected in the prices paid index which fell 4.3 points to 50.0 even to indicate no change from the prior month.

But there are pluses in the report including a 3.5 point rise in total backlog orders to 53.9 which is solid for this reading and which will help the sample keep up their production despite the slowing in new orders. Of the 18 industries tracked in the report, 13 reported monthly growth in composite activity with five, which is a large number for the breakdown, reporting contraction led by apparel makers and also including primary metals and, in an unfavorable indication for April durable goods orders, transportation equipment as well.

This report is focused on strongly by not only forecasters and policy makers but also by the financial markets. Though one month is only one month, the results are likely to raise talk that the performance of the nation’s factory sector, which has been uneven since late last year, may begin holding back the 2019 economy.


The red line, as above, is down further in April:

Some were saying this was what the US was trying to achieve and was willing to drop most of the rest to get it:

Trump drops cyber theft demands in bid for swift trade deal with China

(FT) President Trump has dropped a central demand from trade negotiations with China that it halt alleged instances of commercial cyber theft, in order to end a long-running tariff dispute. The US is instead likely to accept a watered-down commitment from Beijing as an alternative.

Tariffs That Started the U.S.-China Trade Conflict Now Dog Its Finish

(WSJ) As U.S. and Chinese officials try to close a trade deal, the punitive tariffs the governments slapped on each country’s goods in the conflict stand as a major obstacle, according to officials and others briefed on the talks.

GDP detail, Business optimism, Personal Income, Chicago PMI, US pending home sales, China news


Personal income not doing so well, as growth keeps ratcheting down:

China April factory growth unexpectedly slows as economy struggles for traction

(Reuters) The official Purchasing Managers’ Index (PMI) for manufacturing fell to 50.1 in April from March’s reading of 50.5, which was the first expansion in four months, data from the statistics bureau showed. Output expanded at a slower but still moderate pace, while growth in new orders eased only slightly. The official index for export orders continued to contract, but hit its highest level in eight months. The official PMI survey showed small and mid-sized manufacturers continued to fare worse than larger companies. But small manufacturers’ activity improved to a six-month high.

Chinese freight volumes hit as business softens

(FT) The headline FTCR China Freight Index, a composite reading of the results of a monthly survey of 200 logistics companies, fell to a nine-month low of 48.8 in April. April’s reading indicates that freight activity is shrinking, if at a relatively slow rate. Just 16.6 per cent of respondents said their volumes increased on the previous month compared with 26.8 per cent in March. Year-on-year readings were even weaker, with almost a third of companies reporting that volumes were down, while our index comparing rates this month with April 2018 pointed to a marginal drop.

Quarterly Growth:

GDP, Retail sales, Oil prices

Headline number looks strong, but details show weakness, particularly personal consumption expenditures which continue to decelerate:

Highlights

The consumer isn’t on fire but still contributed to a very solid 3.2 percent growth rate for first-quarter GDP. Net exports are the driving force of the headline rate, still deeply negative at minus $899.3 billion but nevertheless contributing 1.03 percentage points to the quarter’s calculation though trade data for March, which have yet to be released, were imputed. Inventories rose sharply and added 0.65 points but whether the build was desired may be in question, that is given what was less than robust strength in consumer demand.

Consumer spending (personal consumption expenditures) rose at a modest-to-moderate and largely as expected 1.2 percent pace but nevertheless contributed 0.82 points to the quarter though spending on durables, a discretionary component, fell very steeply and pulled the quarter 0.38 points lower. But spending on nondurables and especially services was strong, contributing 0.24 and 0.96 points respectively. Not strong at all was residential investment which contracted at a 2.8 percent annual pace — the fifth straight quarterly contraction — and subtracted 0.11 points from the quarter.

In contrast once again was business investment which rose at a very favorable 2.7 percent pace and added to the quarter 0.38 points. Government purchases were also very strong, at a 2.4 percent growth rate for a 0.41 point contribution.

A clearer look on underlying domestic demand comes from final sales to domestic purchases, a reading that excludes both net exports and inventories and where the growth rate was only 1.4 percent. Lack of consumer punch is a bit of a puzzle at least based on the strength of the labor market. Price readings in today’s report are very subdued at 0.9 percent for the overall index and only 1.3 percent for the core. The pace of the nation’s economy isn’t as strong today’s headline suggests with questions over the consumer, first raised by the 1.6 percent plunge in December retail sales, still persisting.

Trump says he called OPEC and told producer group to bring fuel prices down

Durable goods, Chem activity, South Korea

As per the chart still not looking so good:

Highlights

Good news on US manufacturing is now much less scarce following a much better-than-expected 2.7 percent jump in durable goods orders for March. The gain is skewed higher by a very welcome 60 percent monthly gain in commercial aircraft orders and also by an equally welcome 2.1 percent rise in motor vehicle orders. Excluding these orders as well as orders for all other transportation equipment, March orders rose a respectable 0.4 percent.

Now the really good news! Orders for core capital goods (nondefense ex-aircraft) surged 1.3 percent to easily exceed expectations. This reading had been flat until today’s data for March which now point to a sizable pickup in business investment. Yet the pickup as tracked in GDP will have to wait for the second quarter as shipments of core capital goods actually slipped 0.2 percent in the month. The dip in shipments, however, provided a lift for unfilled orders of core capital goods which rose 0.2 percent to end an unwanted run of declines.

Total shipments rose 0.3 percent for a second straight month and are right in line with total inventories which also rose 0.3 percent. Together they keep the inventory-to-shipments ratio unchanged at a constructive and lean 1.62.

Today’s report won’t be raising expectations for business investment in tomorrow’s first-quarter GDP report but will be raising general expectations for manufacturing which, until this report, had been stumbling along. And strength in commercial aircraft, which also includes a 0.2 percent rise in related unfilled orders, should cool worries over 737 Max cancellations. Still, cross-border trade has been depressed and remains a key obstacle that looks to contain this year’s manufacturing growth.

This has gone flat:

Export growth, Miles driven, Ship orders

Ship Orders Fall to Lowest Level in 15 Years

Ship orders world-wide have shrunk to the lowest level in 15 years as vessel owners struggle with excess capacity that has kept freight rates well below break-even levels.

There were 3,200 vessels of a combined 81 million gross tons ordered globally in the first quarter, the lowest figure since 2004, marine data provider Clarksons PLC said in a report released Friday.

Headline export and import news still negative:

Taiwan Export Orders Fall for 5th Straight Month

Thai Imports Fall Sharply in March

Thai Exports Drop More than Expected

Housing starts, Unemployment claims, China

Still heading south:

In addition to tightening requirements, states have found other means to keep people from receiving benefits:

Has the economy made it arder to get unemployment benefits?

Not every terminated employee is eligible to receive unemployment benefits. You have to earn a minimum amount to even qualify; you cannot quit or be fired for cause, as defined by Illinois law; and you must actively search for alternative employment. With these requirements in mind, the Illinois Department of Employment Insurance (IDES) has, in the past, generally appeared to lean in favor of the employee when determining eligibility.

However, through working with both executives and small business owners, my office has been seeing a shift. I am not sure if state budget pressures are pushing this change, but IDES employees have been seemingly going out of their way to contact small business owners and encourage them to contest unemployment claims.

Euro area PMI, Architecture billings index, Philly Fed, Retail sales, Inventories, Fed report, Equity prices and earnings forecasts

Not looking good:

German Factory Activity Continues to Contract in April

The IHS Markit Germany Manufacturing PMI rose to 44.5 in April 2019 from the previous month’s near seven-year low of 44.1, but below market expectations of 45, a preliminary estimate showed. Still, the latest reading pointed to a sharp contraction in the manufacturing sector, as inflows of new business fell for a fourth straight month led by a further steep decline in new export orders, which dropped at the second-fastest rate in the past ten years. Firms highlighted weak demand across the automotive sector in particular, whilst also suggesting some hesitancy among UK based clients. In addition, work-in-hand at manufacturers declined the most for almost a decade while employment levels were unchanged. Looking ahead, business confidence towards the year-ahead outlook was the weakest since November 2012.

French Factory Activity Contracts the Most in 2-1/2 Years

The IHS Markit France Manufacturing PMI edged down to 49.6 in April 2019 from 49.7 in the previous month, missing market expectations of 50, a preliminary estimate showed. The latest reading pointed to the steepest contraction in the manufacturing sector since August 2016, as output fell the most in four years. On the other hand, new orders and export sales both declined at a softer pace while employment growth accelerated.

Back in negative territory:

In contrast, this is an upbeat report (subject to revision) for March, though the chart doesn’t look so good:

Highlights

The optimists weren’t quite optimistic enough as March retail sales, across all major readings, came in just above Econoday’s high estimates. Still, the trend is uneven and not pointing with certainty to acceleration ahead for consumer spending.

Total retail sales jumped 1.6 percent in March which exactly matches the decline in the much more important month of December. February sales are unrevised at the headline level at minus 0.2 percent with January sales revised 1 tenth higher to a gain of 0.8 percent.

Ex-auto sales show a bit less strength over this period, rising 1.2 percent in March but falling 2.1 percent in December with February revised to a 0.2 percent decline and January holding at an increase of 1.4 percent. Other core readings are similar, showing strength in March following bumpy results previously with ex-autos ex-gas rising 0.9 percent in the latest month and control group sales, which are inputs into GPD, up a helpful 1.0 percent.

Vehicle sales stand out sharply in March, up 3.3 percent following declines in the two prior months. Sales at gasoline stations also stand out, up 3.5 percent for a second straight month but boosted by price effects for fuel.

Convincing strength is evident once again for non-store retailers which, after falling 4.5 percent in December, have posted three straight strong gains including 1.2 percent in both March and February. Restaurants are also convincing, up 0.8 percent in the latest month for a third straight gain in what speaks directly to discretionary strength. Furniture & home furnishing stores are also doing well with three straight gains including a 1.7 percent March jump.

Lagging are department stores, unchanged following three straight declines which may reflect a shift underway in consumer habits away from traditional malls than weakness in consumer demand. General merchandise, which is the broader category that includes department stores, rose 0.7 percent in March but failed to make up for recent weakness.

Yet this report is not about weakness but about strength, and the results are certain, like yesterday’s trade data for February, to give a lift to first-quarter GDP estimates. The economy’s soft patch so far this year isn’t as soft as it once looked, but questions remain.

Elevated inventories are not a good sign:

U.S. labor market remains tight, economy continues to grow

(Reuters) The U.S. central bank’s “Beige Book” report found economic activity grew at a slight-to-moderate pace in March and early April. Prices have risen modestly since the last Beige Book, with tariffs, freight costs and rising wages often cited as key factors, the Fed said. It added that consumer spending was mixed but suggested sluggish sales for both general retailers and auto dealers. Wages grew moderately in most districts for both skilled and unskilled workers. In terms of the manufacturing sector, the Fed said contacts in many districts reported that trade-related uncertainty was weighing on activity.

Trade, Housing affordability, China, BOJ equity buying, Retail comment

Imports and exports both decelerating indicates a weaker global economy, and weak US retail sales indicates domestic consumer spending growth is slowing:

Highlights

First-quarter GDP looks to get a major boost from improvement in the nation’s trade deficit which, for February, came in at much lower-than-expected $49.4 billion. And the positives are more than just a technical calculation as exports, driven by aircraft, jumped 1.1 percent in the month on top of January’s 1.0 percent gain.

Exports of goods rose 1.5 percent to $139.5 billion as civilian aircraft rose $2.2 billion in the month. Outside of aircraft, however, gains are less striking with auto exports up $0.6 billion and with monetary gold and consumer goods showing marginal gains. For farmers, the results are slightly in the negative column with exports down $0.2 billion. But exports of services, at $70.1 billion in the month and usually a reliable plus, rose 0.3 percent.

Imports rose only 0.2 percent in the month, totaling $259.1 billion but with consumer goods showing yet another large increase of $1.6 billion in the month. Imports of industrial supplies fell $1.2 billion despite a 0.8 billion rise in the oil subcomponent. Imports for other categories were little changed.

Bilateral country deficits show a sharp decline with China, down $24.8 billion in unadjusted monthly data that are hard to gauge given strong calendar effects during the lunar new year. But year-to-date, the deficit with China is at $59.2 billion and down sizably from $65.2 billion in the comparison with the 2018 period. February’s deficit with both the European Union and Canada narrowed while deficits with Japan and especially Mexico, at $7.4 billion vs January’s $5.8 billion, deepened.

Today’s results are certain to lift first-quarter GDP estimates which had been roughly at the 2 percent line. The average deficit for the first two months of the quarter is $50.3 billion which is well under the $55.6 billion monthly average in the fourth quarter. And the easing deficit with China may well ease immediate tensions in U.S.-Chinese trade talks.


Interesting as debt service and financial burdens ratios remain historically low:


They’ve made fiscal adjustments that may be kicking in:

Bank of Japan to be top shareholder of Japan stocks

Bank of Japan to be top shareholder of Japan stocks (Nikkei) The BOJ held over 28 trillion yen ($250 billion) in exchange-traded funds as of the end of March — 4.7% of the total market capitalization of the first section of the Tokyo Stock Exchange. Assuming that the bank maintains its current target of 6 trillion yen in new purchases a year, its holdings would expand to about 40 trillion yen by the end of November 2020. This would place it above the GPIF’s TSE first-section holdings of more than 6%. The BOJ has likely also become the top shareholder in 23 companies through its ETF holdings. It was among the top 10 for 49.7% of all Tokyo-listed enterprises at the end of March.

This could explain why same store sales have been growing by about 5% year over year:

CNN: American retailers already announced 6,000 store closures this year. That’s more than all of last year.