ABC Consumer Confidence (Mar 2)
| Survey | n/a |
| Actual | -34 |
| Prior | -37 |
| Revised | n/a |
Stabilizing at very low levels.

| Survey | n/a |
| Actual | -34 |
| Prior | -37 |
| Revised | n/a |
Stabilizing at very low levels.
| Survey | n/a |
| Actual | -7.24% |
| Prior | -4.17% |
| Revised | n/a |
| Survey | n/a |
| Actual | 245.70 |
| Prior | 254.29 |
| Revised | n/a |
Both were falling into year end.
| Survey | 48.0 |
| Actual | 48.3 |
| Prior | 50.7 |
| Revised | n/a |
Better than expected. Not yet to recession levels.
| Survey | 73.5 |
| Actual | 75.5 |
| Prior | 76.0 |
| Revised | n/a |
Price pressures persisting.
| Survey | -0.7% |
| Actual | -1.7% |
| Prior | -1.1% |
| Revised | -1.3% |
Very weak.
| Survey | 15.5M |
| Actual | 15.4M |
| Prior | 15.2M |
| Revised | n/a |
As expected, but drifting to a lower range.
| Survey | 11.9M |
| Actual | 11.7M |
| Prior | 11.7M |
| Revised | n/a |
Drifting lower.
Same twin themes: weak demand and higher prices.Exports keeping GDP from recession levels, but taking demand from the rest of the world that is also softening.
| Survey | n/a |
| Actual | 4.9 |
| Prior | 5.6 |
| Revised | n/a |
Falling off some. Interest rates are partially responsible, as last I checked households are still net savers and have net interest income.
This is one reason I lean towards the view that lower interest rates tend to slow nominal growth, while higher interest rates support nominal growth.
| Survey | n/a |
| Actual | 5.5% |
| Prior | 5.8% |
| Revised | n/a |
Nominal spending holding up. With our ‘new’ export economy, real spending gives way to exports, and GDP muddles through.
| Survey | n/a |
| Actual | 1.8% |
| Prior | 2.1% |
| Revised | n/a |
| Survey | n/a |
| Actual | 3.7% |
| Prior | 3.6% |
| Revised | n/a |
This is problematic for the Fed.
| Survey | n/a |
| Actual | 2.2% |
| Prior | 2.2% |
| Revised | n/a |
This is not easy for the Fed to watch, as they worked long and hard to bring it below 2% and back to their comfort zone of 1-2%. Now the concern is how hard it will be to bring down from even higher expected levels if they keep cutting rates.
| Survey | n/a |
| Actual | 3.7% |
| Prior | 3.6% |
| Revised | n/a |
As above, this is way too high for comfort.
| Survey | n/a |
| Actual | 1.9% |
| Prior | 2.0% |
| Revised | n/a |
Also as above. Ok, but threatening to move higher and be very costly to bring back down.
| Survey | 2.2% |
| Actual | 2.2% |
| Prior | 2.2% |
| Revised | n/a |
As above.
| Survey | 49.5 |
| Actual | 44.5 |
| Prior | 51.5 |
| Revised | n/a |
Definitely not good, but like ISM, a survey that gets subjective responses, and price components remain high.
New orders up as well.
| Survey | 70.0 |
| Actual | 70.8 |
| Prior | 69.6 |
| Revised | n/a |
While better than expected, does not look good.
And one year inflation expectations are up to 3.6%.
| Survey | n/a |
| Actual | 53.0 |
| Prior | 58.0 |
| Revised | n/a |
Below expectations, but positive. Probably won’t get reported anywhere else..
| Survey | n/a |
| Actual | 358.2 |
| Prior | 357.6 |
| Revised | n/a |
While still winter numbers, this is nonetheless looking very weak.
No way to tell if it’s more than loss of market share to banks, but other winter housing numbers are also weak.
| Survey | n/a |
| Actual | 2458.9 |
| Prior | 3533.8 |
| Revised | n/a |
Weak.
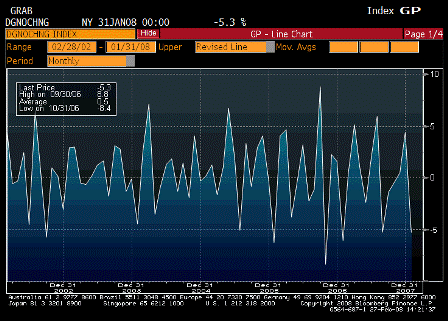
| Survey | -4/0% |
| Actual | -5.3% |
| Prior | 5.2% |
| Revised | 4.4% |
Weak.

| Survey | n/a |
| Actual | 3.0% |
| Prior | 4.2% |
| Revised | n/a |
Weak.
| Survey | -1.4% |
| Actual | -1.6% |
| Prior | 2.6% |
| Revised | 2.0% |
Weak.
| Survey | 600K |
| Actual | 588K |
| Prior | 604K |
| Revised | 605K |
Weak.
| Survey | -0.7% |
| Actual | -2.8% |
| Prior | -4.7% |
| Revised | -4.0% |
Weak.
 Gives less reason to think January payrolls will be reversed very much higher.
| Survey | 0.4% |
| Actual | 1.0% |
| Prior | -0.1% |
| Revised | -0.3% |
| Survey | 0.2% |
| Actual | 0.4% |
| Prior | 0.2% |
| Revised | n/a |
| Survey | 7.3% |
| Actual | 7.4% |
| Prior | 6.3% |
| Revised | n/a |
| Survey | 2.2% |
| Actual | 2.3% |
| Prior | 2.0% |
| Revised | n/a |
To high for the Fed and looking higher. Kohn speaking next today.
In the early 70’s inflation kept going up, even after crude flattened out for several years after a fivefold+ jump,
| Survey | n/a |
| Actual | 184.9 |
| Prior | 188.8 |
| Revised | 188.9 |
| Survey | -9.7% |
| Actual | -9.1% |
| Prior | -7.7% |
| Revised | n/a |
| Survey | n/a |
| Actual | 170.6 |
| Prior | 180.5 |
| Revised | 180.3 |
| Survey | n/a |
| Actual | -8.9% |
| Prior | -4.5% |
| Revised | -4.6% |
| Survey | 82.0 |
| Actual | 75.0 |
| Prior | 87.9 |
| Revised | 87.3 |
| Survey | -12 |
| Actual | -5 |
| Prior | -8 |
| Revised | n/a |
| Survey | -1.0% |
| Actual | 0.1% |
| Prior | -0.4% |
| Revised | -0.2% |
Not released yet..
| Survey | – |
| Actual | – |
| Prior | -37 |
| Revised | – |
[comments]

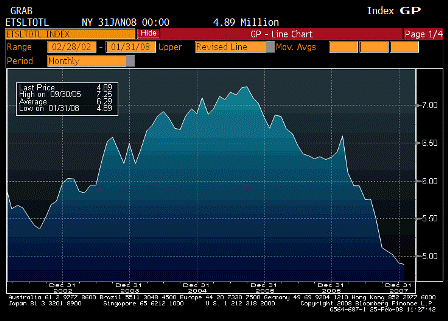
| Survey | 4.80M |
| Actual | 4.89M |
| Prior | 4.89M |
| Revised | 4.91M |

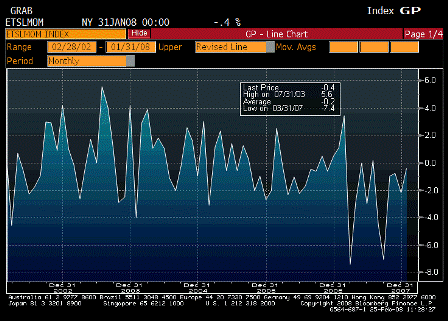
| Survey | -1.8% |
| Actual | -0.4 |
| Prior | -2.2% |
| Revised | n/a |
A little better than expected. A glimmer of hope here as well.
| Survey | 349K |
| Actual | 349K |
| Prior | 348K |
| Revised | 358K |
Down a bit but lost a day in California. Chart looks like it’s drifted to a bit higher levels.
Still not recession type numbers yet, however.
| Survey | 2760K |
| Actual | 2784 |
| Prior | 2761K |
| Revised | 2736 |
Also looking like it’s moved up to higher levels, but still far from typical recession levels.
| Survey | -10.0 |
| Actual | -24.0 |
| Prior | -20.9 |
| Revised | n/a |
Looks serious! Strange that employment was up 2.5, however, and, of course, prices on the rise.
| Survey | -0.1% |
| Actual | -0.1% |
| Prior | -0.2% |
| Revised | -0.1% |
Still drifting lower, but no collapse.
| Survey | n/a |
| Actual | 357.6 |
| Prior | 403.9 |
| Revised | n/a |
| Survey | n/a |
| Actual | 3533.8 |
| Prior | 4901.5 |
| Revised | n/a |
These look very weak.
Banks are not included, so there’s a chance the banks could be taking market share from the mortgage bankers.
| Survey | 0.3% |
| Actual | 0.4% |
| Prior | 0.3% |
| Revised | 0.4% |
| Survey | 0.2% |
| Actual | 0.3% |
| Prior | 0.2% |
| Revised | n/a |
| Survey | 4.2% |
| Actual | 4.3% |
| Prior | 4.1% |
| Revised | n/a |
| Survey | 2.4% |
| Actual | 2.5% |
| Prior | 2.4% |
| Revised | n/a |
Today’s CPI report shows inflation is moving up sharply. If it was above Yellen the dove’s comfort zone last week it even further above it now. Same with Mishkin, who more than once said the FOMC had to be prepared to reverse course as needed.
Stocks are sensing they may be ‘on their own’ if the Fed is constrained by inflation.
Yes, the economy is weak, growth near 0 (see housing below), but demand is high enough to keep pushing food, crude, and import/export prices ever higher.
The Fed seeks an output gap/GDP growth consistent with inflation within their comfort zone.
Stronger growth will increase their inflation forecasts, while weaker growth is expected to bring inflation down.
Higher prices for food and crude are also presumed to bring out supply side responses, thereby bringing prices down.
But they also believe this has to happen before inflation expectations elevate, otherwise the higher prices get ‘monetized’ and a relative value story turns into an inflation story.
The data is now showing that is starting to happen, and for most FOMC time has probably run out. They may now feel they have used up all the past ‘credibility’ that has kept inflation expectations ‘well anchored’ trying to ‘forestall’ a financial collapse.
| Survey | 1010K |
| Actual | 1012K |
| Prior | 1006K |
| Revised | 1004K |
A glimmer of hope, but not much, but still winter numbers. Better picture will emerge by March.
| Survey | 1050K |
| Actual | 1048K |
| Prior | 1068K |
| Revised | 1080K |
No sign of a turn here.
From Karim:
Core up 0.311%; with headline spurred by food and energy (each up 0.7%). Y/Y up to 2.5% from 2.4%
OER up another 0.3% and medical up 0.5%
Some items unlikely to repeat next month are lodging away from home, which was up 1.1%.
Also, apparel (which was up 0.4%) has now risen 5 straight months. This series usually chops around and like lodging away from home, has seasonal adjustment issues. Tobacco up 1.1% after 0.8% prior month. Expect all of these to reverse over next 1-2 months.
Maybe, maybe not. With import prices and local costs rising, cost-push-inflation can keep things moving up until all catches up with food/energy numbers.
Also, many wage agreements, including government, and other contracts have CPI escalators, which sustain demand for the ever higher prices.
Housing starts tick up 0.8% from downwardly revised December number; single family starts down another 3% to lowest since 1/91
Building permits down another 3% (typically leads starts)
Bottom line is Fed is likely to believe that the pattern of growth and inflation of the past two easing cycles will repeat itself (chart attached); that is inflation typically peaks about 2-3 years after the peak in growth. Fed Member Stern (voter) referred to this yesterday where he said he expected core to come down over the next several years but not anytime soon, and that recent rate cuts were ‘wholly appropriate’.
Agreed, they may believe that, but they also believe that if inflation expectations elevate, the higher prices get ‘monetized’ and don’t revert.
That’s why they are so focused on the inflation expectation indicators, which they also know are difficult to read and not considered completely reliable.
| Survey | 19 |
| Actual | 20 |
| Prior | 19 |
| Revised | – |
Still a possible bottom forming.
Coming out later today..
| Survey | -37 |
| Actual | — |
| Prior | -37 |
| Revised | — |
[comments]
| Survey | 6.5 |
| Actual | -11.7 |
| Prior | 9.0 |
| Revised | n/a |
Down, but it has been lower, not yet to previous recession levels.
| Survey | 0.1% |
| Actual | 0.1% |
| Prior | 0.0% |
| Revised | 0.1% |
Modestly positive, and not at recession levels.
| Survey | 81.3% |
| Actual | 81.5% |
| Prior | 81.4% |
| Revised | 81.5% |
Holding up reasonably well.
| Survey | 76.0 |
| Actual | 69.6 |
| Prior | 78.4 |
| Revised | n/a |
The CNBC effect keeping expectations down.
One year inflation expectations jumped to 3.7% putting the Fed on high alert.
♥