2008-08-07 US Economic Releases


[Skip to the end]


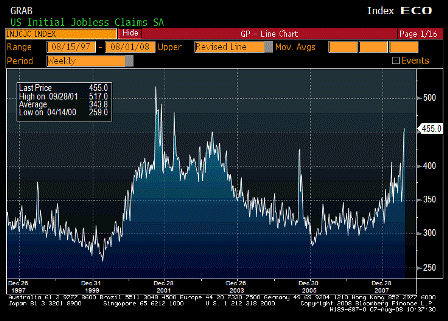
Initial Jobless Claims (Aug 2)

Survey 425K
Actual 455K
Prior 448K
Revised n/a

Karim writes:

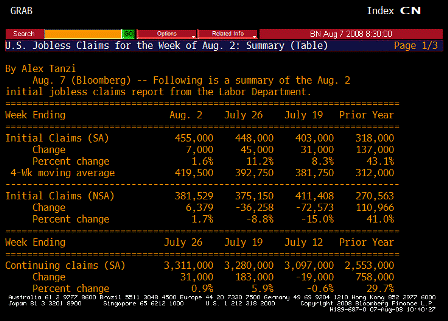
  • Initial claims rise 7k to new cycle high of 455k with 4wk moving avg up from 393k to 420k
[top][end]

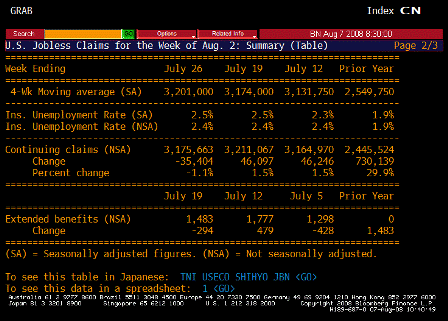
Continuing Jobless Claims (Jul 26)

Survey 3255K
Actual 3311K
Prior 3282K
Revised 3280K

Karim writes:

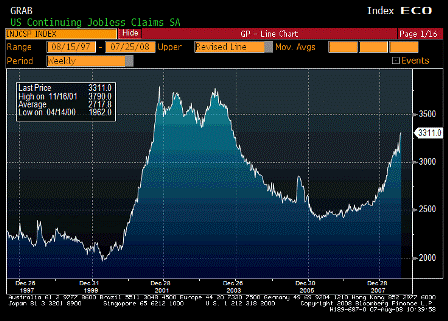
  • Continuing claims rise from 3280k to 3311k and 4wk moving avg up from 3174k to 3201k
[top][end]

Jobless Claims TABLE 1 (Jul 26)

[top][end]

Jobless Claims TABLE 2 (Jul 26)

Cesar writes:

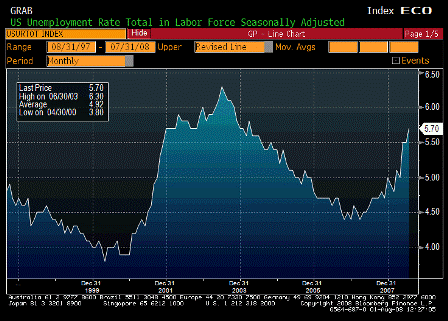
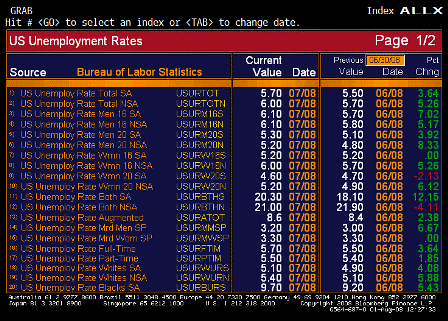
A year ago we were at 4.7% unemployment rate (7,137 unemployed/ 153,182 labor force)

We are currently at 5.7% unemployment rate (8,784 unemployed/ 154,603 labor force)

Seems nearly the entire jump in unemployment is due to labor force increases.

Total employed is about flat.

In that case, GDP growth is about equal to productivity growth.

Karim writes:

  • Initial claims somewhat distorted by new program to extend benefits where those filing extensions are considered first time filers (double counted); this should have an effect for the first 2-3 weeks of the program before initial claims fall back to trend level (same happened back in 2001). Last week was first week of program, so numbers for next 2 weeks should reflect underlying trend (last number before extension program was 403k). Of concern would be if numbers don’t fall back much.
  • This program does not effect continuing claims, which reflects ability to find a job once laid off. This is at a new cycle high.
[top][end]


Pending Home Sales MoM (Jun)

Survey -1.0%
Actual 5.3%
Prior -4.7%
Revised -4.9%

Karim writes:

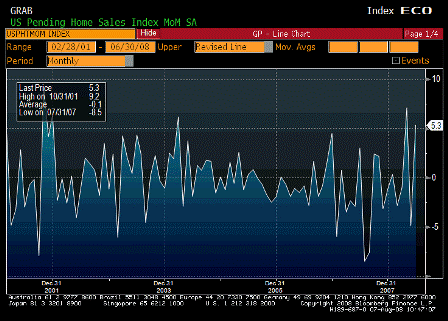
  • Rise 5.3% m/m, continuing recent see-saw pattern (-4.9%, +7.1% prior 2mths).

Q2 GDP for Japan and Germany are out next week. A German newspaper yesterday leaked German GDP growth likely to be -1 to -1.5%. Much of this is a giveback for a strong Q1 of +1.5% but definitely weaker than expected. Of concern to the ECB is that Spain (industrial production now down 10% y/y) and Italy already written off, so much depends on Germany. Moreover, German PMIs have gotten off to a very weak start for Q3. I imagine that was at the root of Trichet’s more dovish tone today.

Estimates for Japanese Q2 GDP are in the -1% to -3.5% range. The July Tankan and the foreign orders component of last night’s machinery orders data also don’t bode too well for Q3.
[top][end]

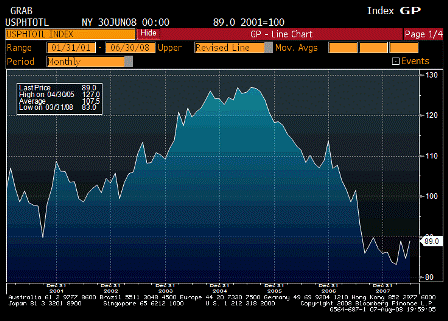
Pending Home Sales YoY (Jun)

Survey n/a
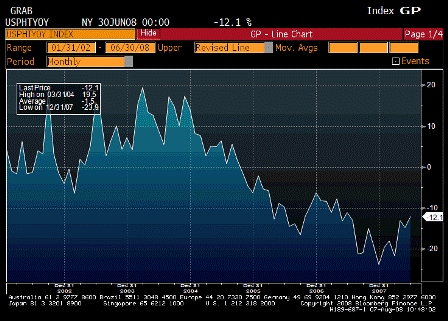
Actual -12.1%
Prior -14.8%
Revised n/a

Looks like it has bottomed and moving up as prices have adjusted and GDP has improved.

Housing my no longer be subtracting from GDP.
[top][end]

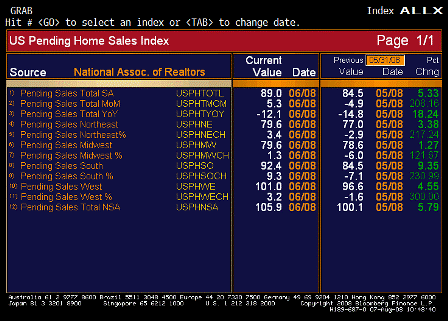
Pending Home Sales Total SA (Jun)

Survey n/a
Actual 89.0
Prior 84.5
Revised n/a

Looks to have found support and probably bottomed albeit at very low levels.
[top][end]

Pending Home Sales ALLX (Jun)

[top][end]


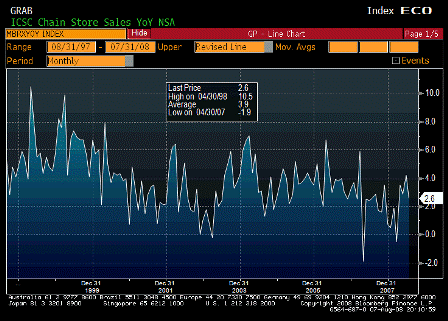
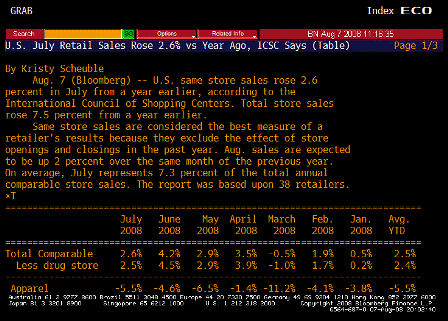
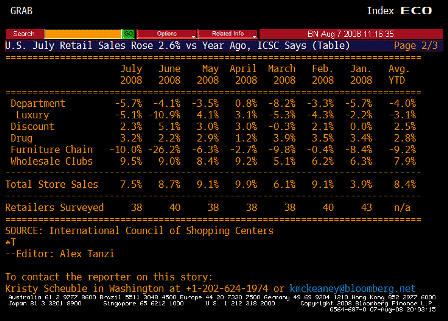
ICSC Chain Store Sales YoY (Jul)

Survey 3.4%
Actual 2.6%
Prior 4.3%
Revised 4.2%

Less then expected but not bad.

[top][end]

ICSC TABLE 1 (Jul)

[top][end]

ICSC TABLE 2 (Jul)

[top][end]


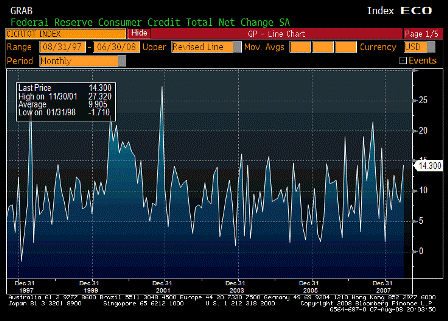
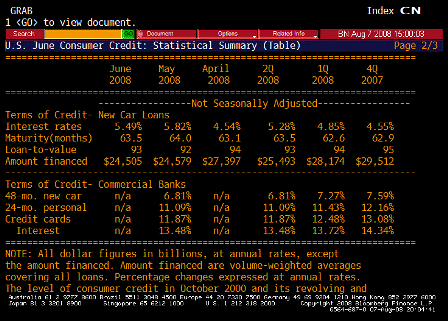
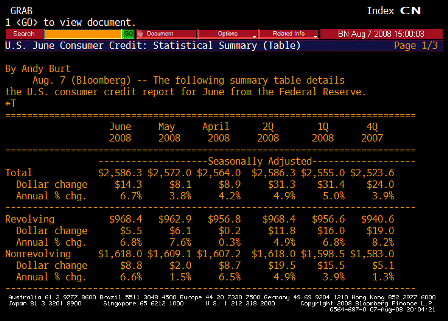
Consumer Credit (Jun)

Survey $6.3B
Actual $14.3B
Prior $7.8B
Revised $8.1B

Volatile series. Moving up some to support higher levels of spending.
[top][end]

Consumer Credit TABLE 1 (Jun)

[top][end]

Consumer Credit TABLE 2 (Jun)

Note from the graph the improving position of the domestic sector as the government deficit and net exports rise and support domestic ‘savings’ and spending. The US budget deficit is expected to exceed 3% this year and exports should remain firm even with slowing foreign economies. In fact, that’s one of the primary reasons those economies are slowing.

U.S. June Consumer Credit Up $14.3 Billion, More Than Forecast

by Shobhana Chandra

(Bloomberg) U.S. consumers borrowed more than twice as much as economists forecast in June as the slump in real-estate prices prevented American homeowners from tapping into home-equity lines of credit.

Consumer credit rose by $14.3 billion, the most since November, to $2.59 trillion, the Federal Reserve said today in Washington. In May, credit rose by $8.1 billion, previously reported as an increase of $7.8 billion. The Fed’s report doesn’t cover borrowing secured by real estate.

Consumers are using credit cards and loans to cover expenses as falling home values cause banks to restrict access to home- equity lines. The Bush administration sent out tax rebate checks in the past three months to help support spending, which accounts for more than two-thirds of the economy.

“Consumers are stressed, and some who are short of cash are relying more on credit cards,” Joseph Brusuelas, chief economist at Merk Investments LLC in Palo Alto, California, said before the report.


[top]

2008-08-06 US Economic Releases


[Skip to the end]


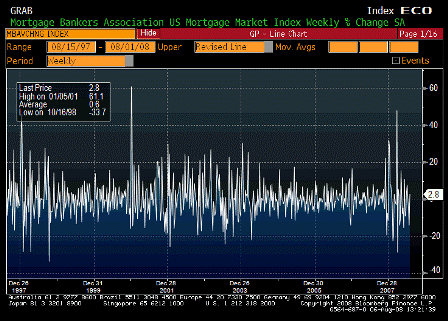
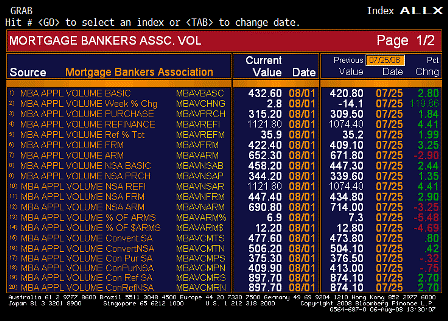
MBA Mortgage Applications (Aug 1)

Survey n/a
Actual 2.8%
Prior -14.1%
Revised n/a

Nudging up a tad. Still looking soft. Mortgage bankers losing market share to banks. Even this low level equates historically to higher levels of sales and new starts.

[top][end]

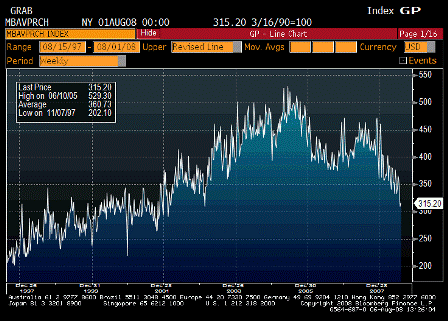
MBA Purchasing Index (Aug 1)

Survey n/a
Actual 315.2
Prior 309.5
Revised n/a

Up some, muddling along. Most of the resets are past.

[top][end]

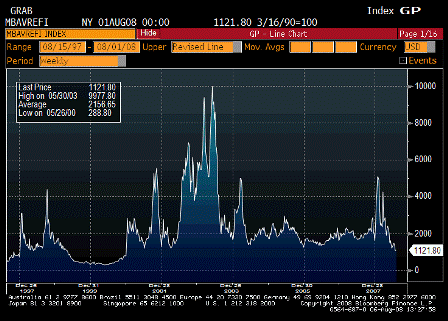
MBA Refinancing Index (Aug 1)

Survey n/a
Actual 1121.8
Prior 1074.4
Revised n/a

[top][end]

MBA ALLX 1 (Aug 1)

[top][end]

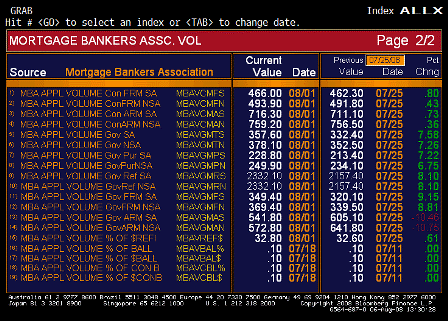
MBA ALLX 2 (Aug 1)

“The refinancing applications index climbed 4.4 percent to 1,121.8 last week, while the home purchase applications gauge rose 1.8 percent to 315.2 on a seasonally adjusted basis, the MBA said.”

Government spending will lift housing along with aggregate demand in general, as it always does, and there are numerous signs it’s already happening.

And history will probably see it as the Fed’s rate cuts of a year ago as it always does.

They say monetary policy ‘works’ with a lag, but seems to me the lag is always until fiscal spending kicks in.

It was the fiscal package of 2003 and not the low interest rates that got housing going the last time around.

(And history blames Greenspan for the housing ‘bubble’ rather than Bush.)

Now and then the private and foreign sector can provide the spending power by spending by ‘reducing its savings’/going into debt but that process is ultimately unsustainable without the support of government deficit spending.

The recession has again been pushed forward a quarter or two, with street firms now saying Q3 will be ok, but Q4/Q1 will be weak.

With the latest GDP revisions it’s looking more and more like Q4 2007 was the bottom, and the government deficit looking to move towards 4% of GDP should be sufficient for continued muddling through.

Demand isn’t high enough for ‘full employment’ so labor markets (whatever that actually means) should remain soft.

And more people previously not looking for work now looking for work (they now desire more income due to higher prices) will probably keep the unemployment rate elevated.


[top]
2008-08-05 US Economic Releases


[Skip to the end]


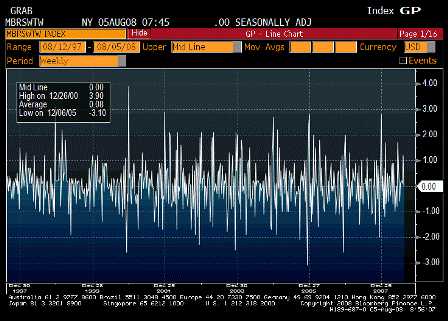
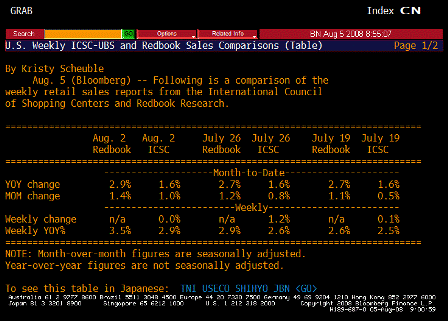
ICSC-UBS Store Sales WoW (Aug 5)

Survey n/a
Actual 0.0%
Prior 1.2%
Revised n/a

Flat, but year over year still looking ok.

[top][end]

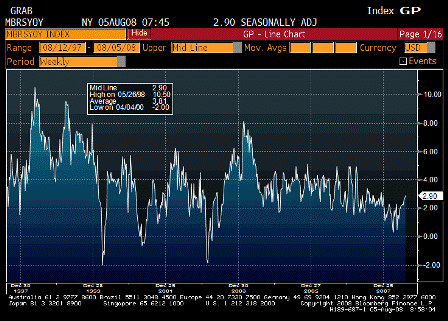
ICSC-UBS Store Sales YoY (Aug 5)

Survey n/a
Actual 2.9%
Prior 2.6%
Revised n/a

Continues higher into today’s meeting.

By itself, generally not an important number for the Fed.

[top][end]

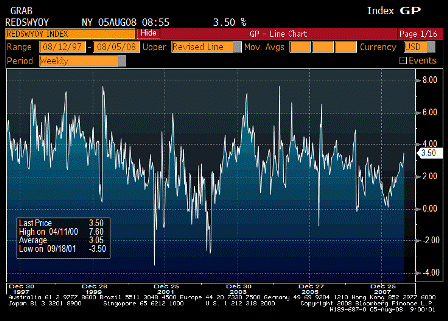
Redbook Store Sales Weekly YoY (Aug 5)

Survey n/a
Actual 3.5%
Prior 2.9%
Revised n/a

Also moving up, even after rebates have gone out.

[top][end]

ICSC-UBS Redbook Comparison TABLE (Aug 5)

[top][end]


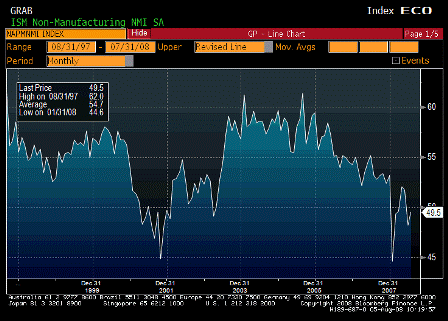
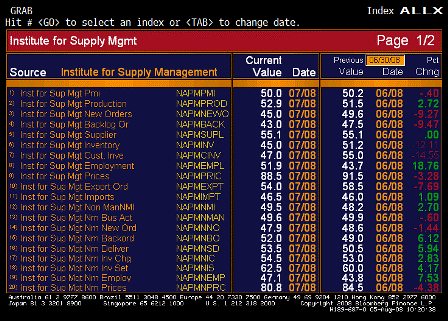
ISM Non-Manufacturing Composite (Jul)

Survey 48.8
Actual 49.5
Prior 48.2
Revised n/a

Better than expected, seems to be holding at muddle through levels.

[top][end]

ISM Non-Manufacturing Composite ALLX 1 (Jul)

[top][end]

ISM Non-Manufacturing Composite ALLX 2 (Jul)


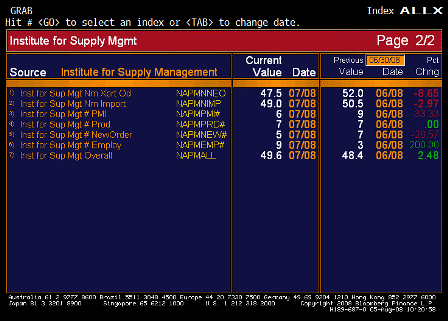
Karim writes:

  • Employment up, export orders and prices paid down were largest movers. Number is for July, so employment number doesn’t seem consistent with NFP data for same month.
  • Export orders do seem consistent with recent data out of Europe and Japan (Eurozone retail sales for June that came out today showed down 3.1% y/y).
  • “Our business remains at about the same level as the previous month, with continued focus on cost reduction.” (Finance & Insurance)

    “The general state of the home-building industry has not changed since last month; however, with the commodity and code changes going into 2009, we face much higher construction costs and reduced margins across the entire supply chain.” (Construction)

    Right, prices to rise even as volumes remain low, as headline leaks into core via cost push.

    “Continue to see slowdown in local economy.” (Health Care & Social Assistance)

    “While still positive, the overall outlook for 2008 for our company is not as high as earlier in the year.” (Wholesale Trade)

    “Governmental spending for services is up this period.” (Professional, Scientific & Technical Services)

    Yes, government deficit spending on the rise.

    July June
    2008 2008
    Index 49.5 48.2

    While below 50, this still implies positive GDP growth and is not collapsing as feared.

    Activity 49.6 49.9
    Prices Paid 80.8 84.5

    Still way high.

    New Orders 47.9 48.6
    Employment 47.1 43.8

    Agreed – not in sync with other employment indicators, but the other numbers reflect large numbers of new entrants to the labor market – a higher labor force participation rate.

    So these companies maybe planning employment increases, but falling short of those new people now reported to be looking for work

    Export Orders 47.5 52.0
    Imports 49.0 50.5

    [top][end]

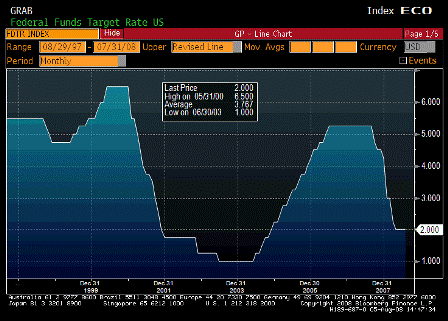
    FOMC Rate Decision (Aug 5)

    Survey 2.00%
    Actual 2.00%
    Prior 2.00%
    Revised 2.00%

    Fisher voting to hike, and others placated by stronger anti-inflation rhetoric.

    History will not be kind to this Fed.


    Karim writes:

    • Bland statement-1 dissent (Fisher)
    • Dovish-
        <
      • Economic activity ‘expanded’ in the 2nd qtr (no mention of ongoing expansion)
      • Labor markets have softened further and markets remain under considerable stress
      • No mention that downside risks to growth have diminished (as they did last time)

    Hawkish-Upside risks to inflation are also of ‘significant’ concern (new)

    Bottom Line: No guidance of anything imminent (i.e., Sep move is off the table). October 29 meeting is 1 week before election and Nov payrolls report, so December meeting earliest likely to see a move, if any.

    NEW

    Economic activity expanded in the second quarter, partly reflecting growth in consumer spending and exports. However, labor markets have softened further and financial markets remain under considerable stress. Tight credit conditions, the ongoing housing contraction, and elevated energy prices are likely to weigh on economic growth over the next few quarters. Over time, the substantial easing of monetary policy, combined with ongoing measures to foster market liquidity, should help to promote moderate economic growth.

    Inflation has been high, spurred by the earlier increases in the prices of energy and some other commodities, and some indicators of inflation expectations have been elevated. The Committee expects inflation to moderate later this year and next year, but the inflation outlook remains highly uncertain.

    Although downside risks to growth remain, the upside risks to inflation are also of significant concern to the Committee. The Committee will continue to monitor economic and financial developments and will act as needed to promote sustainable economic growth and price stability.

    OLD

    Recent information indicates that overall economic activity continues to expand, partly reflecting some firming in household spending. However, labor markets have softened further and financial markets remain under considerable stress. Tight credit conditions, the ongoing housing contraction, and the rise in energy prices are likely to weigh on economic growth over the next few quarters.

    The Committee expects inflation to moderate later this year and next year. However, in light of the continued increases in the prices of energy and some other commodities and the elevated state of some indicators of inflation expectations, uncertainty about the inflation outlook remains high.

    The substantial easing of monetary policy to date, combined with ongoing measures to foster market liquidity, should help to promote moderate growth over time. Although downside risks to growth remain, they appear to have diminished somewhat, and the upside risks to inflation and inflation expectations have increased. The Committee will continue to monitor economic and financial developments and will act as needed to promote sustainable economic growth and price stability.


    [top]
2008-08-04 US Economic Releases


[Skip to the end]


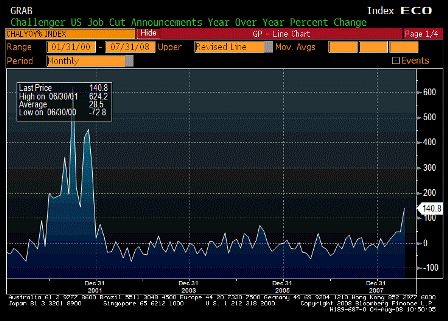
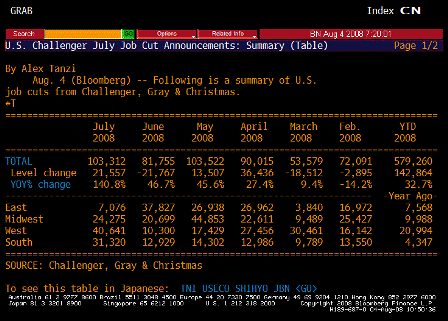
Challenger Job Cuts YoY (Jul)

Survey n/a
Actual 140.8%
Prior 46.7%
Revised n/a

Starting to reflect the labor market weakness.

[top][end]

Challenger Job Cuts TABLE (Jul)

[top][end]


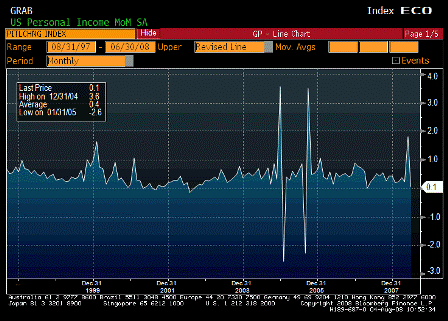
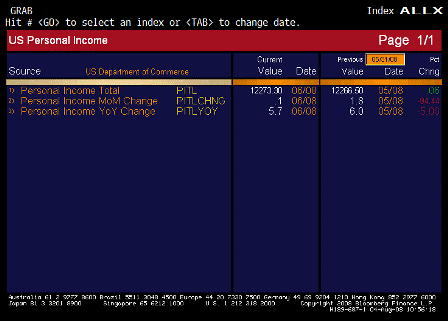
Personal Income MoM (Jun)

Survey -0.2%
Actual 0.1%
Prior 1.9%
Revised 1.8%

Better than expected and looking ok.

[top][end]

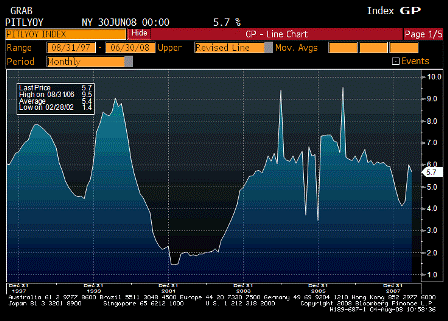
Personal Income YoY (Jun)

Survey n/a
Actual 5.7%
Prior 6.0%
Revised n/a

Holding up with the fiscal package kicking in along with other government spending.

[top][end]

Personal Income ALLX (Jun)

[top][end]


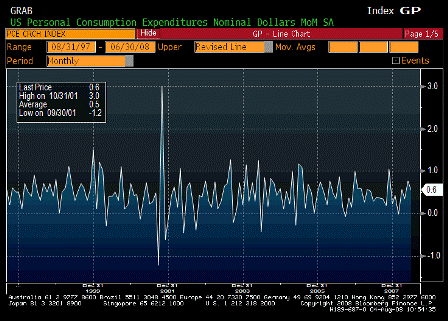
Personal Spending MoM (Jun)

Survey 0.4%
Actual 0.6%
Prior 0.8%
Revised n/a

Also better than expected for same reasons.

[top][end]

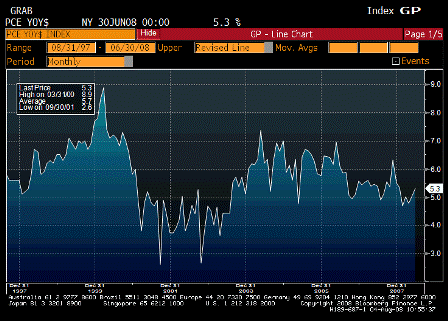
Personal Spending YoY (Jun)

Survey n/a
Actual 5.3%
Prior 5.0%
Revised n/a

Looking pretty good here, too.

[top][end]

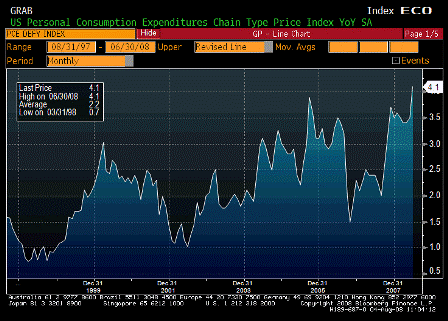
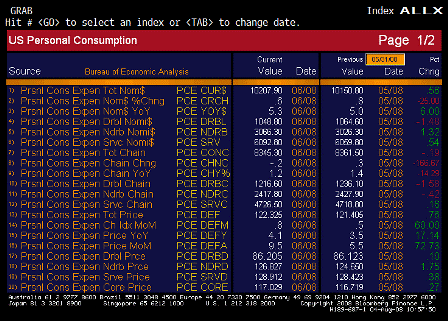
PCE Deflator YOY (Jun)

Survey 3.7%
Actual 4.1%
Prior 3.1%
Revised 3.5%

ugly number for the Fed tomorrow.

[top][end]

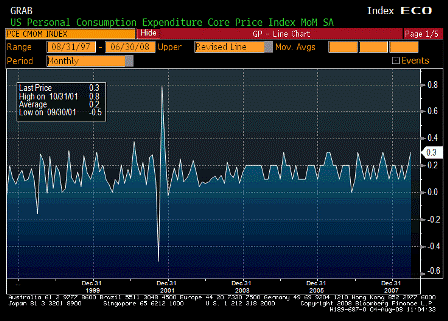
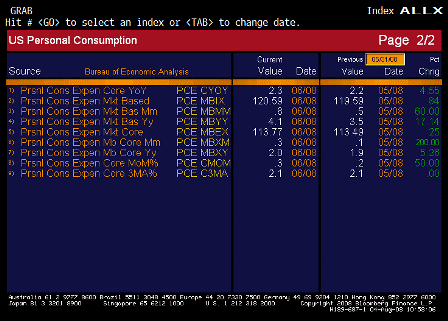
PCE Core MoM (Jun)

Survey 0.2%
Actual 0.3%
Prior 0.1%
Revised 0.2%

Fed wary of headline leaking into core. This is not encouraging.

[top][end]

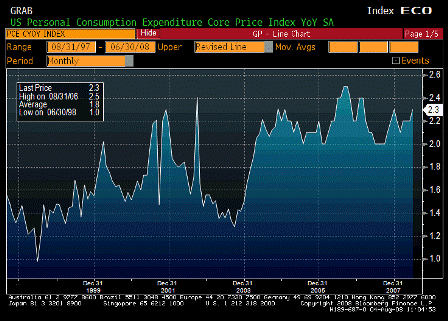
PCE Core YoY (Jun)

Survey 2.2%
Actual 2.3%
Prior 2.1%
Revised 2.2%

Also moving the wrong way for the Fed, and they know headline numbers leak into core with substantial lags.

[top][end]

Personal Spending ALLX 1 (Jun)

[top][end]

Personal Spending ALLX 2 (Jun)

[top][end]


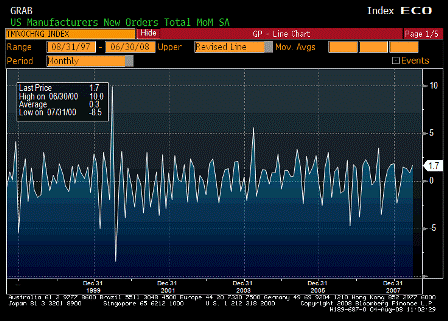
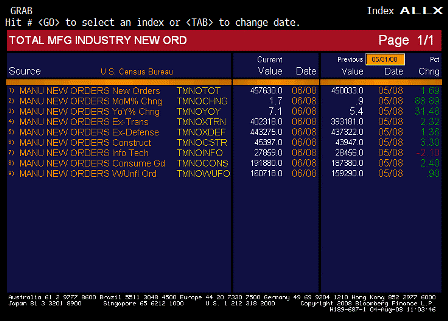
Factory Orders MoM (Jun)

Survey 0.7%
Actual 1.7%
Prior 0.6%
Revised 0.9%

Government and exports providing the support at the macro level.

[top][end]

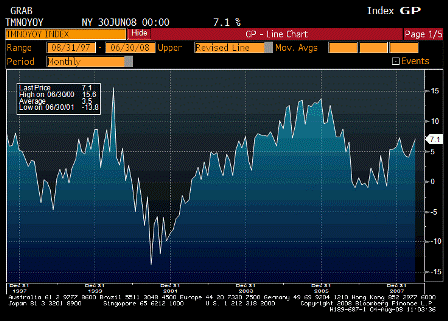
Factory Orders YoY (Jun)

Survey n/a
Actual 7.1%
Prior 5.4%
Revised n/a

Looks to be moving up nicely.

[top][end]

Factory Orders ALLX (Jun)


[top]
2008-08-01 US Economic Releases


[Skip to the end]


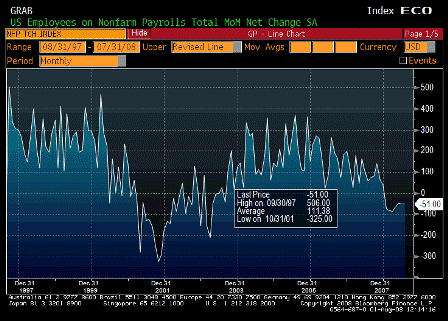
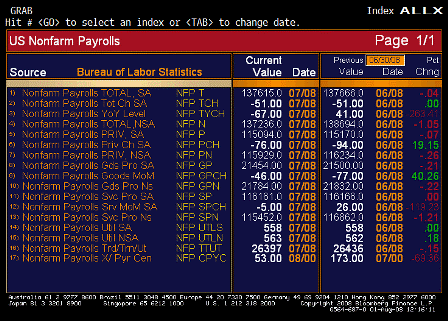
Change in Nonfarm Payrolls MoM (Jul)

Survey -75K
Actual -51K
Prior -2K
Revised -51K

The drops are leveling off, maybe declining.

[top][end]

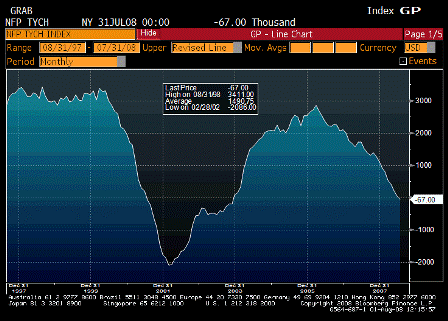
Change in Nonfarm Payrolls YoY (Jul)

Survey n/a
Actual -67
Prior 41
Revised n/a

Now down year over year.

[top][end]

Nonfarm Payrolls ALLX (Jul)

[top][end]


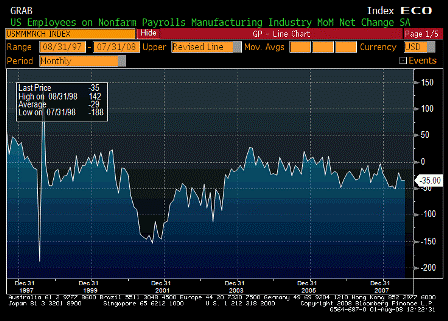
Change in Manufacturing Payrolls MoM (Jul)

Survey -40K
Actual -35K
Prior -33K
Revised -35K

Falling at an historically steady rate with increases in productivity and outsourcing.

[top][end]

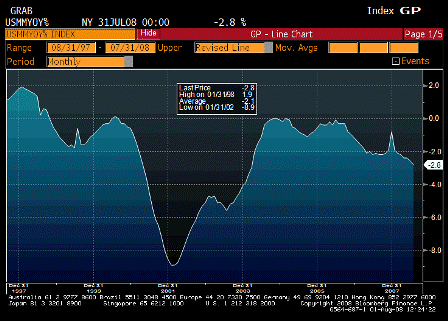
Change in Manufacturing Payrolls YoY (Jul)

Survey n/a
Actual -2.8%
Prior -2.6%
Revised n/a

Continuiously falling.

[top][end]

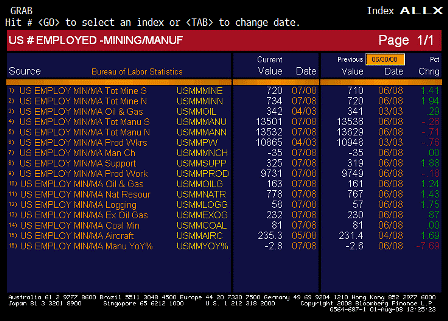
Manufacturing Payrolls ALLX (Jul)

[top][end]


Unemployment Rate (Jul)

Survey 5.6%
Actual 5.7%
Prior 5.5%
Revised n/a

Not looking good. This represents lost real output.

[top][end]

Unemployment Rate ALLX 1 (Jul)

[top][end]

Unemployment Rate ALLX 2 (Jul)

[top][end]


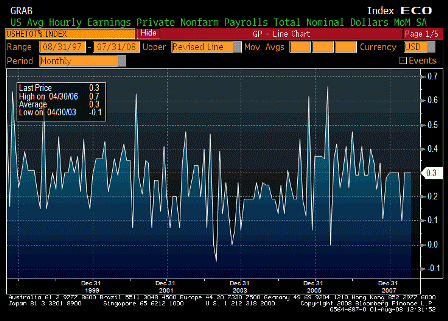
Average Hourly Earnings MoM (Jul)

Survey 0.3%
Actual 0.3%
Prior 0.3%
Revised n/a

Bending some but not breaking.

Could spring higher with a meaningful recovery in GDP.

[top][end]


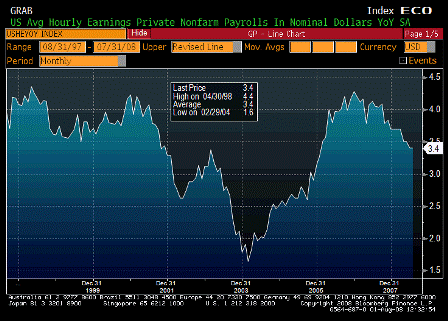
Average Hourly Earnings YoY (Jul)

Survey 3.4%
Actual 3.4%
Prior 3.4%
Revised n/a

Growth continues to moderate some.

[top][end]

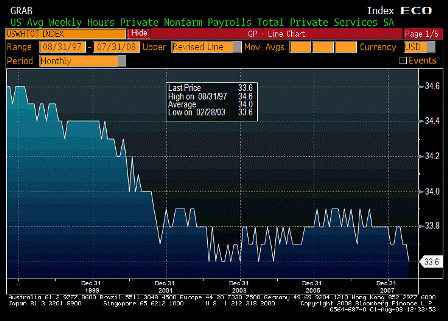
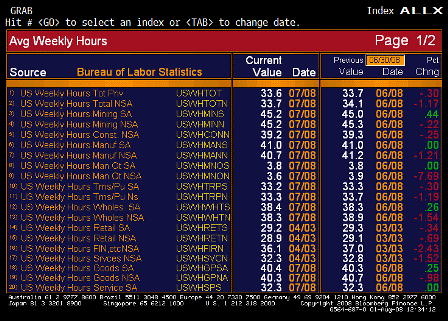
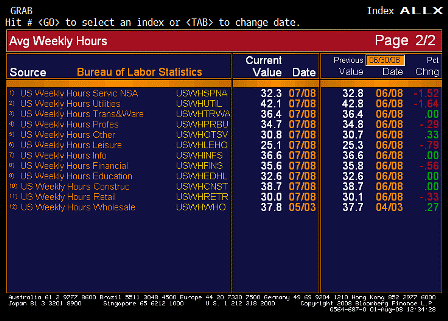
Average Weekly Hours (Jul)

Survey 33.7
Actual 33.6
Prior 33.7
Revised n/a

Looking very weak

[top][end]

Average Weekly Hours ALLX 1 (Jul)

[top][end]

Average Weekly Hours ALLX 2 (Jul)

[top][end]


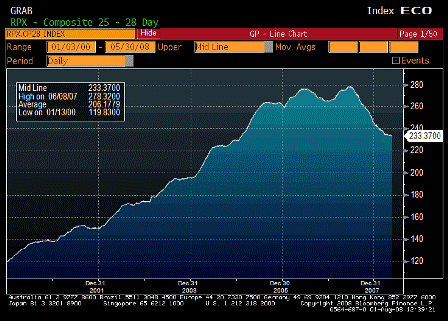
RPX Composite 28dy Index (May)

Survey n/a
Actual 233.37
Prior 234.41
Revised n/a

[top][end]

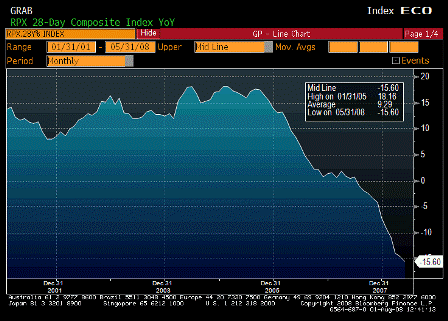
RPX Composite 28dy YoY (May)

Survey n/a
Actual -15.60%
Prior -14.67%
Revised n/a

[top][end]


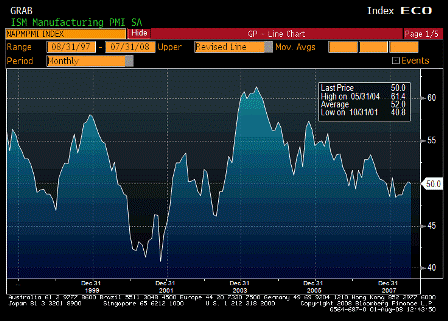
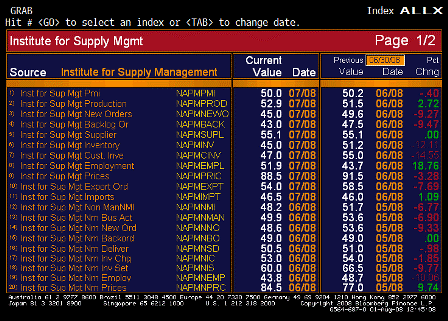
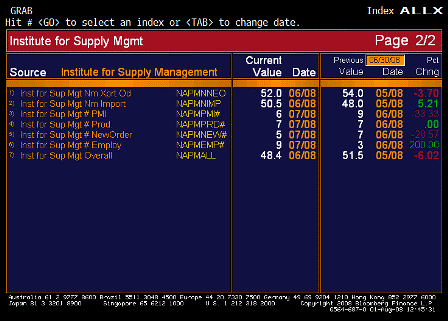
ISM Manufacturing (Jul)

Survey 49.0
Actual 50.0
Prior 50.2
Revised n/a

Better than expected, far from recession levels.

[top][end]

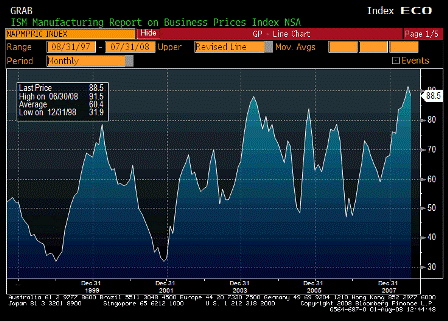
ISM Prices Paid (Jul)

Survey 88.0
Actual 88.5
Prior 91.5
Revised n/a

Staying far too high for far too long for the Fed’s liking.

[top][end]

ISM ALLX 1 (Jul)

[top][end]

ISM ALLX 2 (Jul)

[top][end]


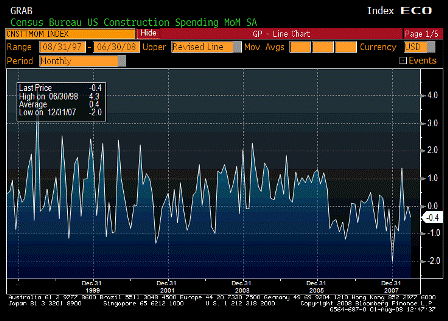
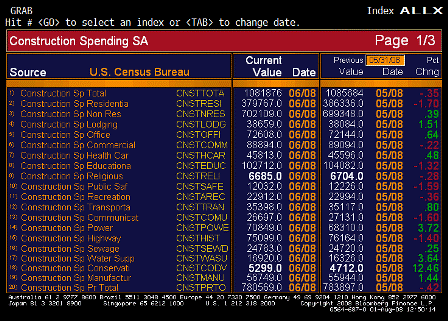
Construction Spending MoM (Jun)

Survey -0.3%
Actual -0.4%
Prior -0.4%
Revised 0.0%

Weak but not terrible given the general environment.

[top][end]

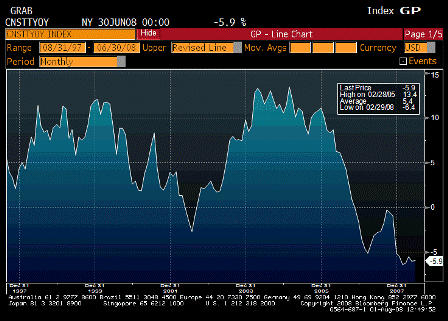
Construction Spending YoY (Jun)

Survey n/a
Actual -5.9%
Prior -6.0%
Revised n/a

Down but not in collapse.

[top][end]

Construction Spending ALLX 1 (Jun)

[top][end]

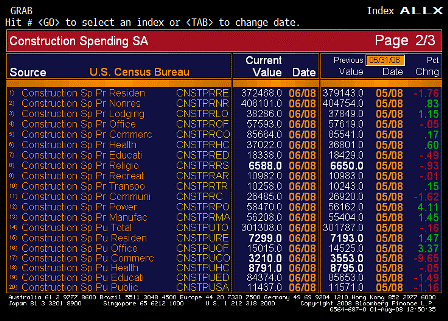
Construction Spending ALLX 2 (Jun)

[top][end]

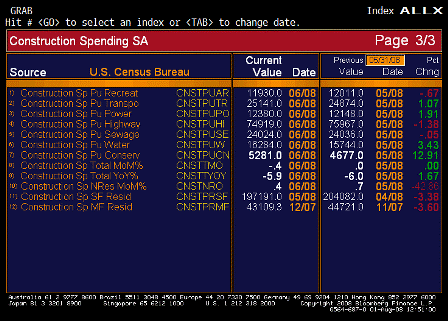
Construction Spending ALLX 3 (Jun)


[top]
2008-07-31 US Economic Releases


[Skip to the end]


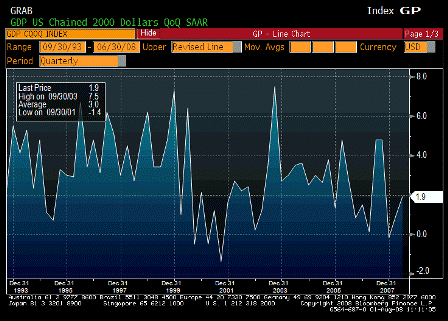
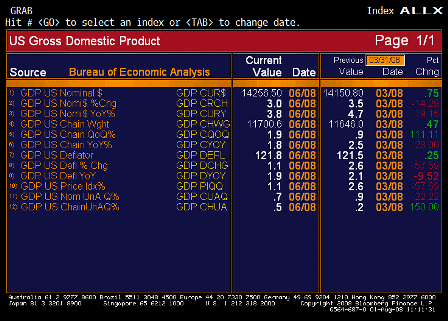
GDP QoQ Annualized (2Q A)

Survey 2.3%
Actual 1.9%
Prior 1.0%
Revised 0.9%

Less than expected, and helped by a low deflator, but up nonetheless with government and exports leading the charge.

[top][end]

GDP Price Index (2Q A)

Survey 2.4%
Actual 1.1%
Prior 2.7%
Revised 2.6%

big drop in the headline deflator – need to wait for next quarter to see if it’s reversed.

[top][end]

GDP ALLX (2Q A)

From Cesar:

GDP:

  • grew 1.9% below expectations of 2.3%
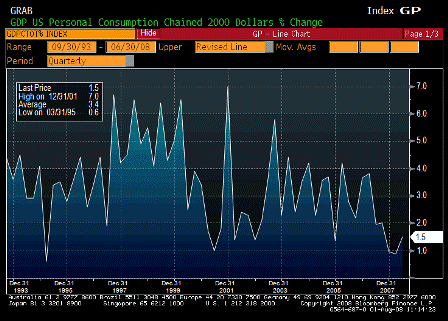
  • rebates helped consumption grow 1.5% for 1.08% contribution to growth
  • net exports added 2.42% to growth
  • inventories were drag of 1.92%
  • residential investment was down -15.6% after declining 25.1% last month and the drag was “only” .62% after subtracting over 1% from GDP the last 3 quarters…
    housing drag on GDP will diminish as decline decelerates and housing shrinks as % of total GDP

[top][end]


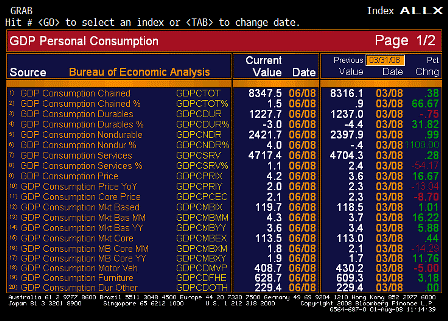
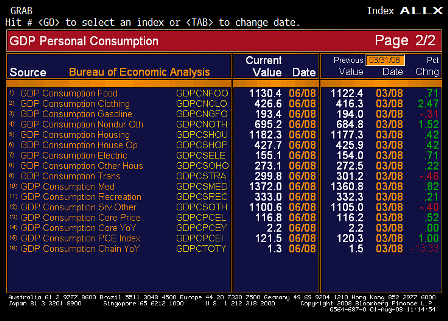
Personal Consumption (2Q A)

Survey 1.7%
Actual 1.5%
Prior 1.1%
Revised 0.9%

Less than expected but turning up.

[top][end]

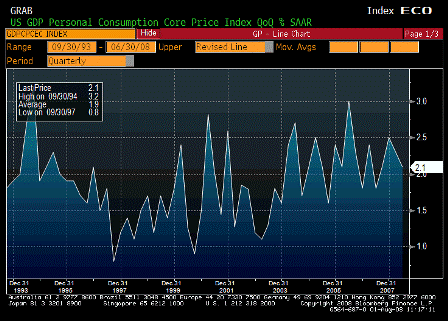
Core PCE QoQ (2Q A)

Survey 2.0%
Actual 2.1%
Prior 2.3%
Revised n/a

Worse than expected and still looks to be working its way higher over time.

[top][end]

Personal Consumption ALLX 1 (2Q A)

[top][end]

Personal Consumption ALLX 2 (2Q A)

[top][end]


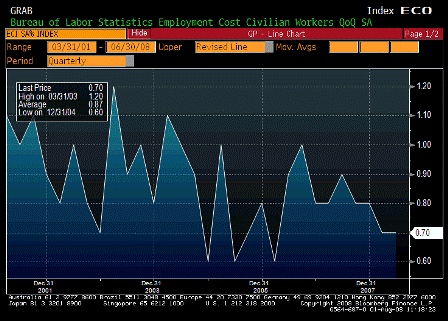
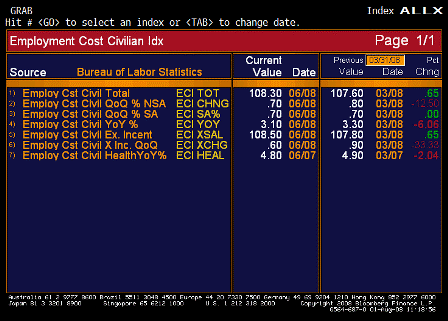
Employment Cost Index (2Q)

Survey 0.7%
Actual 0.7%
Prior 0.7%
Revised n/a

As expected

Look to import prices as an indication of foreign employment costs of what we consume. They are rising rapidly.

[top][end]

Employment Cost Index ALLX (2Q)

[top][end]


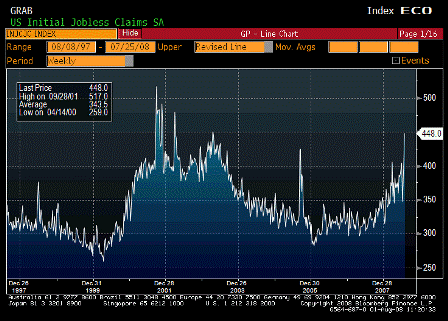
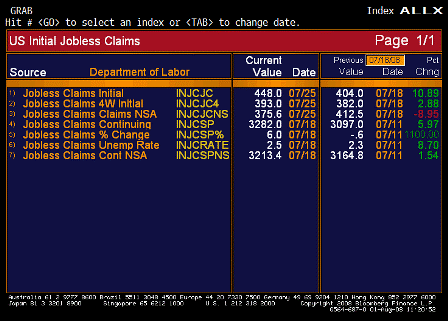
Initial Jobless Claims (Jul 26)

Survey 393K
Actual 448K
Prior 406K
Revised 404K

Higher than expected, and indicate next month might be a tougher job environment.

4 week average approaching 400,000.

[top][end]

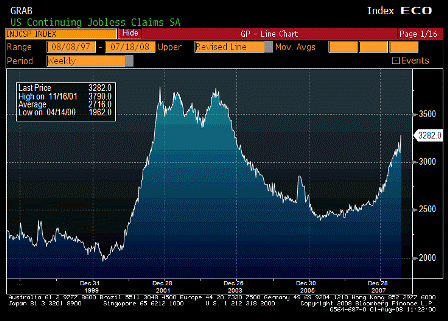
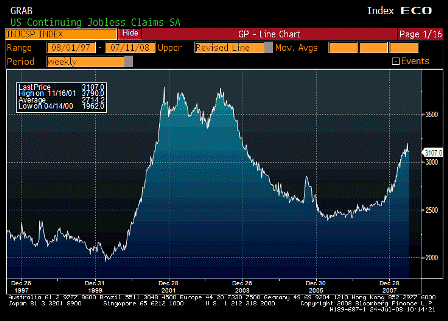
Continuing Jobless Claims (Jul 19)

Survey 3150K
Actual 3282K
Prior 3107K
Revised 3097K

Not looking good at all. No sign of retreat yet.

[top][end]

Jobless Claims ALLX (Jul 26)

From Cesar:
Initial and continuing claims:

jump to new cycle highs of 448k and 3,282k, respectively (no special factors noted)
the weakness in this real-time indicator seems to tell us more about current state of economy than today’s GDP reports or tomorrow’s payrolls…

[top][end]


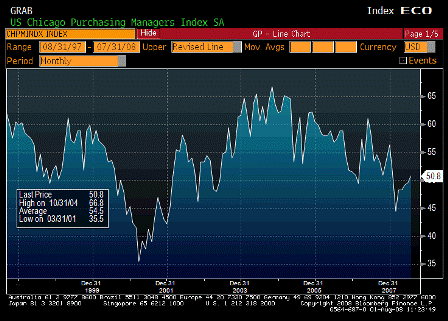
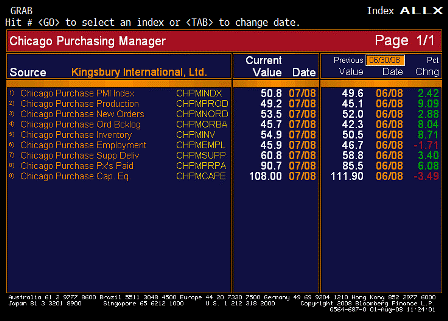
Chicago Purchasing Manager (Jul)

Survey 49.0
Actual 50.8
Prior 49.6
Revised n/a

Higher than expected.

Prices paid remains very high.

[top][end]

Chicago Purchasing Manager ALLX (Jul)

[top][end]


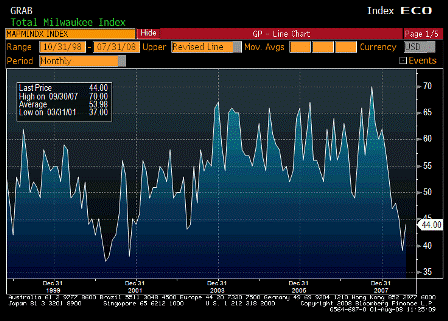
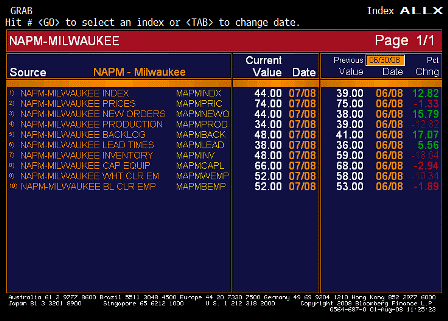
NAPM-Milwaukee (Jul)

Survey 43.5
Actual 44.0
Prior 39.0
Revised n/a

Higher then expected.

Prices paid remain very high.

[top][end]

NAPM-Milwaukee ALLX (Jul)


[top]
2008-07-30 US Economic Releases


[Skip to the end]


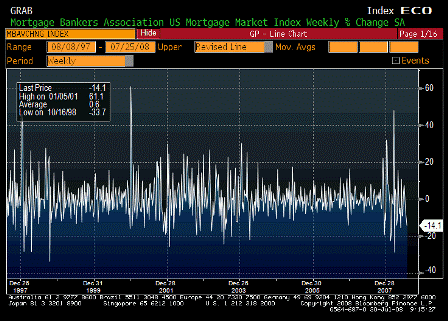
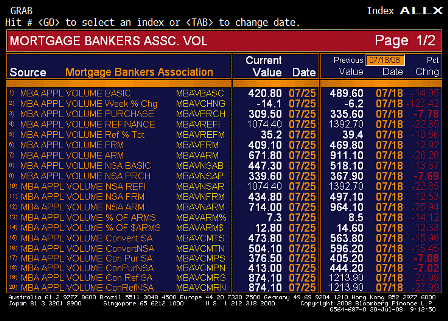
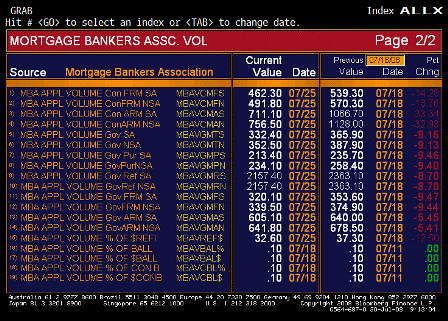
MBA Mortgage Applications (Jul 25)

Survey n/a
Actual -14.1%
Prior -6.2%
Revised n/a

Softening.

[top][end]

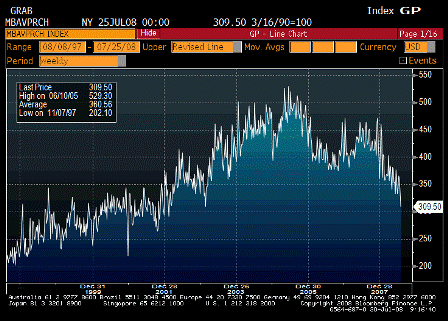
MBA Purchasing Index (Jul 25)

Survey n/a
Actual 309.5
Prior 335.6
Revised n/a

Now drifting lower,

Partially because banks are taking market share as mortgage bankers find it more difficult to sell in the secondary market.

[top][end]

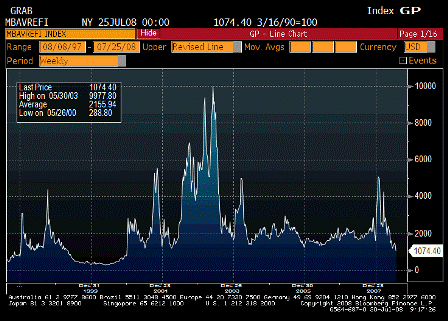
MBA Refinancing Index (Jul 25)

Survey n/a
Actual 1074.4
Prior 1392.7
Revised n/a

[top][end]

MBA ALLX 1 (Jul 25)

[top][end]

MBA ALLX 2 (Jul 25)

[top][end]


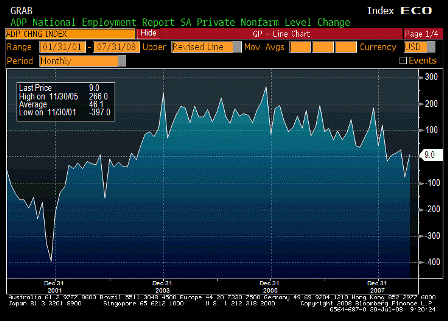
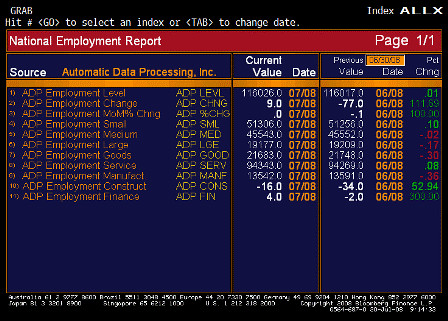
ADP Employment Change (Jul)

Survey -60K
Actual 9K
Prior -79K
Revised -77K

Surprise to the upside.

If this happens with Friday’s payroll number markets will be even further confused.

[top][end]


ADP ALLX (Jul)


[top]
2008-07-29 US Economic Releases


[Skip to the end]

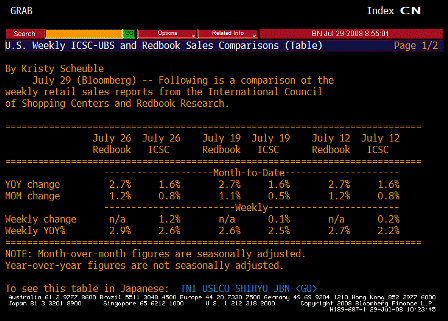
ICSC-UBS Store Sales WoW (Jul 29)

Survey n/a
Actual 1.2%
Prior 0.1%
Revised n/a

[top][end]

ICSC-UBS Store Sales YoY (Jul 29)

Survey n/a
Actual 2.6%
Prior 2.5%
Revised n/a

Still inching higher.

[top][end]

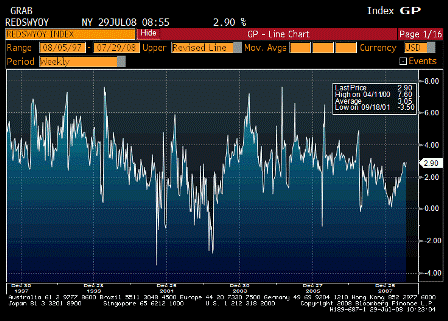
Redbook Store Sales Weekly YoY (Jul 29)

Survey n/a
Actual 2.9%
Prior 2.6%
Revised n/a

No let up here yet either.

[top][end]

ICSC-UBS Redbook Comparison TABLE (Jul 29)

[top][end]


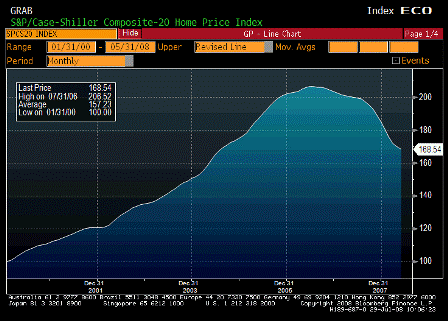
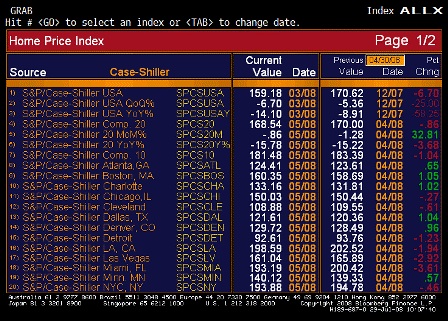
S&P-Case Shiller Home Price Index (May)

Survey n/a
Actual 168.54
Prior 169.85
Revised 170.00

[top][end]

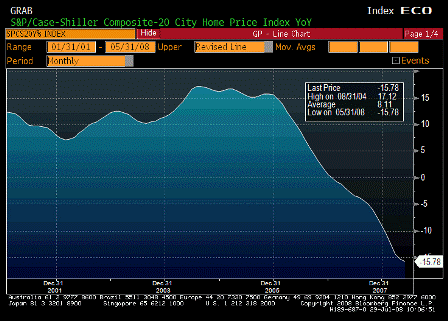
S&P-CS Composite-20 YoY (May)

Survey -16.00%
Actual -15.78%
Prior -15.30%
Revised -15.22%

[top][end]

Case Shiller ALLX 1 (May)

[top][end]

Case Shiller ALLX 2 (May)

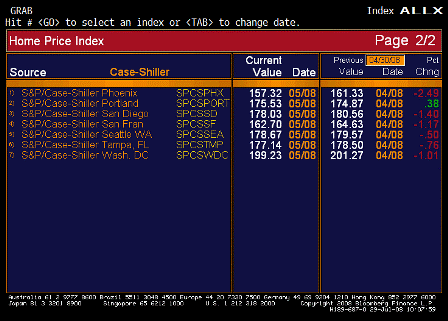
Still declining but the rate of decline is quickly diminishing,

In line with other housing indicators that are appear to have bottomed.

[top][end]


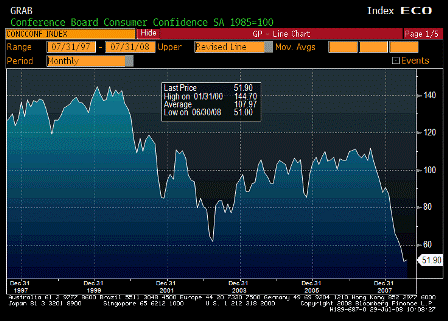
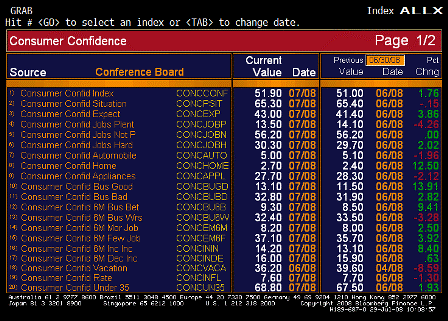
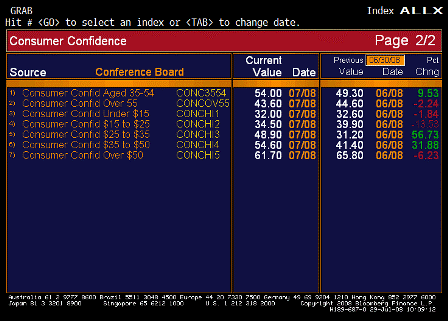
Consumer Confidence (Jul)

Survey 50.1
Actual 51.9
Prior 50.4
Revised 51.0

[top][end]

Consumer Confidence ALLX 1 (Jul)

[top][end]

Consumer Confidence ALLX 2 (Jul)

Survey
Actual
Prior
Revised

Karim writes:

  • Headline confidence rises from 51 to 51.9 (first gain since Dec)
  • Jobs Plentiful less jobs hard to get falls from -15.6 to -16.8 (new cycle low); with initial claims back above 400k now, payrolls on Friday have downside risk to -75k consensus. As important, increasing jobs hard to get is correlated to increasing duration of unemployment.
  • Plans to buy an auto fall to new cycle low of 5.0 from 5.1
  • Plans to buy a home increases from cycle low of 2.4 to 2.7
  • Plans to buy a major appliance fall to new cycle low of 27.7 from 28.3

[top][end]


ABC Consumer Confidence (Jul 27)

Survey
Actual
Prior -41
Revised

[top][end]

ABC Consumer Confidence ALLX (Jul 27)


[top]

2008-07-25 US Economic Releases


[Skip to the end]


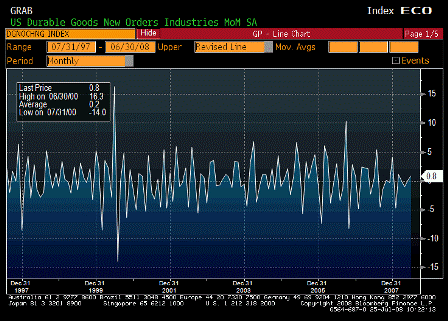
Durable Goods Orders MoM (Jun)

Survey -0.3%
Actual 0.8%
Prior 0.0%
Revised 0.1%

Better than expected, partially because fiscal and government is kicking in harder than expected.

[top][end]

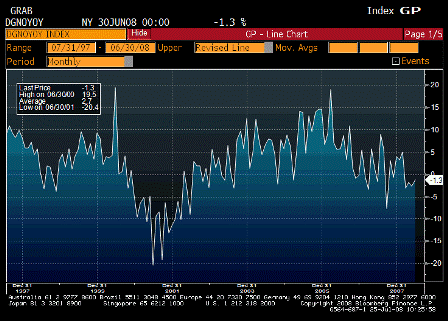
Durable Goods Orders YoY (Jun)

Survey n/a
Actual -1.3%
Prior -2.7%
Revised n/a

Still has turned up in a meaningful way, but moving away from recession levels.

When car sales normalize we’ll see a further boost.

[top][end]

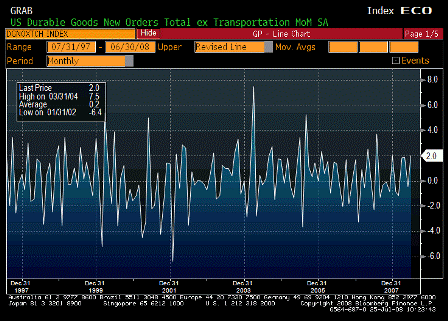
Durables Ex Transportation (Jun)

Survey -0.2%
Actual 2.0%
Prior -0.8%
Revised -0.5%

Headline numbers being held down by car sales.

[top][end]

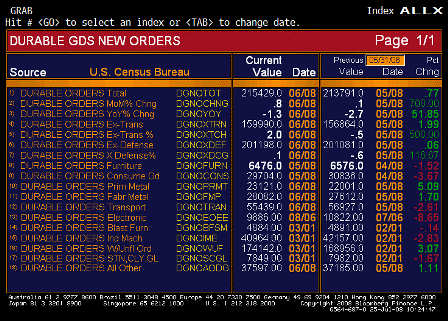
Durable Goods Orders ALLX (Jun)

Durables better than expected, likely due to companies taking advantage of new accelerated depreciation allowance

  • Capital goods orders ex-defense and aircraft up 1.4%
  • Defense orders up 30% in past 2mths, so production/shipments likely to improve for some manufacturers in coming months
  • Small appliances up as well. Seems some rebate checks went for down payments on appliances and home improvements.

    Electronics and consumer goods down.

    [top][end]


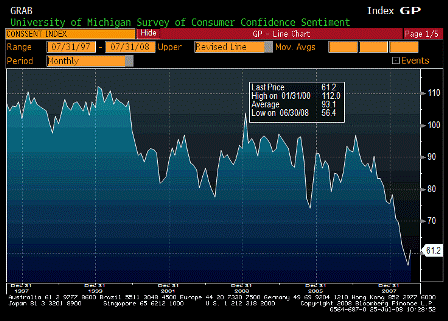
    U of Michigan Confidence (Jul F)

    Survey 56.4
    Actual 61.2
    Prior 56.6
    Revised n/a

    Better than expected and a possible bottom from a very low level.

    [top][end]

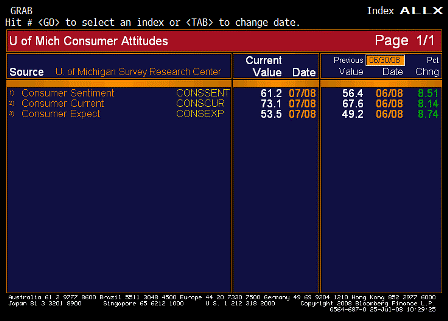
    U of Michigan Confidence ALLX (Jul F)

    Gas prices ‘stabilizing’ likely lead to the modest improvement in the Michigan survey and the ebbing of inflation expectations:

    • Headline confidence rose from 56.6 to 61.2

    Don’t underestimate the fiscal package!

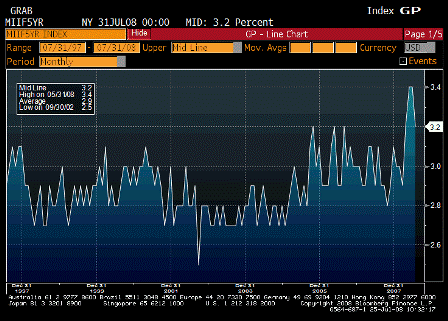
    • 5-10yr inflation expectations fell from 3.4% to 3.2%

    One year steady at 5.1%.

    [top][end]

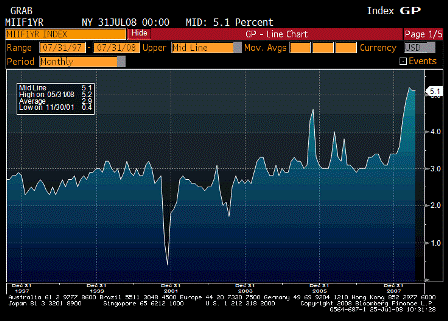
    Inflation Expectations 1yr Forward (Jul F)

    Survey n/a
    Actual 5.1%
    Prior 5.1%
    Revised n/a

    Two months over 5% is very troubling for the Fed. They see this as a direct cause of inflation.

    [top][end]

    Inflation Expectations 5yr Forward (Jul F)

    Survey n/a
    Actual 3.2%
    Prior 3.4%
    Revised n/a

    Down some but still way too high.

    The Fed wants this back to their long term target of something under 2.5%.

    [top][end]


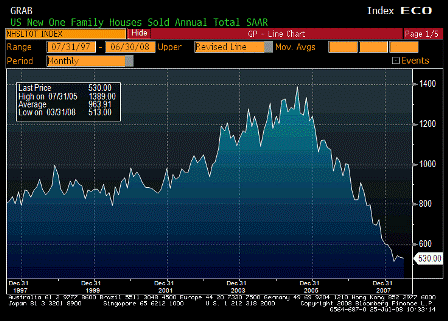
    New Home Sales (Jun)

    Survey 503K
    Actual 530K
    Prior 512K
    Revised 533K

    Better than expected and last month revised up as well.

    [top][end]

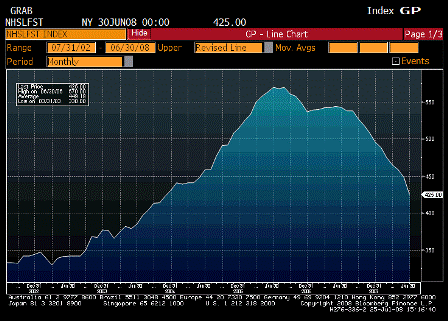
    New Home Sales – Total for Sale (Jun)

    Survey n/a
    Actual 425K
    Prior 448K
    Revised n/a

    Sales can quickly be stifled by dwindling actual inventories.

    [top][end]

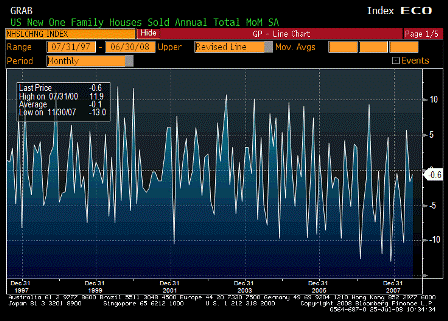
    New Home Sales MoM (Jun)

    Survey -1.8%
    Actual -0.6%
    Prior -2.5%
    Revised -1.7%

    Better than expected and from an upwardly revised May number.

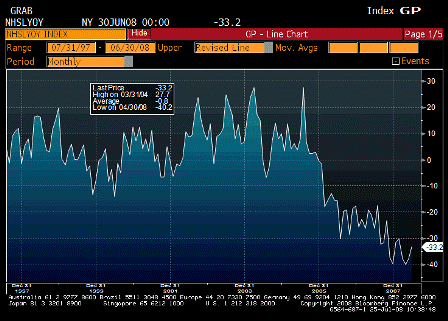
    [top][end]

    New Home Sales YoY (Jun)

    Survey n/a
    Actual -33.2%
    Prior -37.8%
    Revised n/a

    [top][end]

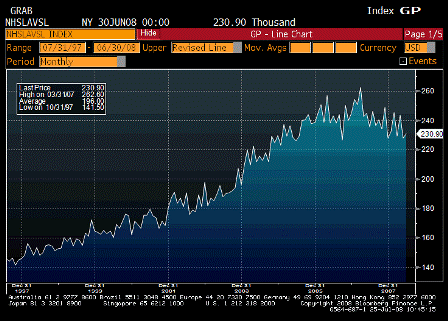
    New Home Sales Median Price (Jun)

    Survey n/a
    Actual 230.9
    Prior 227.7
    Revised n/a

    The decline may be about over.

    Median prices are already rising from the lows.

    Watch for a shortage of new homes.

    [top][end]

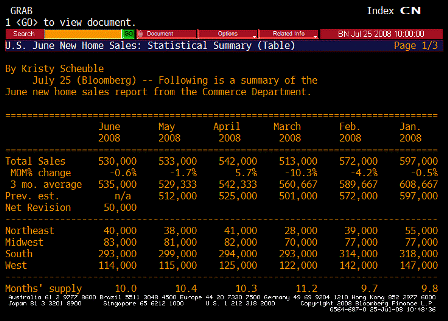
    New Home Sales TABLE 1 (Jun)

    The three month average has turned higher.

    [top][end]

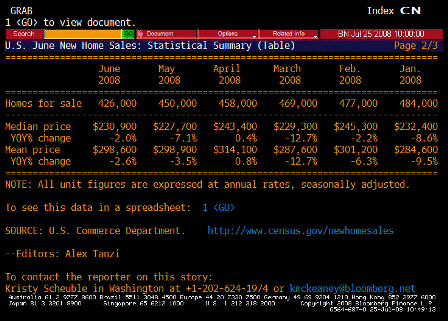
    New Home Sales TABLE 2 (Jun)

    • New home sales down 0.6% m/m and prices down 2% y/y

    But higher than expected at 530,000, and down from May because May was revised up to 533,000 from 512,000.

    Also, inventories down and prices up, and prices getting very close to being up year over year:

    New home sales fall but stronger than expected

    by Mark Felsenthal

    Sales of newly constructed U.S. single-family homes were stronger than expected in June, falling 0.6 percent to a 530,000 annual pace, a government report showed on Friday, providing a glimmer of hope for the beaten-down housing market.

    Economists polled by Reuters were expecting sales to slow to a 500,000 seasonally adjusted annual sales rate from a previously reported 512,000 pace in May. May’s sales rate was revised up to 533,000, the Commerce Department said.

    The inventory of homes available for sale shrank 5.3 percent to 426,000, the lowest since December 2004. The June sales pace put the supply of homes available for sale at 10 months’ worth.

    The median sales price rose to $230,900 from $227,700 from May, but was down 2 percent from a year earlier, the government said.


    [top]
2008-07-24 US Economic Releases


[Skip to the end]

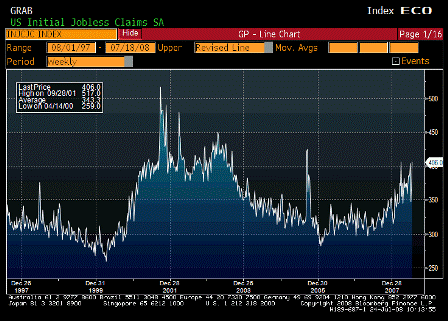
Initial Jobless Claims (Jul 19)

Survey 380K
Actual 406K
Prior 366K
Revised 372K

4 week moving average up a few thousand and drifting higher.

[top][end]

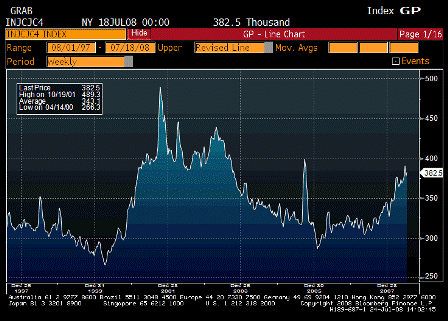
Initial Jobless Claims – 4 Week Moving Average (Jul 18)

Survey n/a
Actual 382.5
Prior 378.0
Revised n/a

[top][end]

Continuing Jobless Claims (Jul 12)

Survey 3160K
Actual 3107K
Prior 3122K
Revised 3116K

But these are now coming down some.

[top][end]


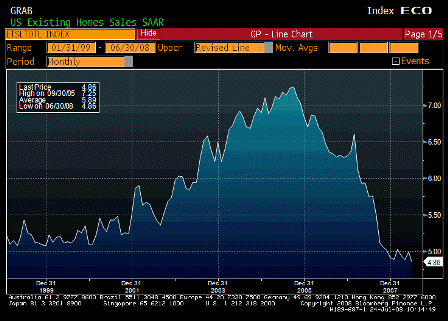
Existing Home Sales (Jun)

Survey 4.94M
Actual 4.86M
Prior 4.99M
Revised n/a

Less than expected, and bumping along the bottom as foreclosures dominate.

[top][end]

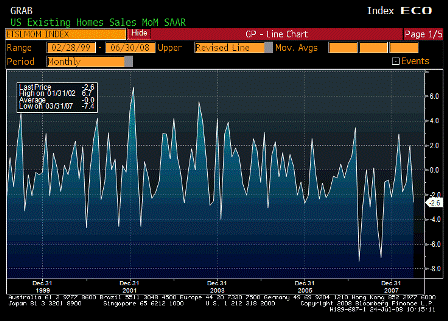
Existing Home Sales MoM (Jun)

Survey -1.0%
Actual -2.6%
Prior 2.0%
Revised n/a

[top][end]

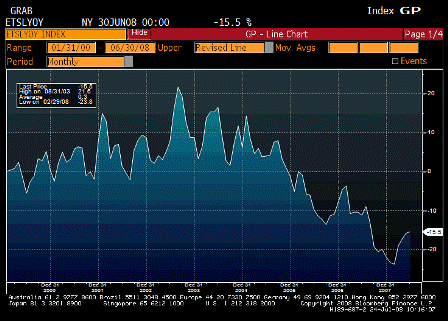
Existing Home Sales YoY (Jun)

Survey n/a
Actual -15.9%
Prior -17.5%
Revised n/a

Still falling but not quite as fast.

[top][end]

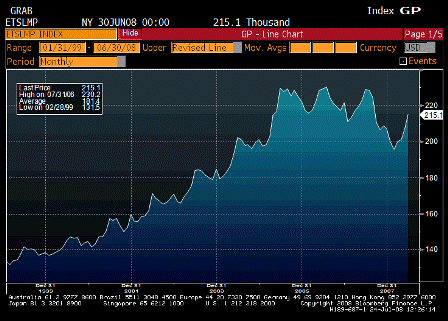
Existing Home Sales – Median Price (Jun)

Survey n/a
Actual 215.1
Prior 207.9
Revised n/a

[top][end]

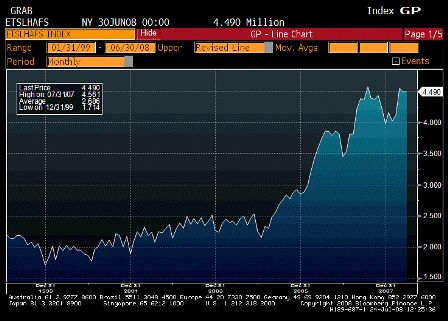
Existing Home Sales – Inventory (Jun)

Survey n/a
Actual 4.490
Prior 4.482
Revised n/a

Foreclosers addind to inventories.

[top][end]

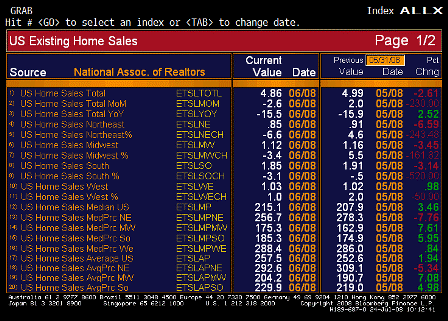
Existing Home Sales ALLX (Jun)

Median prices up in all regions.

[top][end]

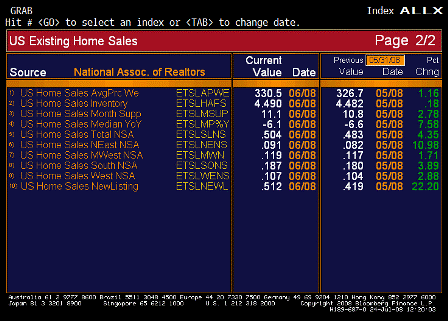
Existing Home Sales ALLX cont (Jun)


[top]