Payrolls, Factory orders, Foreign trade, Retailers, Boston rents

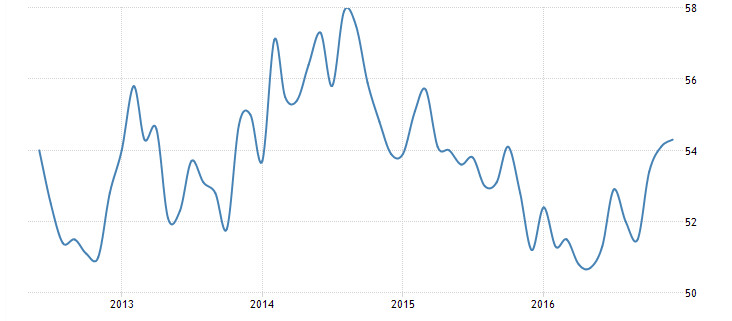
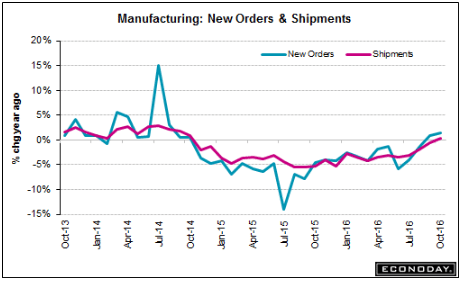
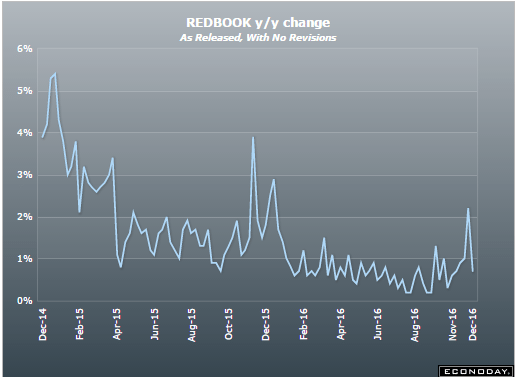
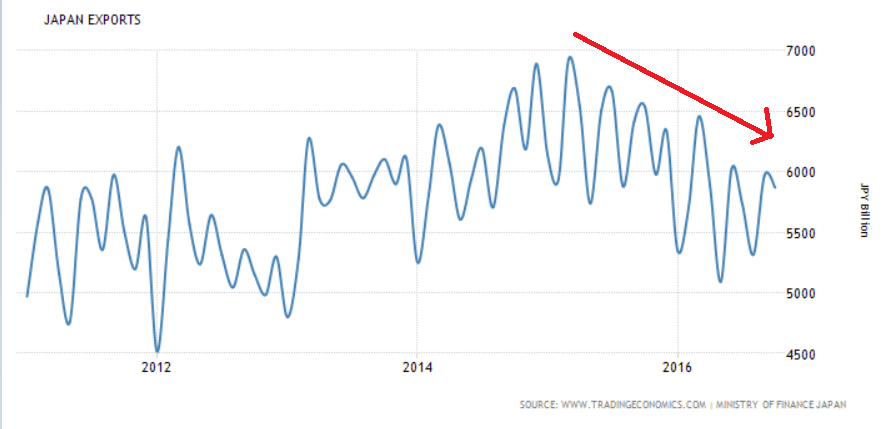
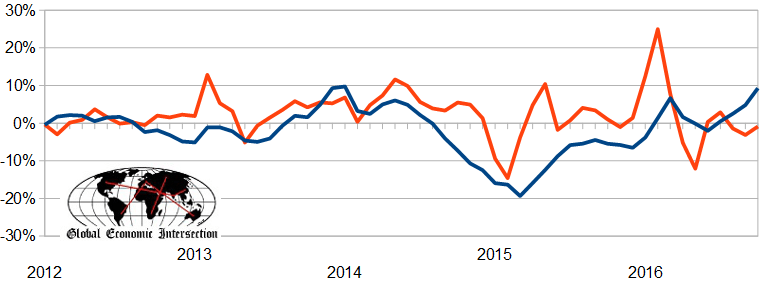
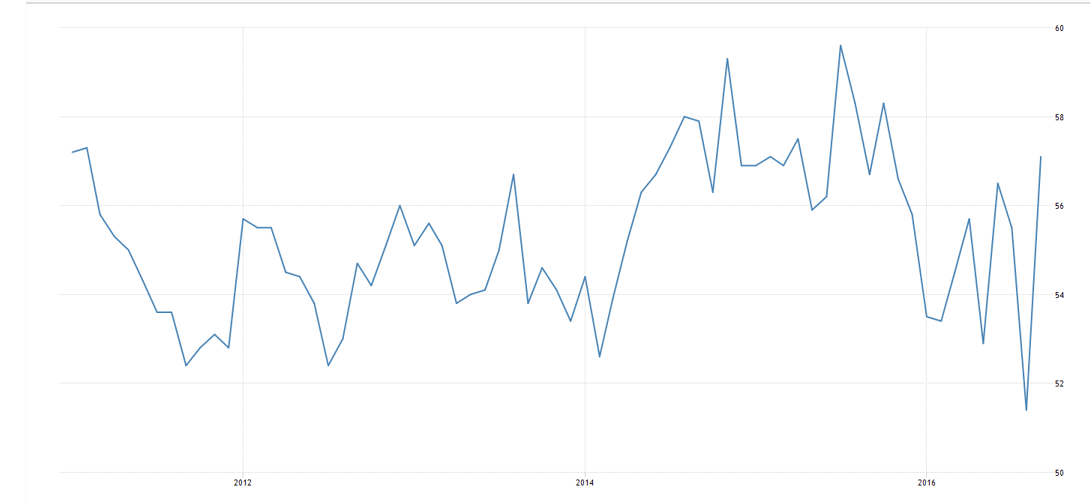
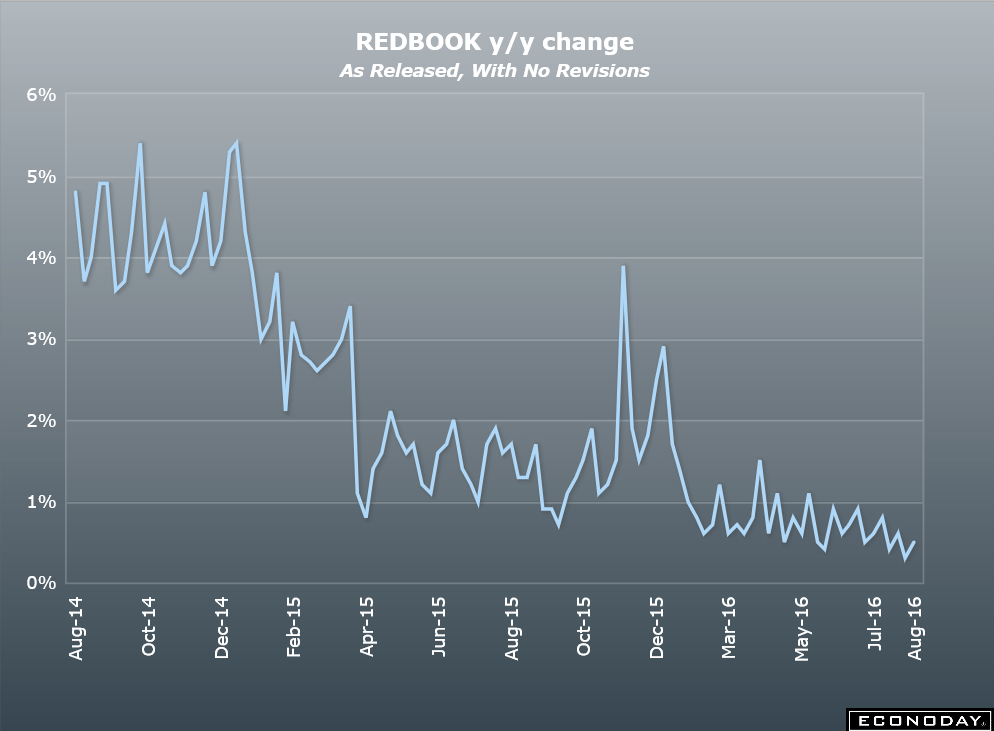
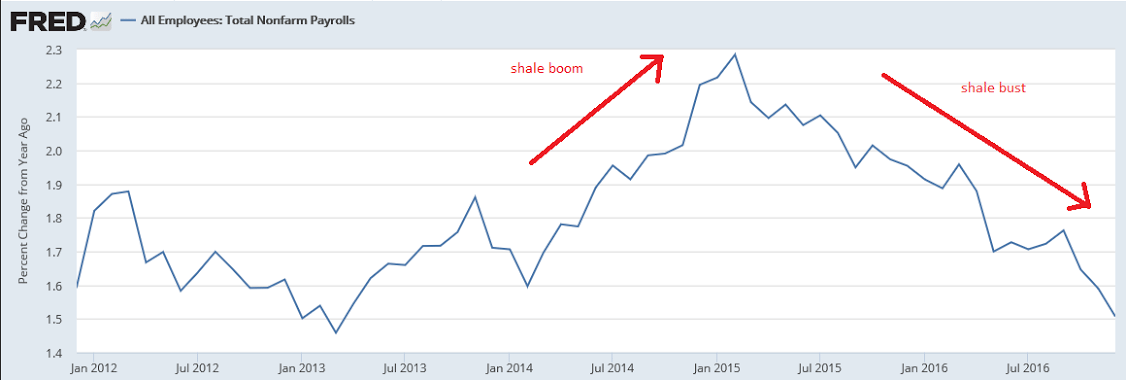
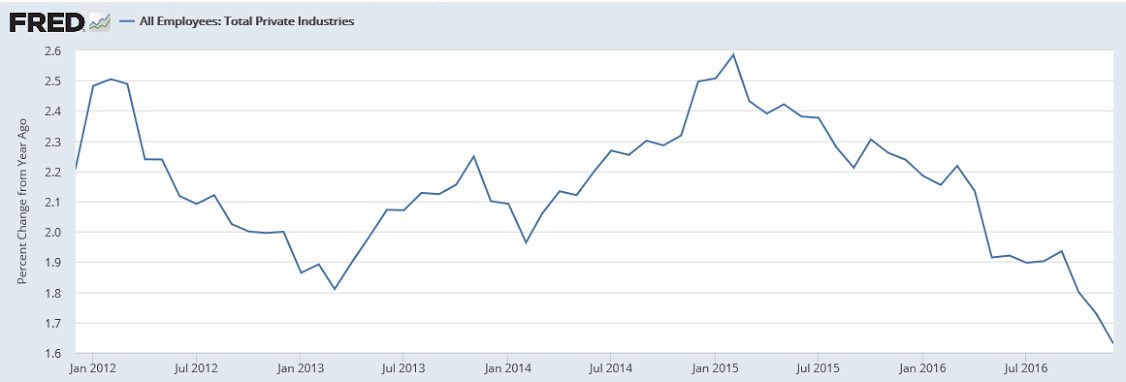
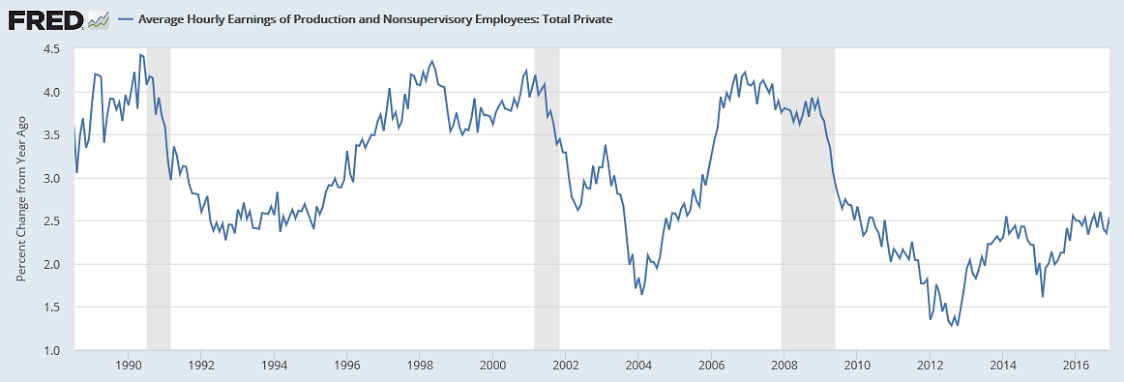
The year over year chart continues its 2 year deceleration unabated. No telling where it ends but the end will coincide with increased deficit spending, private or public:

10601

Highlights

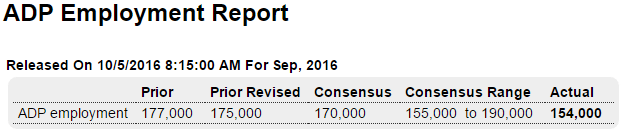
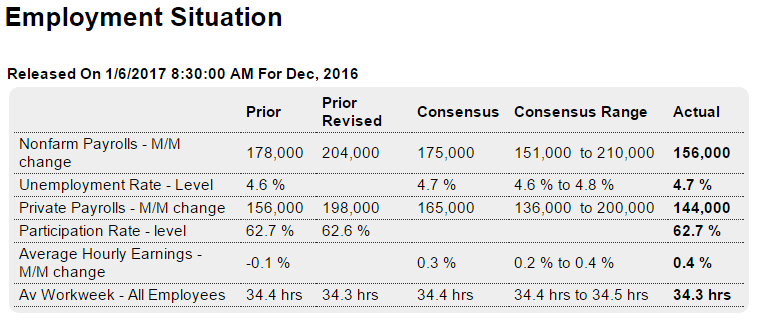
Job growth may be the new economic policy but wage inflation may be the risk. Nonfarm payrolls rose a lower-than-expected 156,000 in December but, in an offset, revisions added a net 19,000 to the two prior months (November now at 204,000 and October at 135,000).

But the big story is another outsized 0.4 percent rise in average hourly earnings, the second such gain in three months. The year-on-year rate is now at 2.9 percent which is a cycle high. A 3 percent rate and above is widely seen as feeding overall inflation.

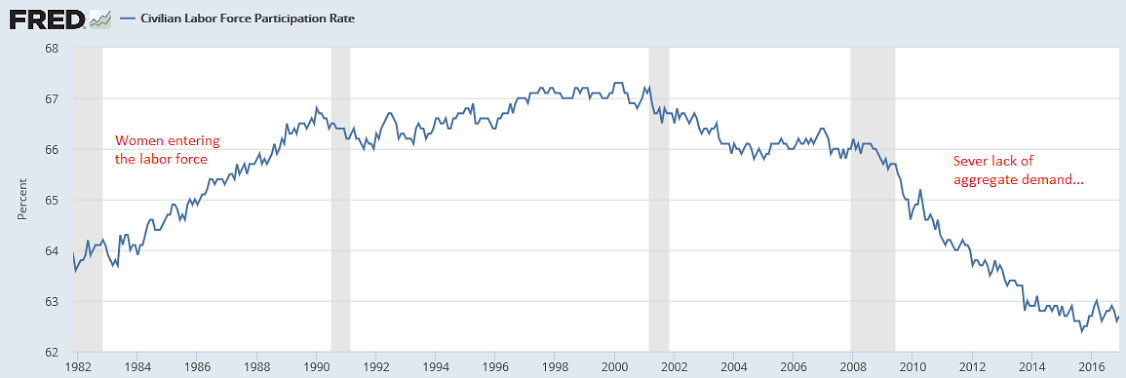
The unemployment rate is very low though it did tick up 1 tenth to 4.7 percent. Keeping the rate down is low labor participation, at 62.7 percent with the prior month revised down 1 tenth to 62.6 percent.

Sector payrolls show another sizable gain for trade & transportation, up 24,000, and a rare gain for manufacturing, up 17,000. Government added 12,000 jobs while a 15,000 rise for professional & business services is not only on the low side for this reading but includes a 16,000 decline in temporary help, a subcomponent that is especially sensitive to changes in labor demand.

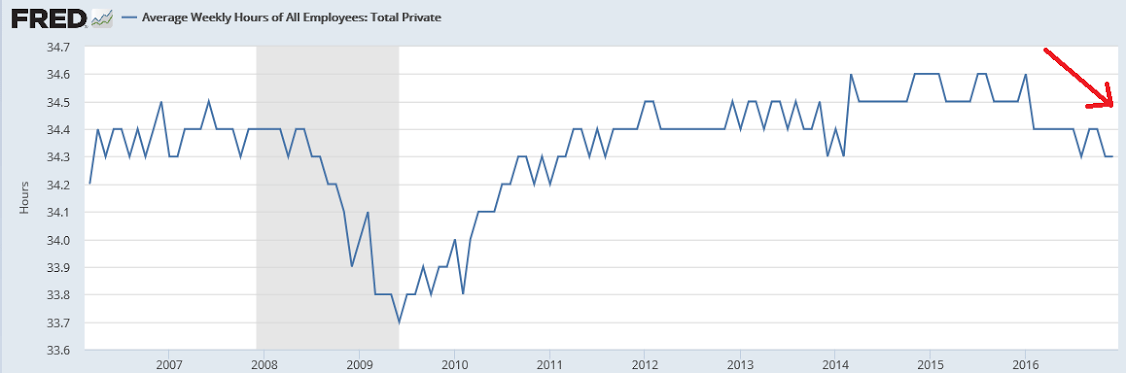
There are hints of slowing job growth in this report but the wage pressure underscores the Federal Reserve’s expectations for three rate hikes during the year and raises the question whether the labor market, even before new stimulus under the incoming administration, is at an inflationary flashpoint. Other details include a lower-than-expected workweek, at 34.3 hours in December which is unchanged from a downwardly revised November.

10602

10603
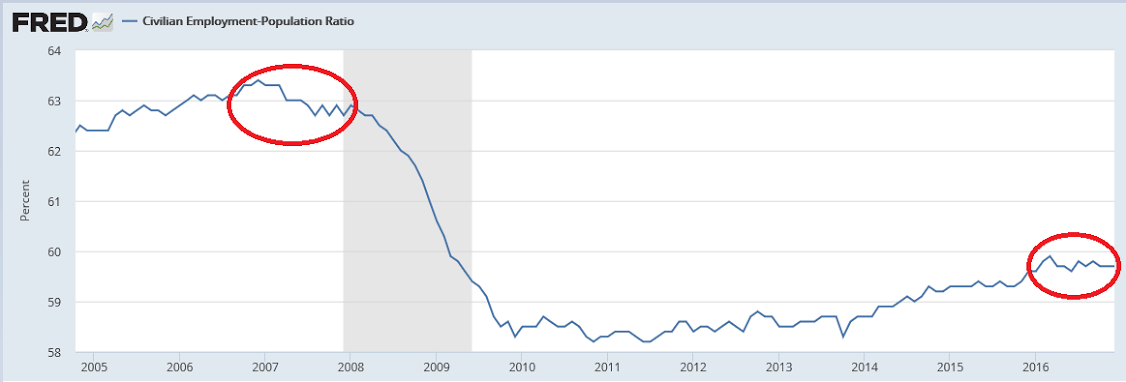
Jobs no longer exceeding up with population growth:

10604
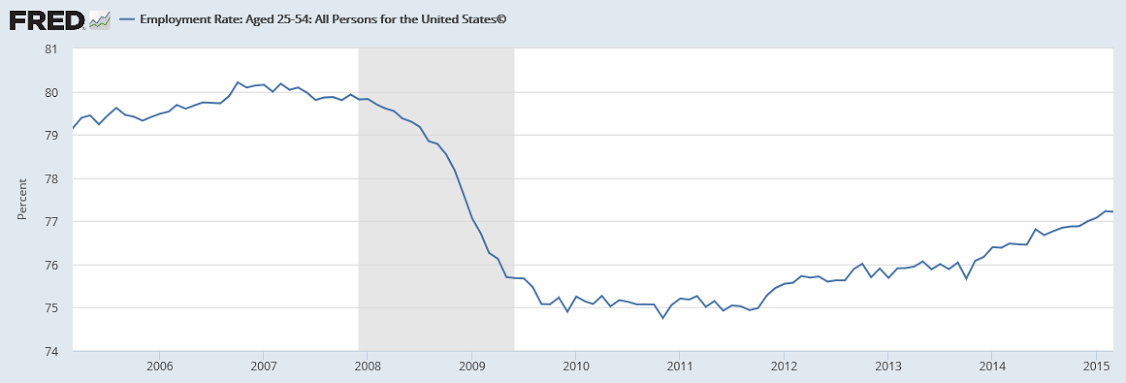
Fewer ‘demographic’ effects here, though the average age of this group has gone up some over time:

10605

10606
You can see that historically wage growth remains depressed, and in any case increased wages are more likely to reduce gross profit margins than to increases consumer prices:

10607
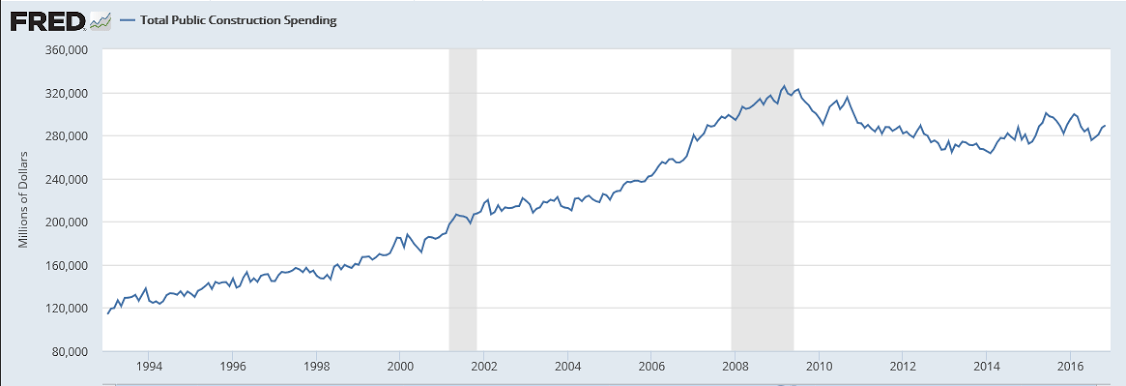
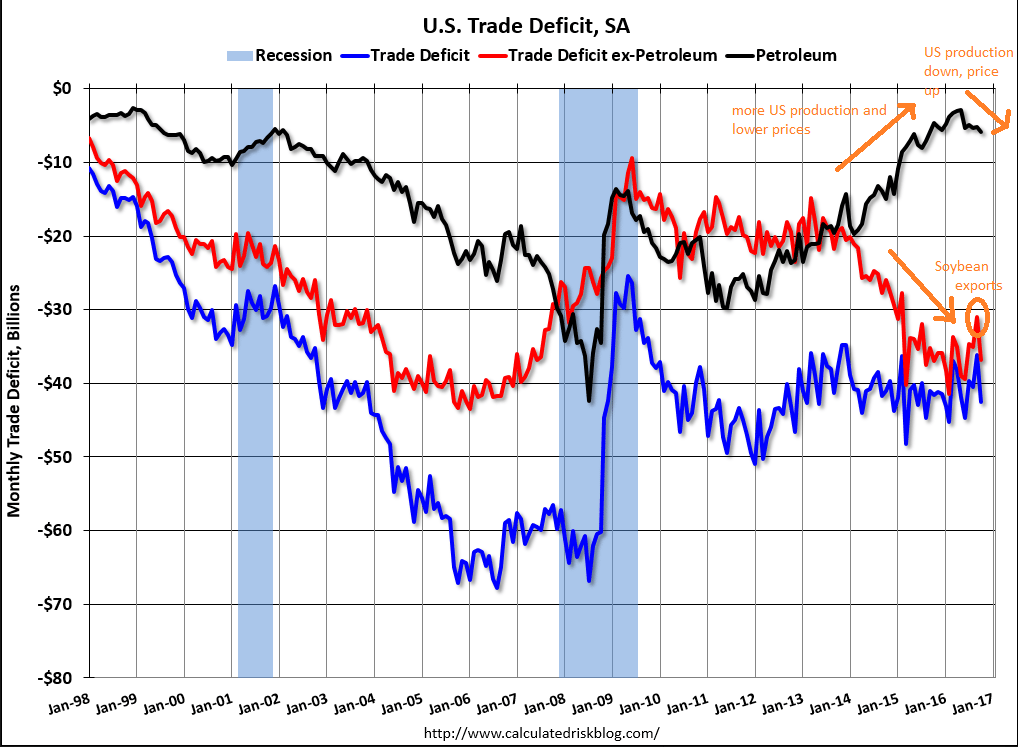
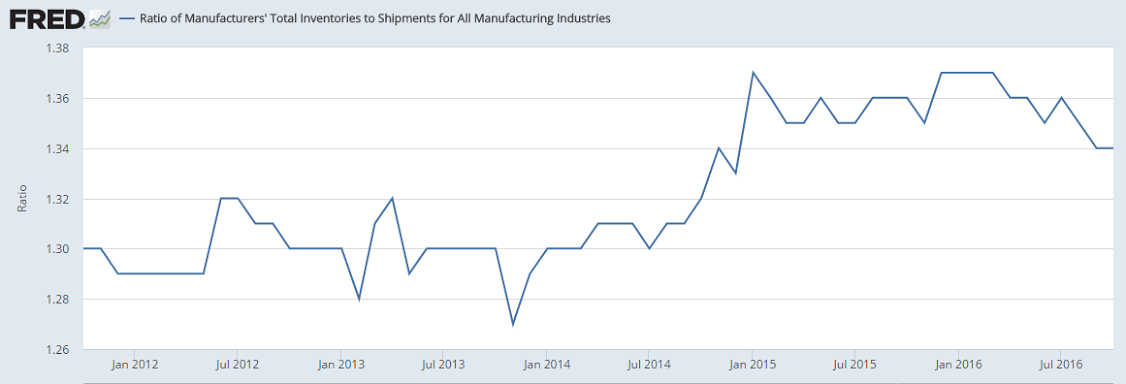
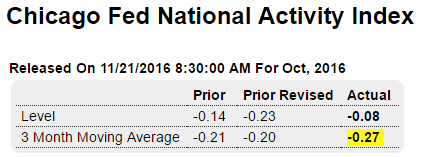
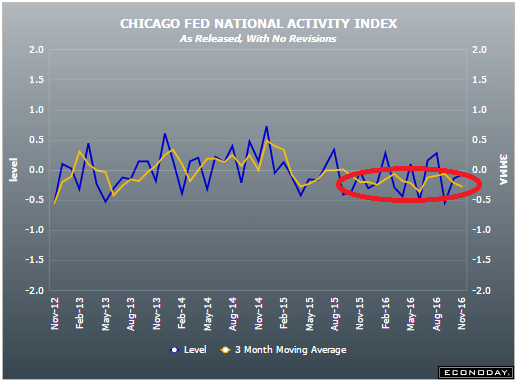
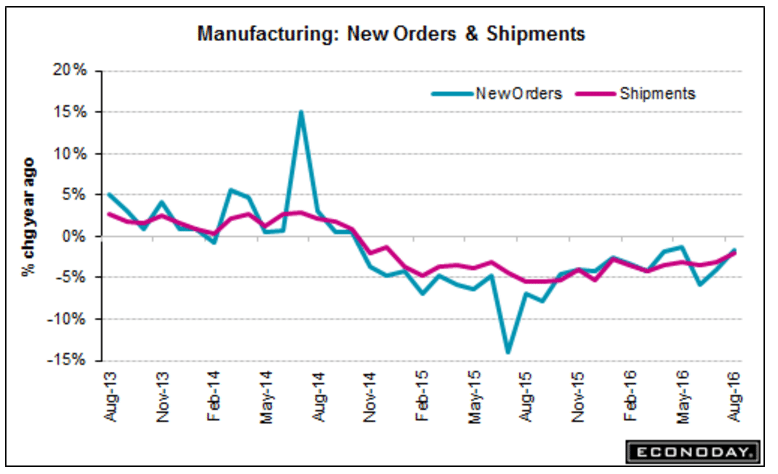
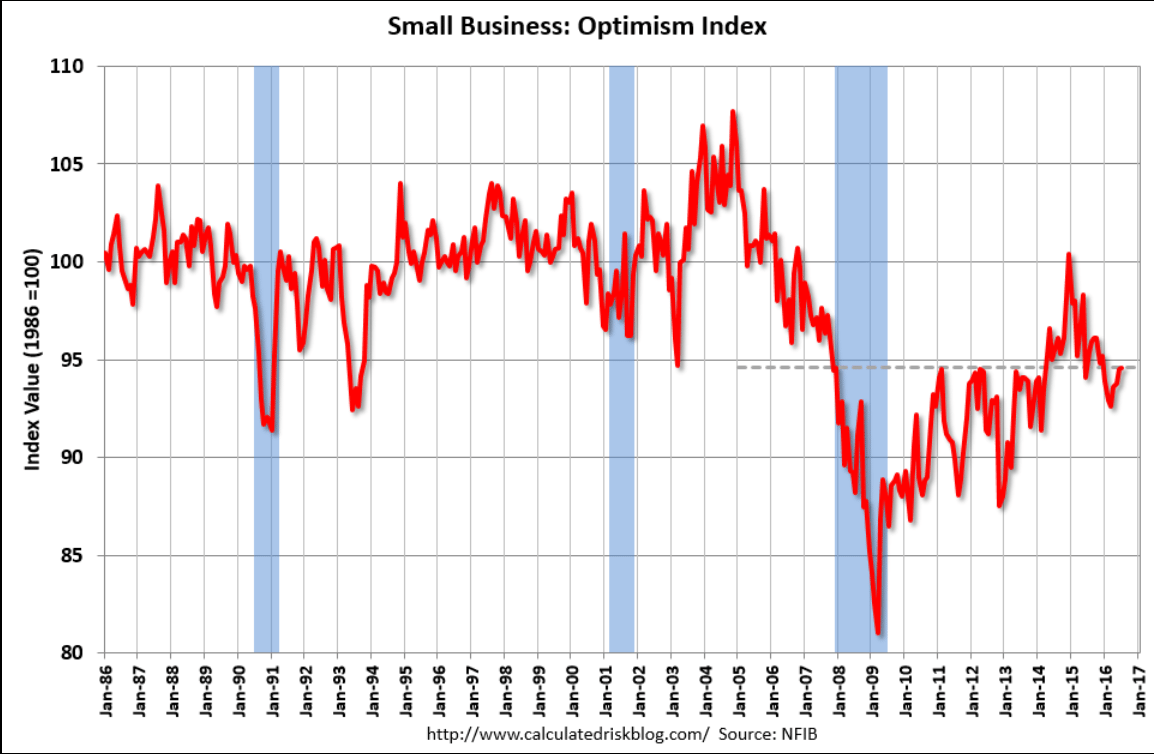
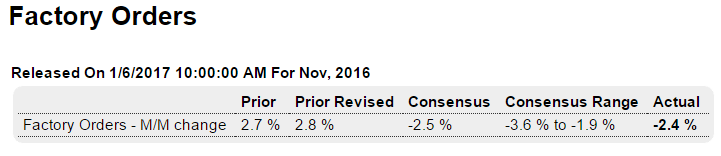
Decelerating back to recession levels:

10608

10609
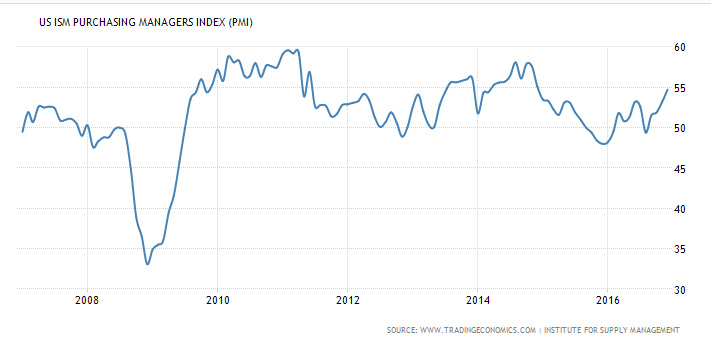
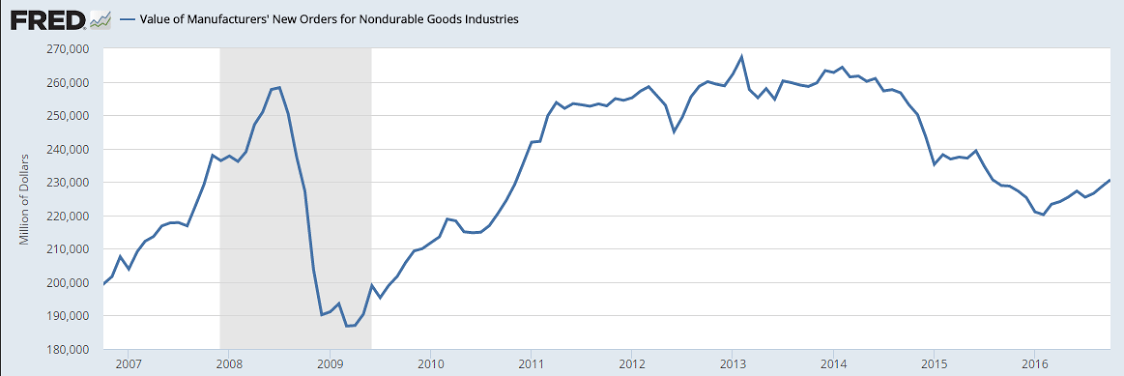
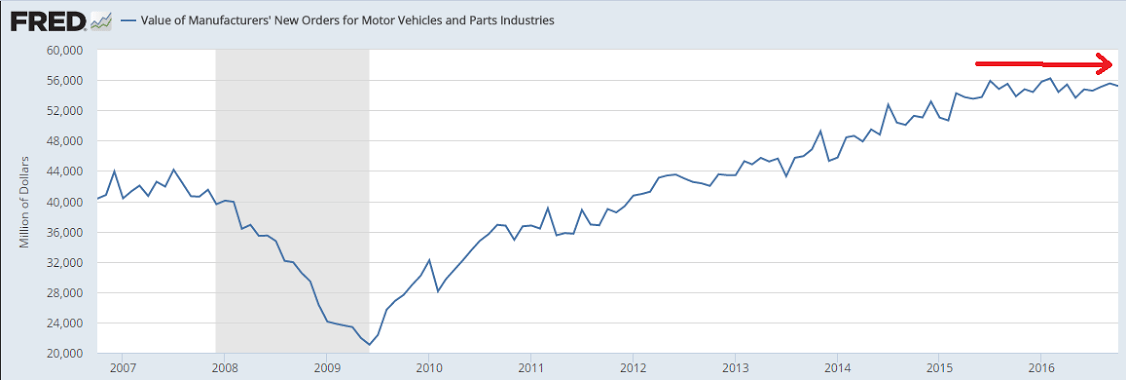
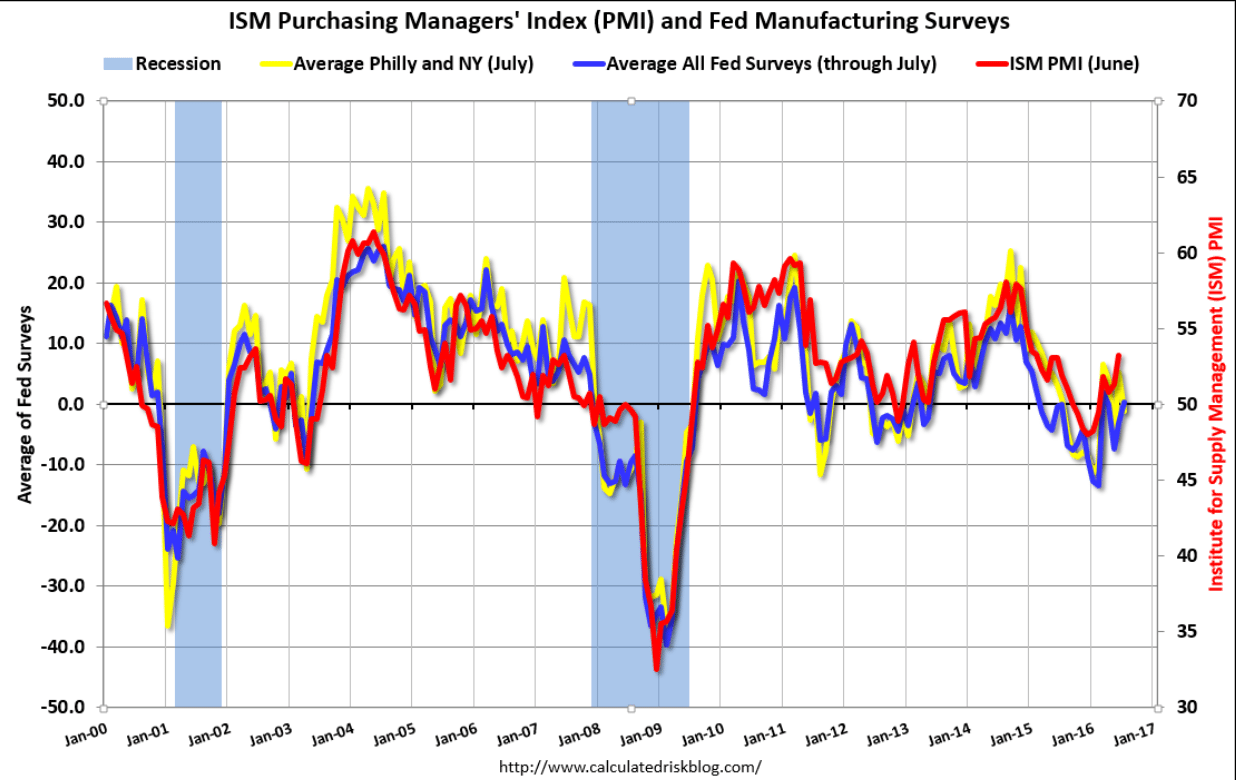
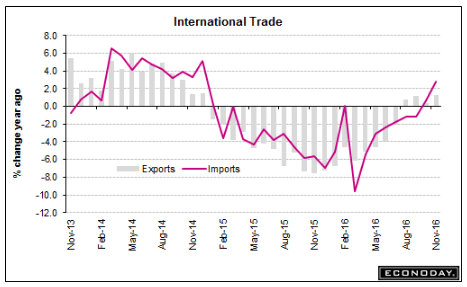
And, as previously discussed, I expect this get a lot more negative:
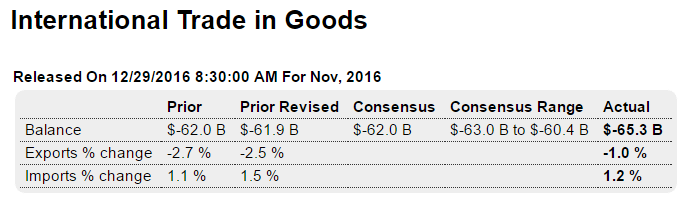
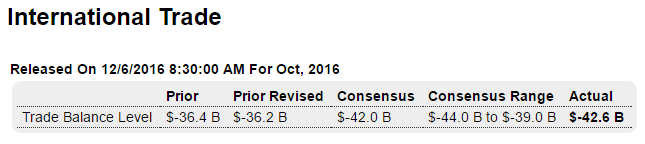
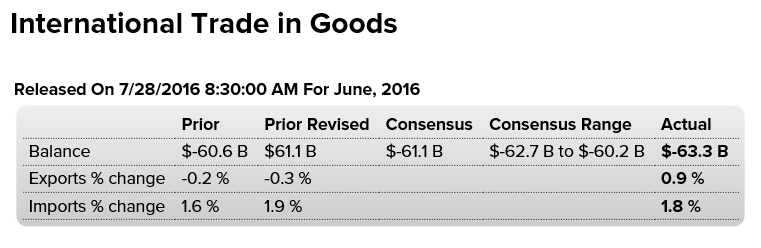
10610

Highlights

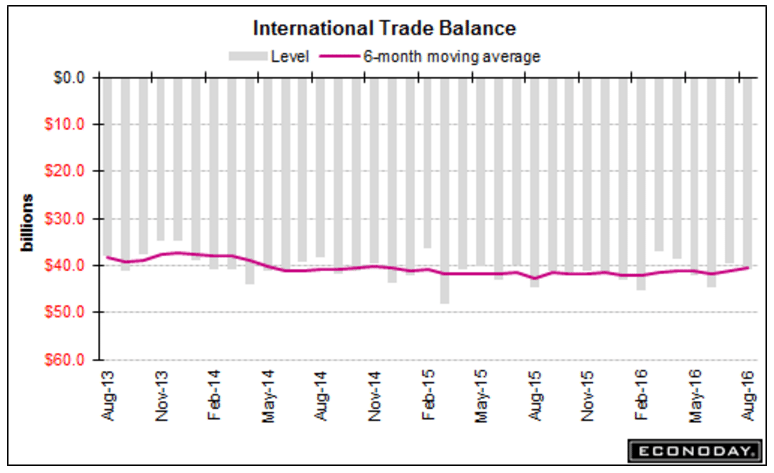
The nation’s trade deficit widened sharply in November, to a higher-than-expected $45.2 billion and well up from a revised deficit of $42.4 billion in October. Exports fell 0.2 percent in November while imports rose 1.1 percent.

The import side shows a significant rise in oil imports, up nearly $1 billion in the month to $9.9 billion (reflecting both an increase in volume and price). Petroleum is a key element for industrial supplies where imports rose $2.3 billion. Other readings are little changed with capital goods imports ticking lower and underscoring the nation’s lack of investment in new equipment.

And capital goods lead the downtick in exports, down $1.8 billion to underscore the lack of global investment in new equipment. Exports of civilian aircraft, which are a subcomponent of capital goods, fell $1.3 billion in the month. Exports of cars and of food products also moved lower, offset by a petroleum-related rise in industrial supplies.

By country, the deficits with Canada (-$2.6 billion) and the EU (-$14.8 billion) both widened sharply while the deficits with China (-$30.5 billion) and Mexico (-$5.8 billion) both narrowed. The deficit with Japan (-$5.9 billion) was little changed.

Today’s report represents a downgrade for fourth-quarter GDP which more and more will depend on how strong consumer spending was during the holidays. Watch next Friday for the retail sales report and the first definitive indication on December consumer spending.

10611

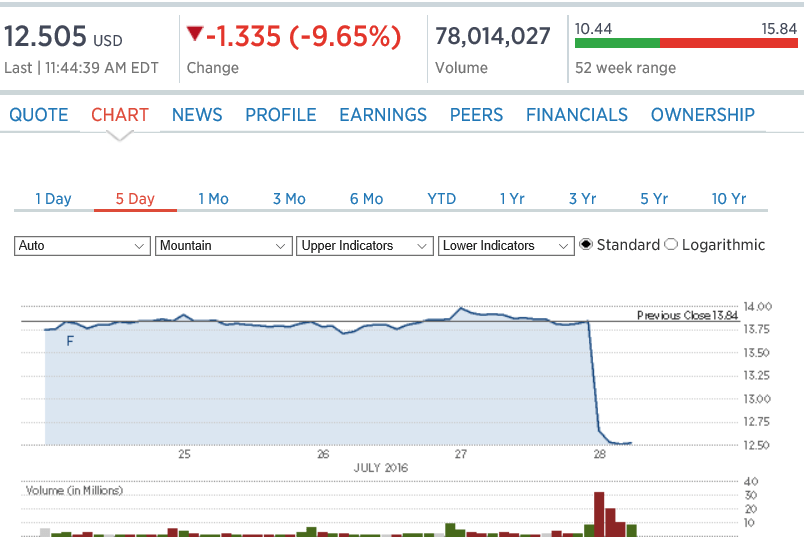
Retail sector tanks as Macy’s and Kohl’s get crushed by weak holiday sales

By Fred Imbert

Jan 5 (CNBC) – Average Boston-area rent falls for the first time in almost 7 years

Construction spending, Manufacturing surveys, China

A bit of a bump up going into year end. Could be about expiring tax breaks as has happened in prior years:

10301

Highlights

Construction had been lagging through most of 2016 but, like the factory sector, appears to have picked up steam going into year-end. Spending rose 0.9 percent in November which just tops Econoday’s high estimate and is the best reading since June.

Residential spending rose 1.0 percent in the month on top of October’s 1.6 percent gain. The gain here is concentrated in single-family homes which offset a monthly dip for multi-family units which otherwise have been leading the residential sector. Home improvements added to the spending in November.

Non-residential spending was also strong, up 0.9 percent which most categories showing gains led by office construction and transportation construction. Public spending was also solid including a 3.1 percent monthly jump in Federal spending.

The breadth of gains is most impressive in this report, one that will give a lift to fourth-quarter GDP estimates.

These numbers aren’t inflation adjusted, so in real terms spending is still far below what it was. And during this cycle construction spending grew at a slow pace than prior cycles and seems to have flattened out:

10302

10303

10304
Public construction spending for all practical purposes has been flat nominally, and down when adjusted for inflation:

10305
Manufacturing surveys have stabilized at modest levels of growth as previously discussed, and possibly reflecting some post election euphoria:

Market PMI:

10306
ISM manufacturing

10307

Growth in China’s factories, services slows in December: official PMI

Dec 31 (Reuters) — The official PMI stood at 51.4 in December compared with 51.7 in November. Factory output slowed in December, with the sub-index hitting 53.3 compared with 53.9 the previous month. Total new orders were flat at 53.2, logging the same as in November, while new export orders fell to 50.1 from 50.3. Jobs were again lost, with the employment sub-index sitting at 48.9, compared to 49.2 in November. A sub-index for smaller firms fell, and performance for larger companies also worsened. The official non-manufacturing Purchasing Managers’ Index (PMI) stood at 54.5 in December, down from 54.7 in November.

China Caixin manufacturing PMI climbs to 51.9 in December, fastest improvement since January 2013

Jan 2 (CNBC) — In December, the Caixin PMI reading came in at 51.9, up from November’s 50.9. “A further rise in production at Chinese manufacturers supported the higher PMI reading in December. Notably, the rate of output growth accelerated to a 71-month high, with a number of panelists commenting on stronger underlying demand and new client wins,” the Caixin data statement said. “Data indicated that improved domestic demand was the key driver of new business growth, however, as new export sales were unchanged in December.”

Trade, Inventories, Proposals before Congress

As previously discussed, exports are falling and imports climbing, with lots more to go:

122901

Highlights

Trade looks to be a major negative that will be holding down fourth-quarter GDP. The advance trade deficit in goods widened sharply for a second straight month in November, to $65.3 billion following a revised $61.9 billion deficit in October that was nearly $5 billion higher than the last month of the third quarter, September.

Exports have been very weak so far this fourth quarter, down 1.0 percent in November following October’s 2.5 percent shortfall. Food exports have been especially soft as have vehicle exports, and capital goods exports fell very sharply in the latest report.

Widening the gap have been sharp increases in imports, up 1.2 percent on top of October’s upward revised 1.5 percent increase. Imports of industrial supplies posted a very sharp increase in November as did food imports. Most other readings on the import side are narrowly mixed.

Slowing sales growth caused inventories to increase, which leads to production cuts, as per the cuts in automobile production previously discussed:
122902

Highlights

Wholesale inventories jumped a preliminary 0.9 percent in November following an upward revised 0.1 percent decline in October. Retail inventories also jumped, up 1.0 percent in November following an unrevised 0.4 percent decline in October. The build in wholesale inventories is split evenly between durable and nondurable goods with the build on the retail side concentrated in vehicles. The increases in this report are a surprise and, though a positive for the fourth-quarter GDP calculation and an offset to this morning’s widening in the goods trade gap, will revive talk of unwanted inventories.

All of this ties into proposed trade policies designed to reduce imports and increase exports, for the further purpose of increasing domestic output and employment:

122903

The questions begin with what this would do to the value of the $US. Mainstream theory concludes that, all else equal, the $ would appreciate to offset the price effects of the ‘border adjustments’. While I agree $ appreciation would offset the price effects, given the forces currently at work I don’t see them pushing things in that direction.

First, mainstream theory would say the current trade balances should ‘fundamentally’ be driving the dollar lower. The US has a large and growing trade deficit, while the euro zone has a large and growing trade surplus, with China also in surplus and Japan working its way back to surplus, etc.

However, while trade has been ‘fundamentally’ working against the $, portfolio shifting, a ‘technical’ force, has been going the other way. (Personally I often use the term ‘savings desires’ to indicate the various desires to hold financial assets of a particular currency.) As previously discussed, for example, the euro area had ‘capital outflows’ of over 500 billion euro over the last year or so, which means portfolio managers of all types with euro financial assets sold them and switched to financial assets denominated in other currencies, such as $US, yen, and Swiss francs (with the Swiss National Bank then selling maybe half of the euros they bought and buying $US). This would be analogous to a crop failure such as the corn crop being reduced by drought, for example. The drop in supply would be a force that would put upward pressure on the price of corn. However, is a company with a very large warehouse full of corn decided to sell it, that selling could dominate and drive the price lower, until the warehouse was empty. Only at that point would the effects of the crop failure dominate, and then drive the price higher.

So technicals (portfolio shifting) can overwhelm fundamentals (trade balances) for long periods of time until the technical force has run its course, and the warehouse is either empty or as low as the portfolio manager wants it to be. In fact, this time around, while the trade flows were presumed to reduce the US trade deficit via lower prices for imported oil, and therefore be supportive of the $, it didn’t work out that way, however, as lower oil prices were partially ‘offset’ by reductions of global income from the lower oil prices, which reduced US exports, and increasing US consumer related imports.

Second, I’m not comfortable with the idea that US export prices will go down if the revenues are no longer taxed. Prices in this case are ‘world prices’ and to the extent the US exporters are ‘price takers’ I don’t see how a lower cost of goods will necessarily result in a drop in global prices any more than, for example, reducing income taxes on oil would cause the price of oil to fall. Yes, longer term, lower costs might bring out more supply, but that’s a different and much longer term story.

Nor do I see the quantities of US exports going up even if the proposed border tax policy results in a reduction in the price of US exports, given the general weakness of global demand. And more specifically, who would buy more US exports if prices were maybe 15% lower, for example? China? Japan? India? I don’t see it.

Third, I do see US imports softening with the proposed import tax, which means an equal reduction of $ revenues to the rest of the world, which means they are likely to buy fewer US exports. This is similar to what happened when the price of oil fell, and the US spent less buying oil from the rest of the world, and that reduction of $ income reduced the demand for US exports.

This is also a strong channel for a general reduction in global aggregate demand.

Now back to the value of the $. Yes, the border tax policy could over time reduce the US trade deficit and thereby be a fundamental force that works towards $ appreciation. However, current fundamentals- the growing US trade deficits- have been and are currently working in the other direction. So what I happening would be a moderation of the fundamental trade flows that have been and are currently working to weaken the $, even as the portfolio managers- the technical forces- continue to deplete their non $ currencies and buy $. And when those currency warehouses are depleted, current trade flows will take over and drive the $ down until they reverse, with the proposed border tax policy perhaps slowing the $’s fall.

To sum up, the way I see it is the current fundamentals overwhelmingly negative for the $, with the proposed border adjustment tax policy at best a much smaller force in the other direction.

Not to mention I’m categorically against it all for more macro reasons. Imports are real benefits and exports real costs, the difference being real terms of trade, which are optimized by running as large a trade deficit as possible. And any lack of aggregate demand for domestic goods and services that results in undesired unemployment if instead best addressed by a fiscal adjustment- lower taxes or more public spending. But in a world where that understanding doesn’t exist, we get these types of highly counterproductive proposals that ultimately and necessarily make things worse.

Post script:

Seems to me it’s just a matter of time before Trump proposes the US start buying and building foreign exchange reserves to counter the strong $, which he has said many time is about ‘currency manipulation’. With the general notion that his other proposals, such as repatriation, will also have strong $ biases, seems to me it’s just a matter of time until we see fx purchases proposed?

Trade, Factory orders, Redbook retail sales, Saudi pricing, Comments on Trump tactics

Trade deficit moving back out. I expect a lot more to come this quarter and next. Oil is getting more expensive and the quantity imported is up as well. The ‘one time’ soybean export bulge is behind us, and global trade in general has slowed.

Wouldn’t surprise me if Trump responds by having the US start buying foreign currencies, which would send the dollar lower to offset ‘foreign currency manipulation’. And, of course, he’d show a ‘profit’ in fx purchases as the dollar falls:

120601

Highlights

The nation’s trade deficit widened substantially in October, to a higher-than-expected $42.6 billion and reflecting a 1.8 percent decline in exports and a 1.3 percent rise in imports. The nation’s trade deficit in goods totaled $63.4 billion offset only in part by a small rise in the trade surplus in services to $20.8 billion.

Goods exports were soft across the board including for foods/feeds/beverages (down $1.4 billion in the month) and also industrial supplies (down $1.0 billion). Exports of consumer goods fell $0.9 billion with exports of capital goods, barely in the plus column, held down by a $0.6 billion dip in civilian aircraft. The offset is services exports which at $63.3 billion is the highest on record and largely reflects global demand for the nation’s technical and managerial services.

The import side of the data show heavy U.S. buying, at a $231.3 billion total in the month which the highest since August last year. Details show a $1.1 billion increase in capital goods which is a negative for the national accounts but a positive for the nation’s productive investment. Imports of consumer goods shot up $2.4 billion ahead of the holidays.

By country, the gap with China narrowed by $1.4 billion to $31.1 billion reflecting unusually high U.S. exports to China. The gap with the EU widened to $13.1 billion, with Mexico to $6.2 billion and with Japan to $5.9 billion.

The widening trade deficit in October gets the net export component of fourth-quarter GDP on the wrong foot.

120602
As previously discussed, manufacturing is a lot smaller than the service sector, and after falling to lower levels with the collapse in oil related capital expenditures growth is resuming at the lower levels, as the lack of aggregate demand moves deeper into the service sector:

120603

Highlights

October was a very strong month for the factory sector as durable goods orders rose 2.7 percent. Aircraft (both civilian and defense) was October’s special strength, excluding which the gain in orders falls sharply but still comes in at a very solid 0.7 percent. Another plus in the report is a 3 tenths upward revision to September to plus 0.6 percent, a gain driven by an upgrade for aircraft orders in that month.

Core capital goods orders (nondefense excluding aircraft) did rise in October but not much, up only 0.2 percent and well short of offsetting a 1.5 percent decline in September. Weakness here points to trouble for business investment in the fourth-quarter GDP report. And shipments for this category have gotten off to a bad start in the quarter, down 0.1 percent in October.

But other readings are favorable including a useful 0.4 percent rise in total shipments and a 0.7 percent gain for unfilled orders which had been in long contraction. Inventories are not a problem in the sector, unchanged in the month with the stock-to-sales ratio holding at 1.34.

Advance readings on factory conditions in November have been mostly positive which, together with this report and a respectable 0.3 percent gain for the manufacturing component of the industrial production report point to year-end momentum for a sector that has otherwise had a flat 2016.

120604

120609

120610

120611

120607
Inventories still high and working their way lower:

120608
Growth falling back from the mini spike up. A ‘normal’ economy, before the collapse in oil capex, used to show 3-4% increases and more:

120606

Looks like a price cut, indicating they don’t want prices up quite this high?


*Saudi arabia cuts all Jan OSPS to US except for extra light
*Saudi Arabia raises diffs on all grades to NWEur/MED
*Saudi Jan Arab Light to Asia at -75c vs plus 45c
*Saudi cuts Jan pricing for light crudes to Asia.

The job of the executive branch, headed by the President, is to enforce the law.

And it’s perfectly legal for companies to move production, etc. to other countries.

However, the President elect is seeking to have companies that are acting legally alter their business plans by using leverage/retribution such as threatening tariffs and altering govt. contracting terms and conditions.

Unconstitutional abuse of executive power?

Wire article, Trump news, Italy

What Does Modern Money Theory Tell us About Demonetisation?

Dec 5 (The Wire) — Warren Mosler, a founder of MMT, explains the idea of “taxes drive money” using a simple example. He pulls out his visiting card in a classroom and …

Continuous flow of this stuff:
Donald Trump insults China with Taiwan phone call and tweets on trade, South China Sea

PR No. 298 PM TELEPHONES PRESIDENT-ELECT USA Islamabad: November 30, 2016

Prime Minister Muhammad Nawaz Sharif called President-elect USA Donald Trump and felicitated him on his victory. President Trump said Prime Minister Nawaz Sharif you have a very good reputation. You are a terrific guy. You are doing amazing work which is visible in every way. I am looking forward to see you soon. As I am talking to you Prime Minister, I feel I am talking to a person I have known for long. Your country is amazing with tremendous opportunities. Pakistanis are one of the most intelligent people. I am ready and willing to play any role that you want me to play to address and find solutions to the outstanding problems. It will be an honor and I will personally do it. Feel free to call me any time even before 20th January that is before I assume my office.

On being invited to visit Pakistan by the Prime Minister, Mr. Trump said that he would love to come to a fantastic country, fantastic place of fantastic people. Please convey to the Pakistani people that they are amazing and all Pakistanis I have known are exceptional people, said Mr. Donald Trump.

Here’s what he said a year or so ago:

https://youtu.be/2eSnfLbQNe0

Just an FYI, Italy’s 5 Star party, which may take control in the next election, wants to ‘renegotiate terms’ within the EU, including relaxation of fiscal limits, but its ‘Plan A’ is not to leave the euro or the EU.

120512

Chicago Fed, Japan, China, UK, US container counts, Euro area savings desires, Fed comment, Dividends comment

Still in the red:
112101

112102
This is not a good sign for global demand. And Japan’s continuing trade surplus recently enhanced by the falling yen isn’t a positive for US GDP:

Japan’s trade surplus grows 4.7-fold in October

Nov 21 (Kyodo) — Japan’s trade surplus expanded 4.7-fold in October from a year earlier to 496.17 billion yen ($4.5 billion). The value of exports dropped 10.3 percent from a year earlier to 5.87 trillion yen while imports plunged 16.5 percent to 5.37 trillion yen. Exports to China fell 9.2 percent to 1.07 trillion yen while imports dived 17.9 percent to 1.42 trillion yen. Japan’s shipments to the United States dropped 11.2 percent to 1.20 trillion yen while imports fell 9.9 percent to 616.82 billion yen. Exports to the European Union declined 9.5 percent to 650.49 billion yen while imports shed 12.0 percent to 674.89 billion yen.

Weak foreign demand since the collapse of oil capital expenditures:

112103

Same with China, and no word yet from President Trump on ‘currency manipulation’ and ‘competitive devaluation’:

China Devalues Yuan For Longest Streak Ever To 8 Year Lows – ZeroHedge – http://bit.ly/2fwiIMc
…(6.8985 vs. Friday at 6.8796) For the 12th consecutive day, China has weakened the official fix of the Yuan against the USD, slashing its currency by over 2.2% in that time

And no push back on this statement tells me global demand can’t go anywhere but down:

UK’s Hammond says budget options constrained by high debt – http://reut.rs/2gsIZzg
…Britain’s first budget plan since the Brexit vote will not include a big new spending push because of “eye-wateringly” high public debt levels, but will have some help for the economy and struggling families, the country’s finance minister said.

The red line, imports, remain in negative territory on a year over year basis:

112104

As previously discussed, with govt. a large net payer of interest to the economy, rate cuts remove material levels of income from the economy, which constrains borrowing:

Negative Rates Are Failing to Halt Savings Obsession in Europe – http://bloom.bg/2g7ONK6

Why would we want to compete with billions of other consumes for real resources?

Fed’s Powell says Asian economies should boost domestic demand – http://reut.rs/2fiHF05

Consequences of the collapse in global oil capital expenditure continue:

Global dividends stumble as US growth drops to post-crisis low -Telegraph – http://bit.ly/2fwd253

Bannon, DB on repatriation, The $

The big stupid continues uninterrupted from regime to regime:

Documentary Of The Week: Stephen Bannon Explains America’s Problems

By John Lounsburry

Nov 15 (Econintersect) — Econintersect: This lecture was presented to the inaugural session of the Liberty Restoration Foundation in Orlando, FL October, 2011.

111701

Stephen Bannon, the CEO of Donald Trump’s successful presidential campaign and to-be Chief Strategist in the Trump White House, describes his view of what is wrong with America in 2011. He maintains that:

The U.S. cannot meet its future obligations.

The Fed makes payments by crediting member bank accounts. There is no operational constraint on this process

Government spending is sucking money out of “everything else”.

Government spends via the fed crediting a member bank account. Total dollar bank balances are increased by exactly that amount. Nothing is ‘sucked out’.

The trade deficit is the “beating heart” of our economic problems.

As for the trade deficit, imports are real benefits, exports real cost. Real wealth is domestic production + imports – exports. It’s the policy response to imports that turns a good thing into a bad thing, not the import per se. When unemployment goes up due to imports (or for any other reason), the constructive policy response is to support aggregate demand/sales/output/employment with a fiscal adjustment – lower taxes or higher public spending. That is, net imports give a nation ‘fiscal space’ to make a fiscal adjustment that sustains domestic full employment, and with better jobs than the ones that were lost. And that way we also optimize what’s called our ‘real terms of trade’, which is what we can import vs what we have to export.

The Tea Party understands what’s wrong with America because members know the price of a bag of groceries.

Whatever!!!

We are passing on zero net worth to our children.

The public debt is the total dollars spent by govt that have not yet been used to pay taxes, which constitutes the net financial assets of the economy, aka ‘net nominal dollar savings’ of the economy.

This man is the new president’s Chief Strategist.

Mercy…. :(

FROM DB:

A reform of the US corporate tax code is very high on Donald Trump’s agenda. With trillions of American corporate profits sitting offshore due to punitive repatriation rates, a potential change in policy could have material market implications. In this report we attempt to answer some frequently asked questions on the topic. While the amounts involved may be smaller than what is commonly assumed, we argue there would be material implications for both the dollar and particularly the cost of dollar funding. In the event the tax reform is permanent, it is the absence of a future pool of reliable dollar liquidity for European and other foreign banks that will likely have the biggest impact in particular.

Link: http://pull.db-gmresearch.com/p/11390-5D2D/86468804/DB_SpecialReport_2016-11-17_0900b8c08c0effb3.pdf

1. How much offshore earnings can US corporates bring back?

Answer: about $1 trillion
It is important to distinguish between unrepatriated earnings and cash. A substantial portion of US profits are re-invested into foreign operations and capital expenditure and are therefore very sticky. Cash and liquid assets are a subset of unrepatriated earnings and are the most relevant metric to look at: it is this pool of dormant savings that is the most likely to be brought back to the US in the event of a change in tax treatment.

How big are the numbers? The upper bound can be calculated by looking at re-invested earnings from the US national accounts. Cumulative re-invested earnings since 1999 currently stand at more than $3 trillion according to the BEA (chart 1). The number is not reflective of the amounts that can be brought back however. A bottom up analysis of S&P 500 companies by our equity analysts estimates that the total amount of liquid assets held offshore is closer to $1 trillion.* We would consider this as a reasonable lower bound given that S&P 500 reporting companies only account for a portion of US total market capitalization but include the vast majority of US listed multinationals. The number is also broadly consistent in order of magnitude with the “currency and deposits” item on the US international investment position, currently about $1.7trn

2. What currency are these earnings denominated in?

Answer: 90% is probably in dollars
It is difficult to provide an accurate answer to this question because the vast majority of companies don’t outline the currency composition of their holdings. Three of the largest tech companies that disclose some detail indicate that the majority of foreign earnings are already denominated in dollars. Oracle has an explicit currency breakdown in its reports with 10% of offshore profits denominated in foreign currency. Microsoft has a similar breakdown. Apple states that foreign subsidiary cash is “generally based in US dollar-denominated holdings” but doesn’t give a figure. Broadly speaking, expectations of a medium-term dollar appreciation trend, poorly yielding alternatives, the desire to avoid balance sheet mismatches and the availability of dollar-denominated assets offshore all point to most foreign profits as already being converted into USD.

3. Where are these earnings located?

Answer: mostly in Europe
Data on the location of foreign unrepatriated cash is also hard to come by. A top-down metric can be obtained from the BEA re-invested earnings data broken down by region. Cumulating earnings over the last five years, we find that the vast majority is located in the Eurozone, followed by the UK. An alternative bottom-up analysis that looked at IRS data and earnings of Fortune 500 companies leads to the same conclusion, with most profits held in the Netherlands, Ireland and Luxembourg.**

111702

4. How much of the earnings are in cash?

Answer: probably about 25%, with the rest in other financial assets, mostly US fixed income

Whether corporate profits are held in cash compared to other liquid assets has important market implications. There is no top-down data available, but our analysis of twelve companies with some of the largest offshore cash balances suggests that close to 75% of balances are in investments, and only 25% are held in cash or cash equivalents. These primarily consist of deposits held at major banks, tier-1 commercial paper and money market instruments with original maturities of less than 90 days. The securities that these companies invest tend to be liquid, short term instruments.

For instance, 83% of Microsoft’s investments consisting of US government and agency securities. Similarly, Oracle’s investments are ‘generally held with large, diverse financial institutions’ that meet investment grade criteria. All securities are ‘high quality’ with 28% having maturities within a year and 72% having maturities between 1-6 years.

5. What are the market implications?

Answer: it depends on the US corporate tax reform. Positive for the dollar and negative for dollar funding. The impact is less than the headline numbers suggest but still material given how large the numbers involved are.

The closest parallel to the impact of corporate tax repatriation is the 2005 US Homeland Investment Act (HIA). This temporarily allowed companies to bring back foreign profits at a 5.25% tax rate. US FDI spiked during that year and the dollar rallied by 7%. A number of lessons can be learnt from that episode. First, a temporary tax holiday is likely to have a more material upfront impact as it would force repatriation within a shorter time frame. A permanent change would lessen the immediate impact but is likely to be bigger medium-term as it would apply to future earnings as well. Second, the tax rate applied to foreign earnings matters. The lower this is the bigger the likely repatriation. Finally, the broader context and market narrative matters: a number of positive dollar stories took place in 2005, inclusive of a Fed hiking cycle.

First, a 7% dollar rally for the year isn’t all that much, and it reads like even DB agrees it can be attributed to other factors.

We see a corporate tax reform as having a material impact on both the dollar and the cost of dollar funding.

  • Dollar The indirect impact on the dollar is just as important as the direct “conversion” impact. With 90% of profits already held in the greenback we are left with an (upper bound) estimate of 100bn dollars that may need to be converted. Even if much smaller than the headline reported and even if a smaller portion is converted, this amount is material compared to an annual US current account deficit of $500bn. More importantly, the second-order effect may be even greater. A profit repatriation that boosts business confidence and is deployed into capital spending will be positive for the dollar via higher growth and Fed expectations.
  • First, earnings can be ‘repatriated’ without converting anything, as my understanding is it’s just a matter of reporting and accounting for the dollar value of past earnings as domestic income.

    Second, I see no reason why any company would increase capital spending just because foreign earnings from past years are suddenly accounted for as domestic earnings at a lower tax rate. DB is implying that companies have been deferring capital spending due to current tax law, even with adequate liquidity and access to funding.

  • Tighter funding, wider cross-currency basis Even if foreign profits are held in dollars, the impact on the cost of offshore dollar funding can be material if a repatriation shifts liquidity away from European and other foreign banks to the US. The implication is that cross-currency dollar basis would be pushed wider. Our bottom-up analysis in section 4 suggests that about 250bn dollars currently sit in cash or near-cash dollar liquidity that has the potential to be moved back to the US. Compared to the approximately 200bn withdrawal of dollar liquidity from Eurozone and Japanese prime money market issuers following recent US reforms the amounts are material. Most importantly, this is likely a lower bound on the potential liquidity impact. While corporate may be able to shift the custodial location of Treasury holdings onshore without pulling liquidity from offshore banking systems, it is not clear this can be achieved for asset manager mandates or holdings of non-US resident issuers such as Eurodollar corporate bonds. In the event that the corporate tax reform is permanent, it is likely the absence of future dollar liquidity from US corporate profits will have the most material medium-term impact: approximately 300bn of US earnings are re-invested each year, and the shift of parts of this flow of reliable dollar liquidity to the US would be a negative supply shock for offshore dollar funding.
  • Allow an example: assume a client has $100 billion in DB NYC, and $100 billion in DB London. Repatriation simply means he shifts the $100 billion in his DB London account to DB NYC account. And DB now has the entire $200 billion in its account at the Fed. DB’s overall liquidity has not changed. And if a DB client in the Euro zone wants to borrow $ from DB, DB is just as able to make that loan as before the repatriation.

    111703

    [The author would like to acknowledge Suhaib Chowdhary for his invaluable assistance]

    George Saravelos
    FX Research

    Deutsche Bank AG, Filiale London
    Global Markets
    1 Great Winchester Street, EC2N 2DB, London, United Kingdom
    Tel. +44 20 754-79118

    My conclusion remains. Repatriation as a source of funds is being grossly over estimated

    Trump has been big (huge) on threatening the likes of China with currency manipulation, aka yuan depreciation vs the $. Same with yen, euro, etc. all threatening the Trump rust belt revival constituency, etc.

    111706
    So now, a week after his election, the gauntlet has been throw, as the $US reaches new highs, and I suspect we’ll soon see how the big guy responds:

    111704

    111705

    Mortgage purchase apps, ADP employment, International trade, PMI services, ISM services, Factory orders

    The year over year change not looking so good:

    100501

    Highlights

    Purchase applications for home mortgages were down just 0.1 percent from the prior week in the September 30 week, but the comparison with the year ago week plunged sharply into deeply negative territory at minus 14 percent. Refinancing applications were up 5.0 percent from the prior week, however, as more mortgage holders seized the opportunity to refinance with lower interest rates. The refinancing share of mortgage activity increased to 63.8 percent, up 1.1 percentage points from a week ago. Mortgage rates fell to the lowest level since July, with the average interest rate on 30-year fixed-rate conforming loans ($417,000 or less) falling 4 basis points to 3.62 percent.

    Employment growth continues to decelerate:

    100502

    Highlights

    ADP is looking for significant slowing in employment growth for September, to 154,000 for its private payroll estimate vs a slightly revised 175,000 in August. The Econoday consensus for private payrolls in Friday’s report is 170,000 but today’s ADP result will definitely raise talk of a lower print.

    In the old days a drop in oil prices would cause the US trade deficit to decrease. But as previously discussed, this time it didn’t happen. And now with lower US oil production and more oil and product imports, higher prices will increase the trade deficit:

    100503

    Highlights

    The nation’s trade deficit widened by $1.2 billion in August to $40.7 but details are positive. Exports of capital goods, excluding aircraft, actually rose slightly to $37.6 billion while imports of capital goods were up $1.2 billion to $50.2 billion. These results hint at badly needed strength for cross-border business investment. When including aircraft, however, capital goods exports fell $0.7 billion in what is the lowest result in nearly 5 years.

    Total exports in August rose 0.8 percent, which is another positive, while imports rose 1.2 percent. The gain for imports is a subtraction in the national accounts but it does point to solid domestic demand, specifically once again for capital goods. The trade gap for goods is unchanged from July at $60.3 billion while the trade surplus for the nation’s services, in what is a superficial negative in the report, fell $1.2 billion to $19.6 billion for the lowest showing since December 2013. But the dip in services reflects $1.2 billion in broadcast payments for the Olympics.

    By countries, the gap with China widened by $3.6 billion to $33.9 billion while the gap with the European Union widened by $1.6 billion to $13.9 billion. The gap with Japan edged lower to $6.0 billion.

    Today’s results may lower third-quarter GDP estimates but the export reading excluding aircraft is a subtle positive for the economic outlook.

    100504
    Up a bit but some troubling details:

    100505

    Highlights

    Service sector growth is improving, at least that’s what Markit’s U.S. sample is reporting. The composite index for September is 52.3, up slightly from 51.9 in the month’s flash reading and up solidly from a 5-month low of 51.0 in August. But the composite hides what is disappointing slowing in new orders which are at their weakest growth rate since May. And in a negative indication for Friday’s employment report, hiring slowed to a 3-1/2 low in the month. Reports from Markit, unlike other reports, continue to cite uncertainty over the presidential election as a negative factor. A positive in the report is a third straight build in backlog orders which posted their second best gain since April last year. But another negative is a near recovery low in 12-month optimism. Input costs and selling prices are both very subdued. Watch for the ISM non-manufacturing report later this morning at 10:00 a.m. ET.

    100506
    Hard to say what’s going on here! I suppose it can be said that monetary policy is finally kicking in and the good times are back!!!
    ;)

    100507

    Highlights

    August was a weak month for the ISM non-manufacturing report but not September! The composite index shot up to 57.1 from August’s recovery low of 51.4 which now looks like a very odd outlier for this report which otherwise has been consistently strong this year. And new orders are especially strong, up nearly 9 points to 60.0 which points to brisk activity for other readings in the months ahead. Employment is also a very solid plus in the report, up 6.5 points to 57.2 which is the strongest rate of growth since September last year. This particular reading will help offset some of the disappointment over this morning’s weak estimate from ADP. Service exports are a specific strength of the U.S. economy and this report points to September gains, at 56.5 for the best reading in a year. Business activity is at 60.3, again very strong, with total backlog orders back in the plus column at 52.0. The great bulk of the nation’s economy accelerated sharply at the end of the third quarter, at least based on this report.

    100508
    Returning to earth, not looking so good here. August up a bit more than expected but July revised down more than that, and year over year orders remain in contraction:

    100509

    Highlights

    Throw out the headline and look at capital goods. Factory orders in August edged only 0.2 percent higher but core capital good orders (nondefense ex-aircraft) jumped 0.9 percent following very impressive gains of 0.8 percent and 0.5 percent in the prior two months. These results point to a rebound for business investment which otherwise has been depressed this year.

    But the new orders for capital goods will take time to fill and in the meantime business is slow as shipments of core capital goods slipped 0.1 percent following a July dip of 0.7 percent. These two readings will hold down nonresidential investment in the third-quarter GDP report, but that’s pretty much ancient history.

    Other readings include no change for total shipments, a fractional dip of 0.1 percent in unfilled orders, and a constructive 0.2 percent build in inventories. In sum, this report is a positive for the economic outlook.

    100510

    China, Small business index, Productivity and Labor costs, Redbook retail sales

    No sign of increased global demand here:

    China Exports Slide on Weak Demand

    By Mark Magnier

    Aug 9 (WSJ) — China’s General Administration of Customs said Monday that exports fell 4.4% in July year-over-year in dollar terms after a 4.8% decline in June. July imports fell by a greater-than-expected 12.5% from a year earlier, raising concerns over weak domestic demand. This compared with an 8.4% fall in June, the customs agency said. China’s trade surplus widened more than expected in July to $52.31 billion from $48.11 billion the previous month. The economy grew at a better-than-expected 6.7% rate in the second quarter, matching its first-quarter level.

    No improvement of note here as this index remains depressed:

    Highlights
    The small business optimism index rose 0.1 points in July to 94.6, a minute gain but nevertheless a touch higher than expectations and the fourth monthly increase in a row after falling to a 2-year low in March. Four of the 10 components of the index increased, four declined and two were unchanged.

    Expectations that the economy will improve led the gains again, rising 4 points as it did in May and June yet still remaining negative at minus 5, followed by plans to increase inventories, which rose 3 point to a neutral 0. Job openings hard to fill fell 3 points to 26 while maintaining its position as the strongest of the components, with the second strongest, plans to increase capital outlays, also dropping 1 point to 25. Business owners became even more pessimistic about earnings trends, with what has been the most negative component falling 1 point to minus 21.

    8-9-1

    I’m still thinking the negative productivity numbers- more employees producing less output- can be thought of as ‘human inventory building’ that increases costs and at some point reverses. That is, without increases in sales there’s generally no reason to increase employment.

    At the same time, the still substantial slack in the labor market is keeping down labor costs, with the initially reported large Q1 gain revised down to a negative .2%.

    Highlights
    Output picked up in the second quarter but not quite as much as hours worked or compensation. Productivity fell 0.5 percent in the quarter for the third decline in a row. This is the longest negative streak in the history of this report which goes back to just after WWII.

    Unit labor costs rose 2.0 percent but, in a plus, were revised sharply lower in the first quarter which now shows a rare decline at minus 0.2 percent. But most readings in this report are not positive including the year-on-year rate for productivity which is down 0.4 percent for the first decline since second-quarter 2013. In an unfavorable contrast, year-on-year unit labor costs are up 2.1 percent.

    Lack of business investment is unfortunately a central negative of this cycle and it results in weakening productivity for the nation. Americans are working more hours but production isn’t keeping up.

    Still stone cold dead:
    8-9-2

    Trade, KC manufacturing index, Atlanta Fed, Ford

    Higher than expected, and last month revised higher as well. And oil imports are increasing as output falls and consumption remains firm:

    7-28-1
    More bad news doesn’t stop the KC Fed from calling for a rate hike:

    7-28-2

    Highlights
    The good news didn’t last long for the Kansas City manufacturing index which, after popping to plus 2 in June for the first positive score since January last year, is back in the negative column at minus 6 in July. New orders are at minus 5 with backlog orders at minus 3. Not surprisingly, employment is at minus 5 and isn’t like to move up until orders pick up. Production is at minus 15 and shipments are at minus 17. Price data show modest pressure for inputs but continued contraction for selling prices. Inventories are flat. This year’s snap back for oil, which is now fading somewhat, hasn’t yet made for much improvement for this or the Dallas Fed report. Despite bright spots in isolated readings, the manufacturing sector continues to hold down the nation’s economic growth.

    7-28-3
    Down to 1.8%. I’m still thinking lower due to larger inventory adjustments, though it may come with the later revisions:

    7-28-4
    So they are just now waking up to the fact that total vehicle sales have been dropping for the last year?

    Lackluster U.S., China sales drag on Ford Motor profit; shares tumble

    By Bernie Woodall

    July 28 (Reuters) — Ford Motor reported weaker-than-expected profit in the second quarter, and said its full-year earnings forecast was at risk with U.S. auto sales expected to fall in the second half, sending shares tumbling in premarket trading. Auto sales in the United States and China were lower than anticipated in the quarter, and Ford reported its first quarterly loss in the Asia Pacific in three years.

    7-28-5