ADP, Mtg purchase apps, Capital spending report, Oil prices

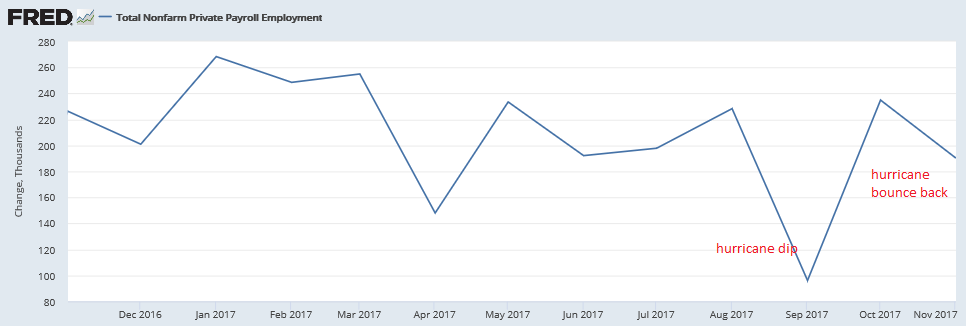
Winding down from post hurricane levels, however keep in mind this is a forecast of Friday’s number, not report of actual private payrolls:
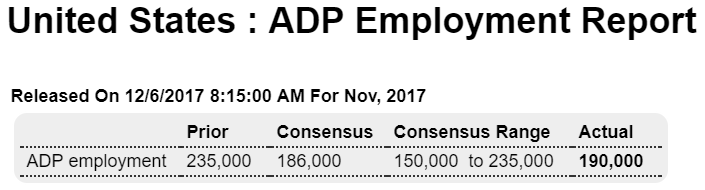
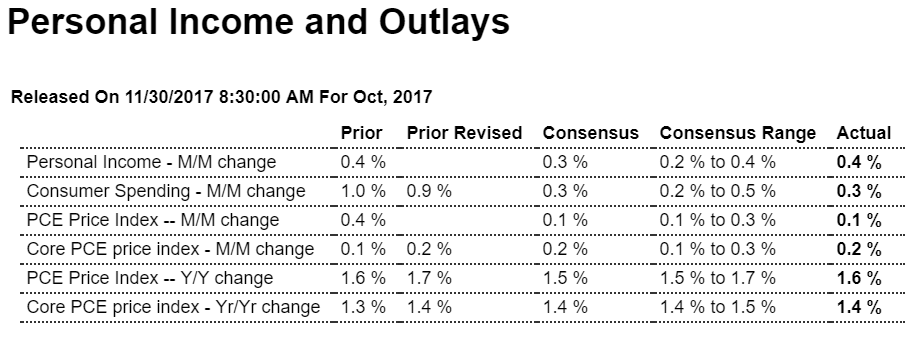
Highlights

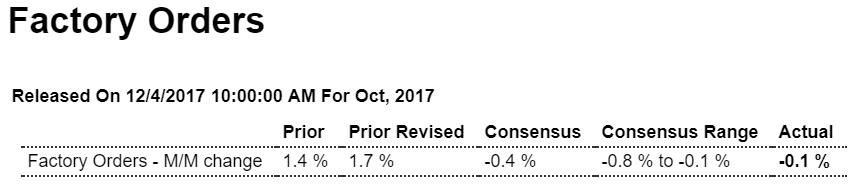
A pre-hurricane total of 190,000 is ADP’s call for November private payroll growth which would follow a hurricane-related upswing of 252,000 in October and 15,000 downswing in September. This fits with Econoday’s consensus for Friday’s November report where private payrolls are expected to rise 184,000. Demand for labor has been very strong this year though wage traction has still been limited. Note that ADP’s October call is unrevised at 235,000.


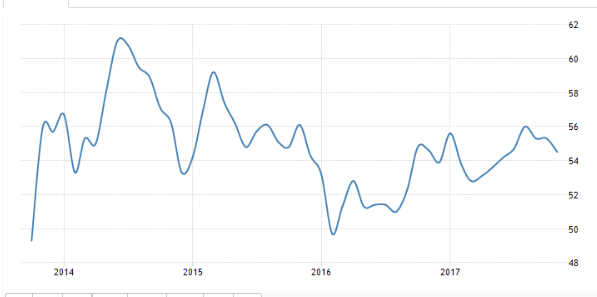
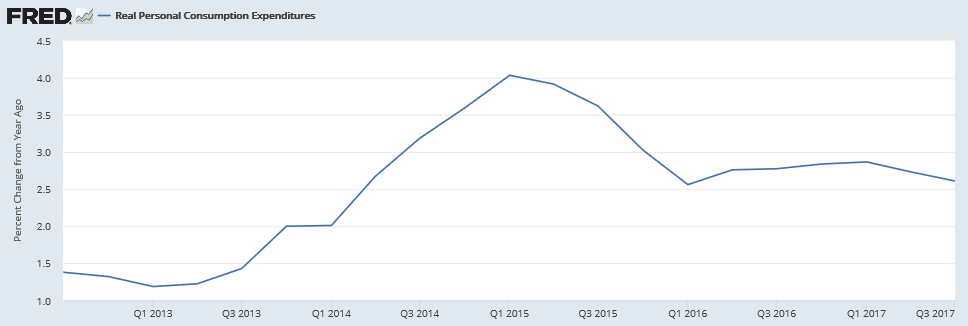
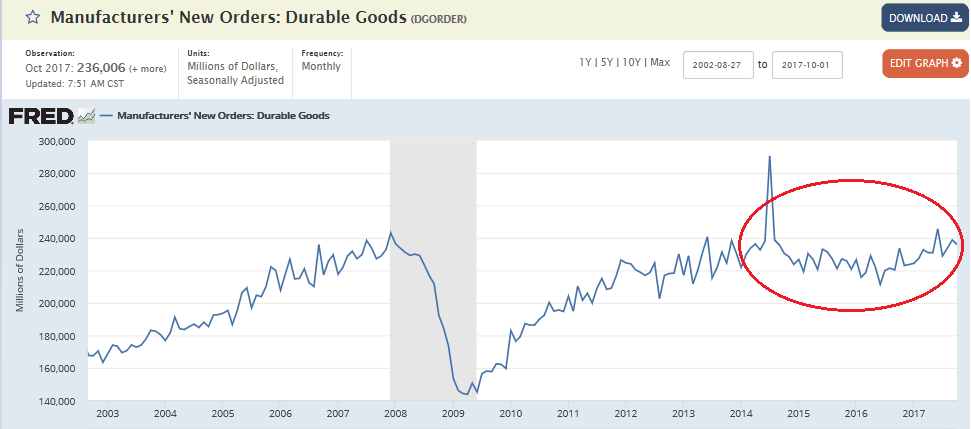
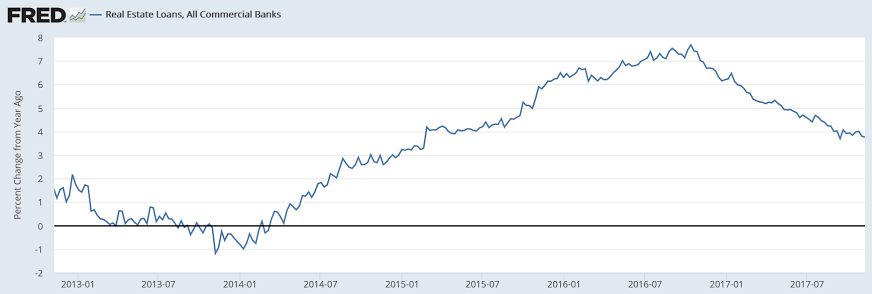
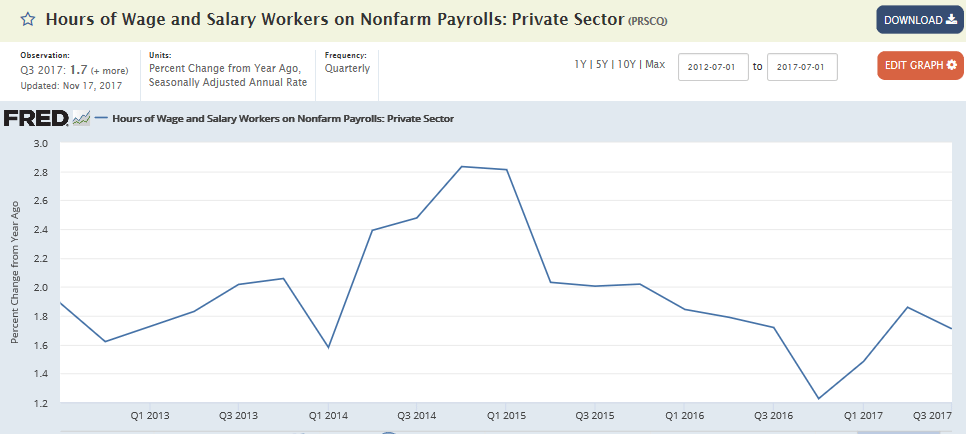
The quarterly chart for the growth of hours worked shows a lower growth rate:


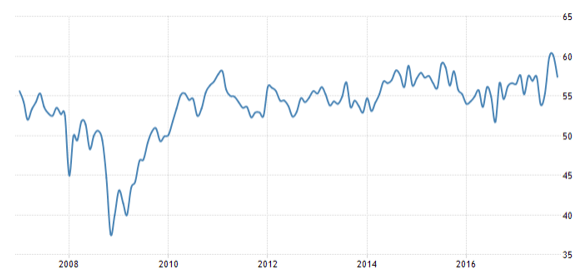
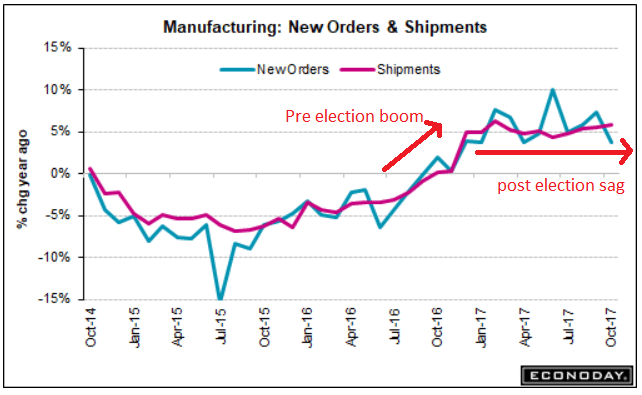
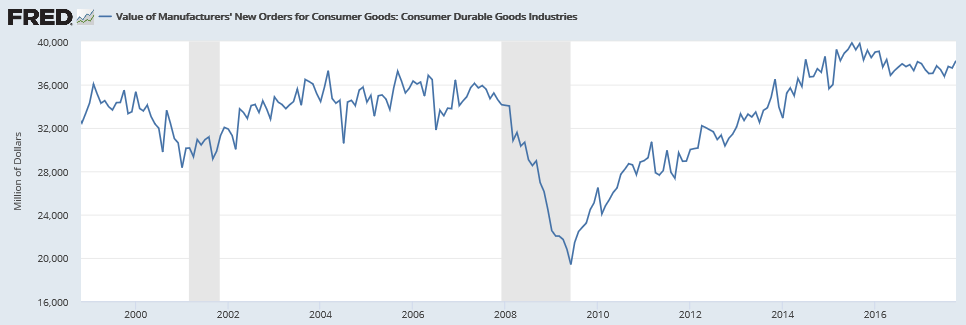
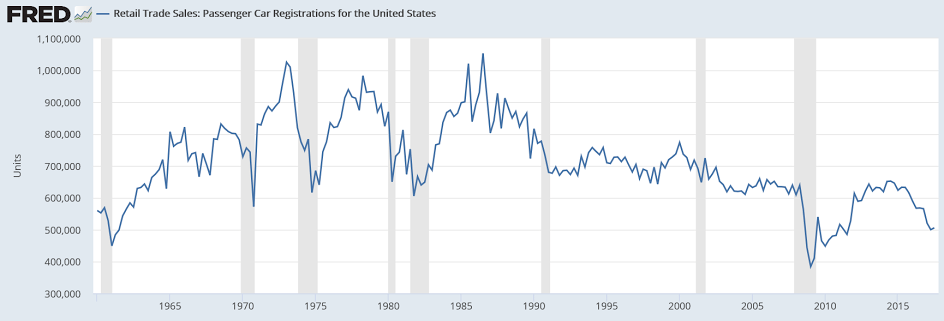
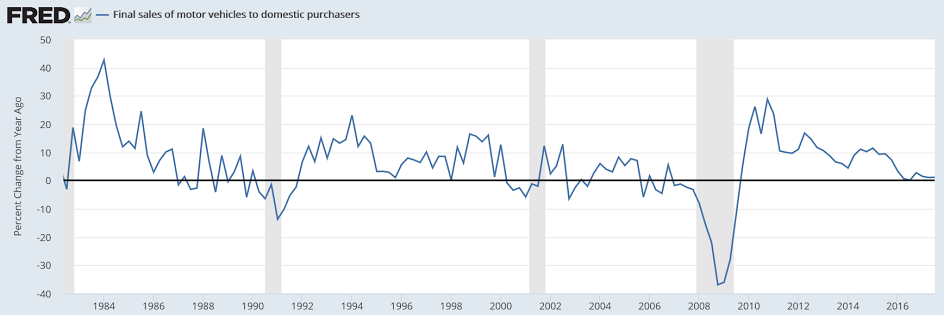
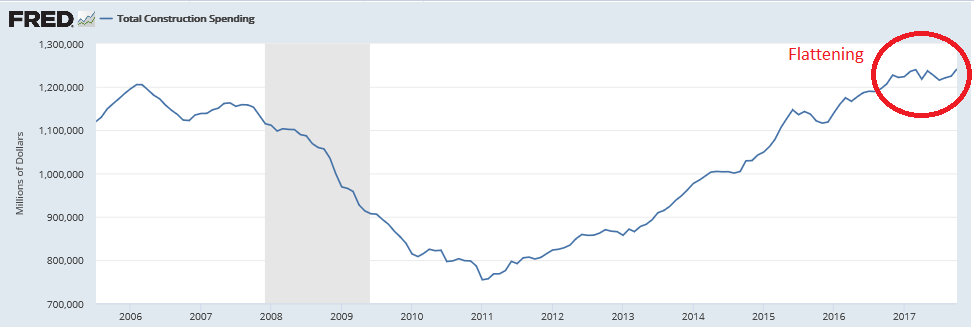
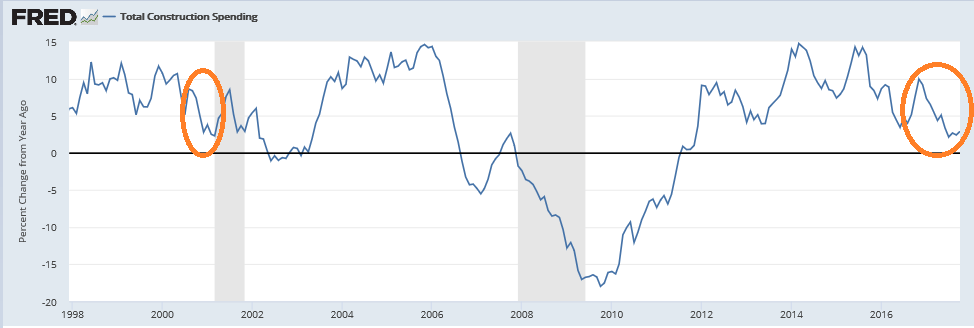
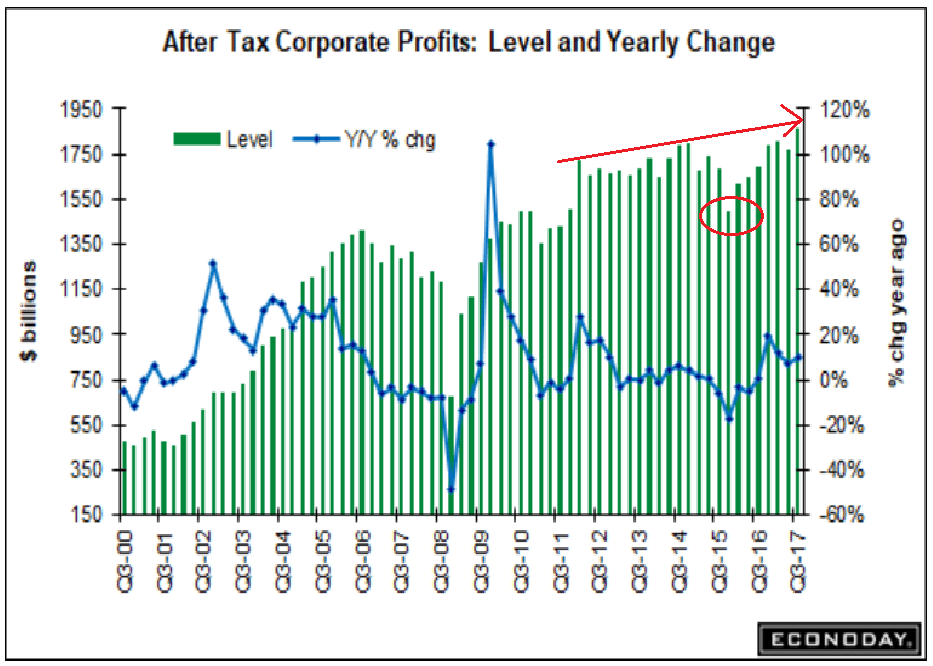
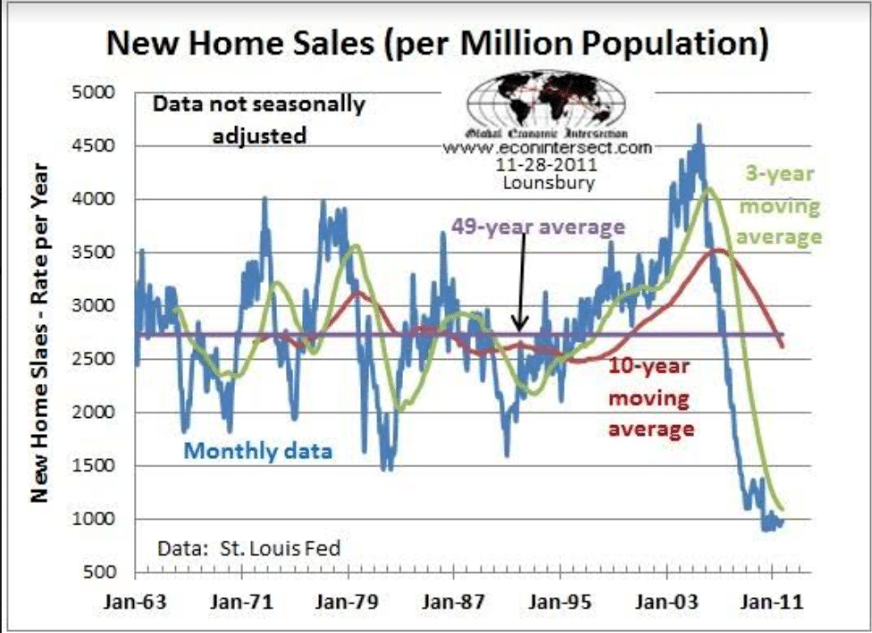
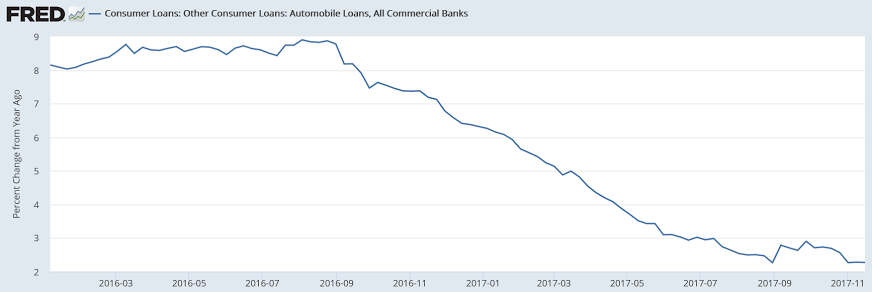
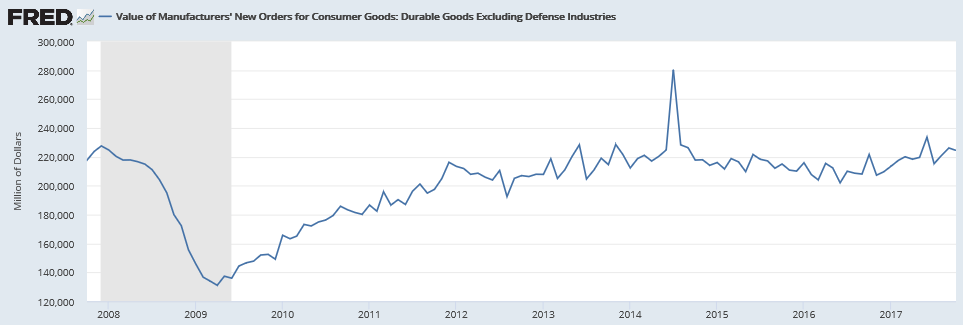
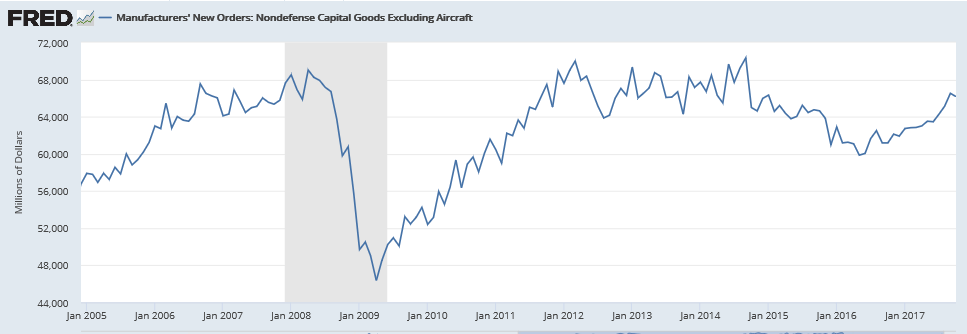
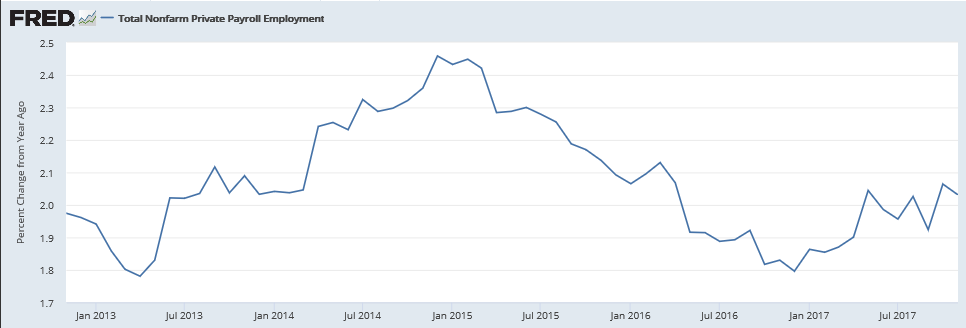
Overall looks to be flat to down vs last year:

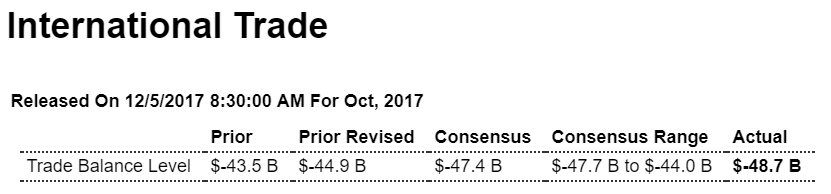
Planned Capital Spending – November 2017

Combined U.S. & Canadian Industrial Spending Falls 30 Percent

RALEIGH, NC –December 1, 2017

Research by Industrial Reports, Inc. shows combined U.S. and Canadian planned capital spending dropped dramatically in November compared to October. November spending for the two nations totaled $36.83 billion compared to October’s $53.37 billion. The research organization reported 239 planned U.S. and Canadian projects in November.

Planned U.S. project spending sunk in November with $30.33 billion in planned investment compared to the October total of $48.97 billion. However, Canadian planned investment improved with $6.50 billion in November compared to $4.40 billion in October. Projects in both nations ranged in value from $800,000 to $6 billion.

Process projects led U.S. spending with $22.83 billion in planned investment, followed by manufacturing projects with $3.24 billion. Power and energy projects reported $1.96 billion in planned U.S. spending.

In Canada, process projects led all markets with $6.19 billion in planned spending, while power and energy projects accounted for $84 million.

Texas led the U.S. in planned investment for the month with $11.90 billion, followed by Louisiana with $4.98 billion and California with $2.02 billion

In Canada, Alberta led the provinces and territories with $4.51 billion in planned spending. British Columbia reported $591 million and Ontario reported $267 million.

Texas was the leader in U.S. project activity with 19 planned projects. New York and Ohio each reported 13 planned projects while North Carolina reported 12.

Alberta led Canadian project activity with eight planned projects. British Columbia reported seven and Ontario five.

More evidence Saudis may be on the move towards higher prices:

Aramco Raises Light Crude Pricing to Asia to Three-Year High

Aramco raises Arab Light pricing for January sales by 40c/bbl to $1.65 vs Oman/Dubai benchmark, according to emailed statement.

  • Co. increases pricing for all grades to Asia and NW Europe
  • Co. cuts pricing for all grades to U.S.
  • Aramco raises Light, Extra Light pricing to Mediterranean region, keeps Medium, Heavy grades unchanged
  • Trade, Redbook retail sales, PMI services, ISM services

    As previously discussed, the US bill for oil imports went up:

    Highlights

    Fourth-quarter net exports get off to a weak start as October’s trade deficit, at $48.7 billion, comes in much deeper than expected and well beyond September’s revised $44.9 billion. Exports, at $195.9 billion in the month, failed to improve in the while imports, at $244.6 billion, rose a steep 1.6 percent. Price effects for oil, up more than $2 to $47.26 per barrel, are to blame for much of the rise in imports inflating costs of industrial supplies including crude where the deficit rose $1.5 billion to $10.7 billion, but consumer goods are also to blame, imports of which rose $800 million in the month to $50.0 billion.

    Exports of capital goods are the largest category on the export side and they fell back $1.2 billion to $43.9 billion and reflect a $1.1 billion drop in aircraft where strength in orders, however, points to better aircraft exports to come. Exports for both vehicles, at $12.6 billion, and consumer goods, at $16.3 billion, both declined.

    Country data show the monthly gap with China deepening $600 million to $35.2 billion and with Japan by $1.6 billion to $6.4 billion. The EU gap widened by $2.3 billion to $13.7 billion. The gap with Mexico rose $900 million to $6.6 billion and Canada $1.5 billion deeper at $1.8 billion.

    Today’s report is not favorable for fourth-quarter GDP but doesn’t derail at all what has been an ongoing run of mostly solid economic results.

    Looks like things are settling down:

    Highlights

    Same store sales were up 3.0 percent year-on-year in the December 2 week, decelerating by a steep 1.5 percentage points from the prior week’s pace. Month-to-date sales versus the previous month were down 0.9 percent, 0.7 percentage points weaker than last week’s reading, while the gain in full month year-on-year sales shed 0.5 percentage points to 3.0 percent. The week’s sharp setback from the strongest reading in 3 years registered in the prior week by retailers in Redbook’s same-store sample may signal more moderate growth in ex-auto ex-gas retail sales during the key Christmas sales period.

    The surveys are starting to come off their trumped up levels:

    Markit PMI services:


    ISM non manufacturing:

    Factory orders, Cash bonuses, Oil prices

    As the chart shows, year over year growth has gone to near 0 since the election, and the hurricane replacement effect has since dissipated:

    Highlights

    A big upward revision to core capital goods highlights today’s factory orders report which closes the book on what was a mixed October for manufacturing. The month’s 0.1 percent decline, which is better than expected and actually hits Econoday’s high estimate, reflects a 33 percent downswing for commercial aircraft orders that follows, however, a very strong recent run and looks to build again following Boeing’s success at November’s Dubai air show.

    The split between the report’s two main components shows a 0.7 percent gain for nondurable goods — the new data in today’s report where strength is tied to petroleum and coal — and a 0.8 percent dip for durable orders which is 4 tenths improved from the advance report for this component. And driving the upward revision for durables is a major upward revision to October core capital goods (nondefense ex-aircraft) which is now up 0.3 percent from the initial 0.5 percent decline. This extends what is a very strong run for a component that offers leading indications on business investment.

    Shipments of core capital goods are also revised higher, up an additional 2 tenths to 1.1 percent to extend what is also an impressive run, one that feeds directly into nonresidential fixed investment and marks a strong early plus for fourth-quarter GDP. Other readings include a 0.2 percent gain for inventories and a 0.6 percent gain for total shipments, a mismatch pointing to the need for restocking but not enough to change the inventory-to-sales ratio which holds at 1.37. Not a plus in the report is no change in unfilled orders which have yet to get going.

    A plus in the report is a sharp 1.3 percent rise in vehicle orders as the auto sector responds to the hurricane-replacement sales surge of September and October. Looking past the headline, this report is very solid and points squarely at a rising contribution from the factory sector.


    From this longer view I don’t see much to get excited about here, and the numbers are not adjusted for inflation:

    And previously released credit aggregates, vehicle sales, and building permits are saying growth has already ended:

    More Employers Skip The Cash Bonus

    From Challenger Gray and Christmas

    Higher corporate profits, low unemployment, and high economic confidence among employers is not translating to more cash-based year-end bonuses.

    Saudi Arabia may raise January oil prices to Asia to over 3-year high

    SINGAPORE, Dec 1 (Reuters) — Top oil exporter Saudi Arabia is expected to raise the January price for its flagship Arab Light crude in Asia to the highest in more than three years to track a stronger Dubai benchmark, trade sources said on Friday.

    Robust demand in Asia and continuing supply cuts by the Organization of the Petroleum Exporting Countries (OPEC) and Russia are rebalancing global oil markets. The producers agreed on Thursday to extend those supply cuts to end-2018, a decision that pushed Brent above $64 a short time later.

    A price hike would track a wider price spread between prompt and third month cash Dubai that rose 31 cents last month from October, trade sources said. Front-month Dubai is higher than those in future months, indicating strong demand for prompt oil.

    The survey respondents also expect an increase of 50-60 cents in Arab Extra Light’s OSP in January after naphtha margins surged last month to the highest since early 2016.

    January price hikes for Arab Medium and Heavy grades were likely to be smaller than those for light grades as fuel oil cracks weakened last month, the respondents said.

    One of the four respondents expected a price cut for Arab Heavy crude.

    Saudi crude OSPs are usually released around the fifth of each month, and set the trend for Iranian, Kuwaiti and Iraqi prices, affecting more than 12 million barrels per day (bpd) of crude bound for Asia.

    State oil giant Saudi Aramco sets its crude prices based on recommendations from customers and after calculating the change in the value of its oil over the past month, based on yields and product prices.

    Saudi Aramco officials as a matter of policy do not comment on the kingdom’s monthly OSPs.

    Below are expected Saudi prices for January (in $/bbl against the Oman/Dubai average):

    DEC Change est.JAN OSP

  • Arab Extra Light +2.45 +0.50/+0.60 +2.95/+3.05
  • Arab Light +1.25 +0.25/+0.40 +1.50/+1.65
  • Arab Medium +0.00 +0.10/+0.35 +0.10/+0.35
  • Arab Heavy -1.15 -0.15/+0.30 -1.30/-0.85
  • Construction spending, Rig count, Fed US leading index, Flynn news

    Up a bit this month but as per the chart it’s bumping along at recession type levels:

    Highlights

    It’s not housing that drove construction spending up a very sharp 1.4 percent in October but non-residential activity which had been lagging in this report. Spending on private non-residential construction jumped 0.9 percent in the month with strength centered in office construction and transportation construction. Despite the improvement, year-on-year spending on the non-residential side is still negative, at minus 1.3 percent. Public building also had a strong month with educational building up 10.9 percent for a standout year-on-year rate of 14.6 percent. Spending on highways & streets was also strong in October, up 1.1 percent though still down on the year, at minus 8.5 percent.

    Residential spending has been leading this report but October was moderate, up 0.4 percent overall and held back by a 1.6 percent decline for multi-units. But home improvements were strong in the month, up 1.4 percent for an 8.7 percent yearly rate. Total residential spending is up a year-on-year 7.4 percent with spending on new single-family homes up a very significant 8.9 percent.

    But new homes aside, overall construction spending is up only 2.9 percent which is a very moderate total that evokes this week’s Beige Book where modest-to-moderate still dominated the description of the economy.

    This is not adjusted for inflation:


    Seems to go up when the price of oil goes up…


    Looks like we’ve crossed the line?

    Keeps getting worse:

    Flynn says Trump transition official told him to make contact with Russians

    As part of a plea deal, former national security adviser Michael Flynn has admitted that a senior member of the Trump transition team directed him to make contact with Russian officials in December 2016.

    Flynn pleaded guilty Friday to making false statements to the FBI, becoming the first official who worked in the Trump White House to make a guilty plea so far in a wide-ranging investigation led by special counsel Robert Mueller into possible coordination between Russia and the Trump campaign to influence the outcome of the 2016 election.

    The government did not reveal the identity of the senior transition official.

    Gross domestic income

    GDI (gross domestic income) = GDP (gross domestic product) by identity. The funds spent to buy the output are the income of the sellers of the same output.

    But the government gets the data for each independently, which includes estimates of various categories, so the reported numbers don’t equate when initially released, but do tend to come together over time as more data is collected. And right now it looks to me like GDI has been running quite a bit weaker than GDP:


    Decelerating income growth leads recessions:


    Averaging GDP and GDI looks like this:

    Personal income and spending, Chicago PMI, corporate profits, Comments on tax reform

    Income a bit higher than expected due to higher interest income, but as per the charts income growth has slowed and seems the only thing keeping spending growing even at these very modest levels is consumers dipping into savings:

    Highlights

    Inflation is showing the slightest bit of life yet probably more than enough to assure a rate hike at this month’s FOMC. The core PCE price index, which is the inflation gauge FOMC members most closely watch, rose an as-expected 0.2 percent in October with September revised 1 tenth higher and now also at 0.2 percent. October’s year-on-year rate also made expectations at 1.4 percent with the prior month again revised 1 tenth higher and also at 1.4 percent. These rates are far from overheating but the forward direction, however glacial, is favorable for policy makers who are trying to push inflation gradually higher.

    Other readings in the report are mixed with personal income getting a special boost from interest income and rising 0.4 percent which is 1 tenth above expectations and actually at the high estimate. Yet the wages & salaries component for income, which is key, is up only 0.3 percent which is soft and down 2 tenths from September. Spending is also soft, up 0.3 percent as expected and reflecting a slight downtick in durable goods as vehicle sales in October, though strong, couldn’t match September’s hurricane-replacement spike.

    The savings rate remains low though it did rise 2 tenths to 3.2 percent. In comparison to employment or the sparks appearing in the factory and housing sectors, this report offers a more subdued view of the economy, much like yesterday’s Beige Book where modest-to-moderate was the theme. For Fed policy, spending and income don’t point to any urgency for a rate hike but the high level of employment does as it threatens, at least in theory, to ignite a burst of wage-push inflation.

    The income curve remains bent, as the rate of growth shifted as oil related capital expenditures collapsed late in 2014


    This is not sustainable:


    Survey data continues to show optimism so far generally unmatched by the hard data:


    Corporate profits are up about 10% from a year ago, which was a low point, but nearly flat over the last 6 years or so:

    GDP, Profits, Pending home sales, Mtg purchase apps

    First revision has the consumer a bit weaker than expected, which means the savings rate isn’t quite as weak as initially reported. The savings rate, however, is still unsustainable weak, meaning either consumer spending falls further or personal income growth reverses its deceleration. The other revisions include an increase in already too high inventories that have already turned negative in Q4, and a smaller trade deficit that is now showing increases in q4. And the hurricane assisted boost in auto sales has more recently reversed as well:

    Highlights

    Third-quarter GDP proved even more solid than the first estimate, revised 3 tenths higher in the second estimate to an as-expected 3.3 percent annualized rate. Nonresidential investment and inventory growth added a little more in the second estimate while residential investment and net exports subtracted a little less. These offset a slightly smaller contribution from consumer spending, at a 2.3 percent rate vs 2.4 percent in the first estimate and expectations for 2.5 percent. The drop off on the consumer side was centered in durables which, despite a slight downgrade, still grew at an 8.1 percent rate getting a boost from hurricane-replacement demand for autos.

    Turning back to inventories, whether builds are actually positive or negative for the outlook are always difficult to assess, but given this year’s general strength in consumer and business demand, the third-quarter build is probably a positive for the outlook, suggesting that businesses were stocking up for strength ahead including for the holiday shopping season.

    Consumer spending, despite auto sales, wasn’t on fire in the third quarter though the outlook for the fourth quarter, given what are very high expectations for holiday spending, are positive. Early expectations for fourth-quarter GDP are once again in the 3 percent range.


    This is being held up by consumers dipping into savings to sustain their spending:


    This is from two weeks ago:


    Hurricane story, sales still very weak historically:

    Highlights

    Led by a hurricane bounce in the South, the pending home sales index jumped a much sharper-than-expected 3.5 percent in October which points to continued gains for final sales of existing homes. Pending sales in the South jumped 7.4 percent in October after falling 3.0 percent during the hurricane swept month of September. The index level in the South, at 123.6, far outdistances all other regions and compares against 109.3 for the total index. October’s overall gain follows two months of sharp increases in new home sales and will boost confidence that housing, after a mostly flat year, is pivoting higher at year end.

    The Pending Home Sales Index, a forward-looking indicator based on contract signings, rose 3.5 percent to 109.3 in October from a downwardly revised 105.6 in September. The index is now at its highest reading since June (110.0), but is still 0.6 percent below a year ago.
    Read more at http://www.calculatedriskblog.com/#vRbrDXSwqADlwL5M.99

    And no sign of a sudden spike in mtg purchase apps here:

    Trade, New home sales chart, Redbook retail sales, Consumer confidence

    As previously discussed, the food export spike was a one time event:

    Highlights

    With housing and manufacturing showing strength the outlook for fourth-quarter GDP was building, until that is this morning’s advance trade and inventory data. October’s goods deficit was much higher-than-expected, at $68.3 billion for a very sizable $4.2 billion increase from September. The details speak to weakness with exports down 1.0 percent, reflecting declines for food products and capital goods, while imports rose 1.5 percent on increases in industrial supplies and, once again, consumer goods.

    Inventory data for October show draws for both wholesalers and retailers, at minus 0.4 percent and minus 0.1 percent respectively which are both negative for GDP.

    Both trade, where the deficit had been narrowing, and inventories, where builds had been rising, were positives for second- and third-quarter GDP but the opening fourth-quarter look at these two components point to understandable give back.

    Definitely looking up for ‘same store sales’ and heading back to ‘normal’ levels, but not sure why. Could be due to fewer retail outlets or maybe higher prices?


    Up nicely, but check out the details:

    Highlights

    Consumer confidence continues to soar, at 129.5 in November which is a new 17-year high and easily surpasses Econoday’s top estimate. The strength is derived from the labor market where a very low 16.9 percent describe jobs as currently hard to get. This reading is closely watched and will boost expectations for another strong monthly employment report. And extending strength is expected for the labor market with optimists on the jobs outlook surging nearly 4 percentage points to 22.6 percent and nearly double pessimists who are down 6 tenths to only 11.0 percent. Confidence is likewise booming for the stock market where 46.0 percent see stocks rising over the next year which is up 3.8 points from October. Bears are down to 19.0 percent from last month’s 22.7 percent.

    The combination of expected gains in jobs together with expected gains for stocks is making for unusual confidence in the year-ahead income outlook where 20.1 percent see gains and only 7.6 percent see declines. This is a core reading and underscores the report’s level of strength.

    Not favorable, however, are inflation expectations which are down 2 tenths to 4.5 percent which is very low for this reading. Buying plans are mixed with cars, after a spike in October, back down but with housing up.

    Wage growth has been limited but so has price inflation which perhaps is another factor boosting income expectations. In any case, consumer confidence as measured by this report and others is enjoying its best run in a generation.

    Survey data still optimistic:

    New home sales, Bank lending, Philly Fed state coincident index

    A better than expected, but somewhat peculiar details, and note the approximate average over the last 4 months. And maybe some tax related buying?

    Last month, new single-family homes sales soared 30.2 percent in the Northeast to their highest level since October 2007. Sales in the South increased 1.3 percent also to a 10-year high. There were also strong gains in sales in the West and Midwest last month.

    More than two-thirds of the new homes sold last month were either under construction or yet to be started.

    Despite the rise in sales in October, the inventory of new homes on the market increased 1.4 percent to 282,000 units, the highest level since May 2009.

    Total year-on-year sales are up 18.7 percent for a nearly 2 percentage point gain from September. But not the entire housing sector is showing this kind of strength as sales of existing homes are actually down 0.9 percent on the year. But new homes, boosted by the strong labor and stock markets, are definitely moving and look to be a significant contributor to fourth-quarter growth.


    Still working its way lower just like it’s done with every recession but GDP estimates telling me there’s some major credit expansion somewhere I’m missing?

    Nice bounce up to 42. Note the prior, similar bounces:

    Mtg purchase apps, Durable goods orders

    I don’t see any convincing evidence of a housing market revival, particularly with the growth of real estate lending remaining well below that of last year:

    Highlights

    Purchase applications for home mortgages rose a seasonally adjusted 5 percent in the November 17 week, though overall mortgage activity was only barely higher (by 0.1 percent) than in the prior week as the increase in buyers was offset by a 5 percent decline in refinancing activity. On an unadjusted basis, the purchase index rose only 1 percent from the prior week, putting the year-on-year gain at 4 percent, down a sharp 14 percentage points from last week’s reading due to an outsized weekly jump higher in the index in the comparable week last year. The slowdown in refinancing took its share of mortgage activity down 1.4 percentage points from the prior week to 49.9 percent. Mortgage rates rose slightly though remaining at historically low levels, with the average interest rate on 30-year fixed-rate mortgages ($424,100 or less) up 2 basis points to 4.20 percent. Today’s report shows home-buyers quite active and adds to recent evidence of a housing market reviving in the fourth quarter, though the year-on-year gain, now at just 4 percent after much stronger readings for most of the year, suddenly looks much less impressive.


    Less than expected but still showing modest year over year growth:

    Highlights

    Durable goods orders, down 1.2 percent in October, couldn’t post three straight gains but there are positives in the report. But first the negatives which include a 33 percent reversal for commercial aircraft orders and a 0.5 percent decline for core capital goods orders (nondefense ex-aircraft). These two components have been very strong in recent months so a step back isn’t a surprise, and aircraft orders appear certain to jump sharply in next month’s report given Boeing’s major success at this month’s Dubai Air Show.

    Ex-transportation offers an underlying reading and this is solid with a 0.4 percent gain. The revision to this reading for September is also positive, up 4 tenths to 1.1 percent. And core capital goods get an even bigger revision, an 8 tenths upgrade to 2.1 percent in September which helps offset October’s decline. Shipments of core capital goods, which are direct inputs into GDP, are also revised higher, up 5 tenths in September to 1.2 percent with October coming in at a constructive plus 0.4 percent. Other positives in the report are a 1.7 percent rise in vehicle orders and a 1.5 percent increase in vehicle production, both of which follow the ex-hurricane spike in vehicle sales.

    Other readings are mixed including very modest 0.1 percent gains for both total shipments and total inventories and a disappointing no change for unfilled orders.

    This report isn’t a step forward but the factory sector, nevertheless, still looks to be a positive contributor to fourth-quarter growth.

    Modest growth recently but still not back on track since the collapse in oil capex at the end of 2014. And these charts are not adjusted for inflation: