
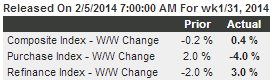
Highlights
The purchase index continues to weaken, down 4.0 percent in the January 31 week and down a very sizable 17 percent year-on-year. This signals weakness for underlying home sales and underscores the importance of all cash buyers in the housing market. A move lower for mortgage rates didn’t help the purchase index but did help the refinance index which rose 3.0 percent in the week. The average rate for 30-year mortgages with conforming loan balances ($417,500 or less) fell 5 basis points to 4.47 percent.
Author Archives: WARREN MOSLER
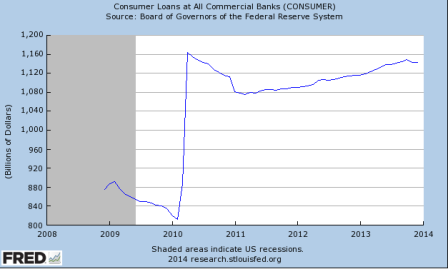
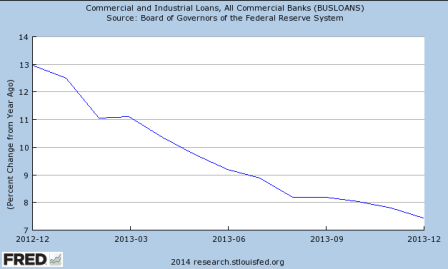
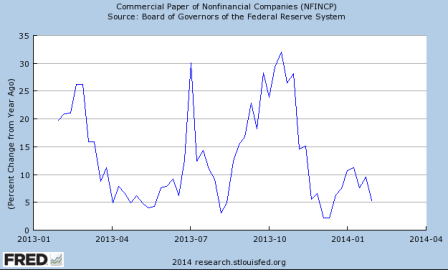
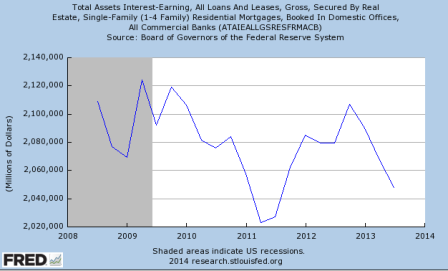
creditless economy
A few credit/lending graphs.
They all tell the same story?
Full size image
Full size image
Full size image
Full size image
GEI comments on incomes
Given this healthy economic growth, the US electorate should be thrilled happy to be part of one of the fastest growing developed economies.
Yet they are clearly less than thrilled with the economy, let alone the administration or their representatives in Congress. Why? With real household income stagnant and still below where it was in 2012, the electorates view of the economy differs substantially from these numbers.
Unlike their elected representatives, they have to deal with the real world problems of making ends meet while juggling debt loads at credit card rates. It is likely that they have a deep and abiding sense that either these numbers are a bureaucratic fiction, or (more troubling) they are benefiting someone else:
The headline unemployment numbers mask a major deformation of the work force with fewer people choosing to look for work and more being forced to accept multiple part time jobs. People on the street understand the difference between an increasing quantity of part-time work and the quality of full-time jobs.
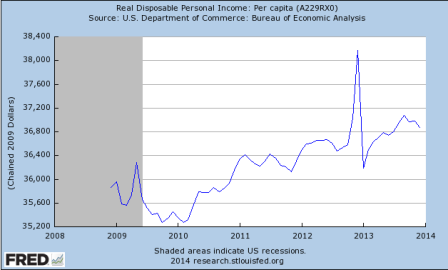
Real per capita disposable income was down -0.85% during 2013. And to maintain the prior years standard of living, the household savings rate plunged 2.3%.
For many households (and especially the 18-35 demographic) the Affordable Care Act (aka ObamaCare) will result in increased net monthly outlays for health insurance.
The per capita numbers continue to mask an ongoing shift in income distribution: although the average per capita income data has grown some 3.3% since October 2008 (per the BEA), the median household income has shrunk some 7% over that same time span (per Sentier Research). The typical member of the electorate lives at the median, and they are not sharing the growth reported by the BEA.
Chici economy
Chici economy- carless, homeless, incomeless, creditless, inventory-building economy
Car sales fell and inventories up again:
GM said its inventory ballooned to 114 days’ supply. Fiat Chrysler said its inventory amounted to 105 days worth of vehicles at January’s sales pace, up from 79 days in December. Ford’s inventory rose to 111 days. Dave Winslow, chief digital strategist at technology provider Dealer.com, said he didn’t see any reason for sales to be hurt by weather.
EM currencies to hurt US earnings translations.
Last year’s austerity measures seem to have taken their toll on disposable personal income, which ultimately supports growth:
No consumer relief via energy prices, which if anything, are a bit firmer.
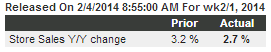
Redbook and Goldman sales today both weak, though ‘minor’ indicators:
Highlights
The trend for chain-store reports, first ICSC-Goldman earlier this morning and now Redbook, continues to slope sharply downward with Redbook’s year-on-year same-store sales rate at plus 2.7 percent in the February 1 week, driving down the 4-week average by 3 tenths to plus 3.0 percent for the lowest reading since June. Heavy and especially cold weather have been taking a toll on store sales so far this year. Watch for January reports from chain stores themselves on Thursday’s Econoday calendar.
Car sales worse than expected
I know, it was cold in January…
And the inventory to sales ratio isn’t too high based on November’s sales rate…
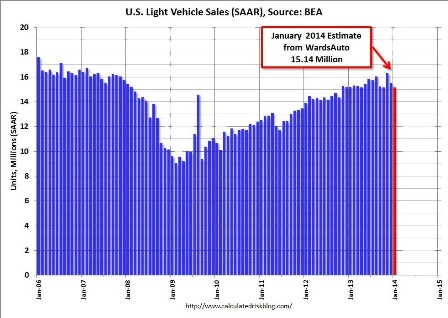
U.S. Light Vehicle Sales decrease to 15.1 million annual rate in January
By Bill McBride
Based on an estimate from WardsAuto, light vehicle sales were at a 15.14 million SAAR in January. That is down slightly from January 2013, and down 2.5% from the sales rate last month.
This was below the consensus forecast of 15.7 million SAAR (seasonally adjusted annual rate).
Full size image
The unconscious liberal
Macroeconomic Populism Returns
By Paul Krugman
February 1 (NYT) — Matthew Yglesias says what needs to be said about Argentina: theres no contradiction at all between saying that Argentina was right to follow heterodox policies in 2002, but it is wrong to be rejecting advice to curb deficits and control inflation now. I know some people find this hard to grasp, but the effects of economic policies, and the appropriate policies to follow, depend on circumstances.
Yes, unemployment- source of the greatest economic loss as well as a social tragedy and a crime against humanity, is always the evidence deficit spending is too low. There is no exception as a simple point of logic. The currency is a simple public monopoly, and the excess capacity we call unemployment- people looking to sell their labor in exchange for units of that currency- is necessarily a consequence of the monopolist restricting the supply of net financial assets.
I would add that we know what those circumstances are! Running deficits and printing lots of money are inflationary
Why the undefined ambiguous empty rhetoric?
and bad
What does ‘bad’ mean here? For example, there is no evidence that inflation rates at least up to 40% hurt real growth, and more likely help it. Politically, however, it may be ‘very bad’. But those are two different things.
in economies that are constrained by limited supply;
Limited supply of what? Labor? Hardly! In fact, full employment is even more critical, if that’s possible, when there are limited supplies of other resources. Wasn’t Rome built without electricity, oil, bulldozers, the IMF, etc. etc.? OK, it took more than a day, but it was built. There is always more to do than people to do it. Economically, unemployment is never appropriate policy.
they are good things when the problem is persistently inadequate demand.
Unemployment is the evidence of this ‘inadequate demand’ which is necessarily created by taxation, the ultimate source of all demand for a given currency. In fact, taxation functions first to create unemployment- people looking for work paid in that currency. That’s how govt provisions itself- it creates people looking for jobs with its taxation, then hires those unemployed its tax created. What sense does it make for govt to create more unemployed than it wants to hire??? Either hire the unemployed thus created, or lower the tax!!!!!!!!!!!!
Similarly, unemployment benefits probably lead to lower employment in a supply-constrained economy; they increase employment in a demand-constrained economy; and so on.
With more that needs to be done than there are people to do it, the economy isn’t supply constrained until full employment. And nominal unemployment benefits are about the level of prices, wages, and the distribution of income rather than the level of potential employment, etc.
So sometimes the relationship and money looks like this, from the best economics principles textbook:
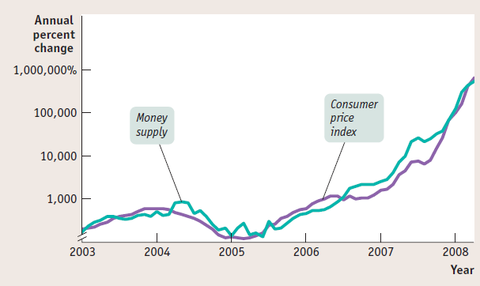
This is more about ‘inflation’ causing ‘money’ as defined.
But sometimes it looks like this:
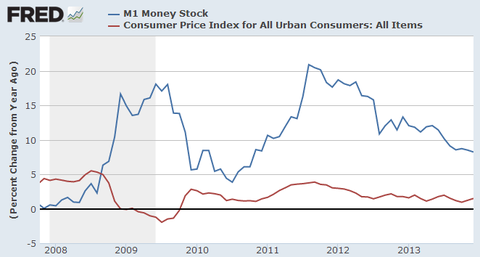
This is more about partially defining ‘money’ as reserve account balances at the Fed but not securities account balances (tsy secs) at the Fed.
And just to repeat a point Ive made many times, those of us who understood IS-LM predicted in advance that the actions of the Bernanke Fed wouldnt be inflationary, while the other side of the debate was screaming debasement.
It’s not about ISLM, which is fixed fx analysis. It’s about recognizing that there is always precious little difference between balances in reserve accounts at the Fed and securities accounts at the Fed.
There’s something else to be said about Argentina and, it seems, Turkey namely, that were seeing a mini-revival of what Rudi Dornbusch and Sebastian Edwards long ago called macroeconomic populism. This involves, you might say, making the symmetrical error to that of people who think that running deficits and printing money always turns you into Zimbabwe; its the belief that the orthodox rules never apply. And its an equally severe mistake.
Unfortunately most of the ‘orthodox rules’ apply to the fixed fx policies in place when they were first stated, and not to today’s floating fx.
Its not a common mistake these days; a few years ago one would have said that only Venezuela was making the old mistakes, and even now its just a handful of countries. But it is a mistake, and we need to say so.
Yes, mistakes are being made by all of the headline economists and the global economy is paying the price.
PMI, ISM, Construction Spending, car sales preview
Might be a reversal in out sized +1.3 contribution to GDP from exports coming?
And EM and yen currency weakness not helping US exports, while US earnings translations also getting hurt.

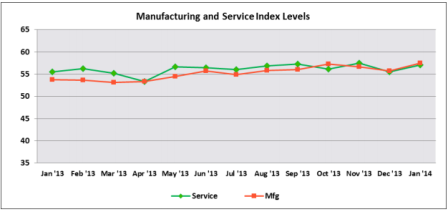
Highlights
Growth in composite activity slowed a bit last month for Markit’s US manufacturing sample where the PMI posted a final January reading of 53.7, unchanged from the flash reading at mid-month and down 1.3 points from final December.
Weakness in order readings is the key negative in the January report. Monthly growth in new orders slowed 2.1 points from final December to 53.9 which, nevertheless, is a respectable rate. The other two order readings in the sample, however, moved below 50 and into contraction in the month with new export orders at 48.4 for a 3.0 point loss and backlog orders down 3.6 points to 49.2.
Lack of orders points to weakness ahead for output where growth already slowed markedly in January, down 4 points to 53.5. Lack of orders is also a negative for employment which fell 8 tenths to 53.2.
Inventory readings show noticeable draws that suggest manufacturers, looking down the road at weakness in new orders, aren’t actively restocking, while price readings show marginal and easing pressure. The easing in price pressures is important to note at this time of year, suggesting that manufacturers aren’t getting much price traction yet for beginning-of-year price increases.
Most readings on manufacturing began to improve until late in the fourth quarter with today’s report not pointing to any rebound at the beginning of the first quarter. Watch later this morning on the Econoday calendar for the closely watched ISM report which has been consistently offering some of the strongest readings of all on the manufacturing economy.
Still positive, but maybe moving back to the ‘pre inventory building’ pace of the last few reports?
The bad news is centered, unfortunately, in new orders which are down a very steep 13.2 points to 51.3. This is one of the largest monthly declines on record. If there is solace, it’s that the plus-50 rate of 51.3 rate still points to monthly growth, just at a much much slower pace than December.
And new export orders fell a point here as well.
Chart looking very tame, even with housing strength which may be the expiring year end tax credit thing:
Strength was in private residential outlays which jumped 2.6 percent in December, following a 1.1 percent rise the month before.
GM car sales down, with GM now estimating only a 15.3 million annual rate of total vehicle sales for Jan vs 15.4 in Dec.
Final numbers later today:
payroll tax receipts down
Solid Recovery in the January Credit Managers’ Index
December dip reversed:
Full size image
Solid Recovery in the January Credit Managers’ Index
National Association of Credit Managements CMI report for January encourages, rebounds to 57.3. Main indices improved and all sub-indices are now out of contraction territory, indicating December was the likely the anomaly.
January 30 — Januarys reading for the Credit Managers Index (CMI) from the National Association of Credit Management (NACM) rebounded to 57.3, the highest point reached in over a year and even more robust than the 57.1 notched in November. This now begs the question, which of the last three months is signaling the real trend? The November CMI hit a two-year high followed by a December low that took the index back to summer levels and now the January is back to highs not seen in two years. In December, there was a palpable gloom falling over the economy where the data was concerned. The December CMI recorded a low not seen since July and it looked as if all the gains that started to accumulate in the third and fourth quarters were evaporating. The January data dispels that mood a little.
The factors comprising the CMI provide more insight. All of the favorable factors improved in January. Sales regained some of its former momentum and climbed back into the 60s to 61.5 after falling to 58.7 last month. Granted, this is still on the low end of the 60s, but is trending in a more positive direction. New credit applications rose from 57.2 to 58.2, with the biggest improvement occurring in dollar collections, which jumped from 58.7 to 60.9, its first time over 60 since October. There was also a very significant jump in amount of credit extended from 62.6 to 65.4, marking its first time cresting over 65 since May. Finally, amount of credit extended hasnt been this high in almost three years and shows that credit is far more accessible now than it has been in some time. The favorable factor index regained a little of its luster and is back in the 60s with a fairly comfortable margin of 61.5 compared to Decembers 59.3.
The unfavorable factor index also provided some good news. The majority of the factors showed improvement and some truly regained the momentum that had been building in the months prior to December. Rejections of credit applications remained stable, moving up from 54.5 to 54.6, which is certainly better than the stagnant course recorded in the last few months. The reading hit the bottom of a downward trend in May at 50.8 and barely budged from June on. Accounts placed for collection improved quite a bit from 53.4 to 55.2, suggesting the little slump recorded at the end of the year did not force many companies into a state of distress. There was similar improvement in disputes from 50.7 to 52.2, which washed away end-of-year worries that struggling companies would be pushed over the edge and would start to become a challenge from a collection point of view. Dollar amount beyond terms was one of the big gainers, jumping out of contraction territory from Decembers 49.7 to Januarys 52.8. Finally, dollar amount of customer deductions stayed almost the same, improving very slightly from 51.5 to 51.6 and filings for bankruptcies posted a nice improvement from 59.0 to 60.5. Overall, the unfavorable factor index steadied more than many had expected with its bump from 53.1 to 54.5.
The numbers posted in the December CMI were anything but inspiring and seemed to match a general lack of enthusiasm in the economy, said NACM Economist Chris Kuehl, PhD. It was suggested that the low reading was likely an anomaly and, with the rebound in January, it now appears this is the case. The next set of data will attract a lot of attention as analysts seek to determine whether there is a clear trend back to more positive readings and if this will occur on a more consistent basis.
Employment cost index, Personal income, Spending, and Saudi output
Still tame (with a hint of moving up some) particularly in comparison to the last cycle which was considered relatively tame:
Personal Consumption had a nice spike up in November:
But without the income to sustain it? (Ignore the latest yoy data point ‘dip’ as it’s from the spike a year ago. Just look at the last few monthly data points)
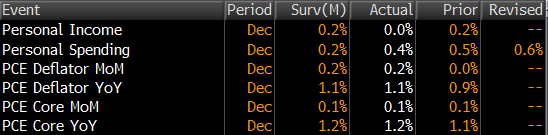
Highlights
Personal income was flat in December while spending was up. Income sluggishness may have been weather related. Personal income was unchanged after rising 0.2 percent in November. Markets expected a 0.2 percent rise. The wages & salaries component posted flat in December, following a 0.5 percent boost the month before.
Personal spending, however, was moderately strong, rising 0.4 percent after a 0.6 percent boost in November. Spending was led by a 1.5 percent jump in nondurables with services gaining 0.4 percent. Durables declined 1.8 percent after a 1.8 percent increase the month before.
The rise in personal consumption was not just price related. Real spending increased 0.2 percent in December after an increase of 0.6 percent in November.
Meanwhile, Saudi oil output, which indicates the net demand for global crude, keeps them in the sweet spot as swing producer/price setter:
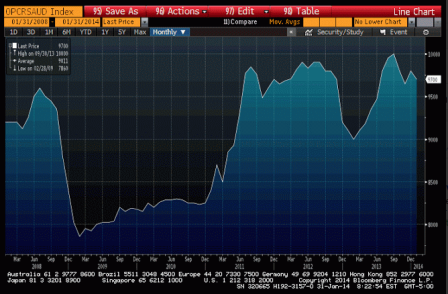
Full size image