No surge here:

No ‘surge’ happening and Q1 GDP at risk as well from collapse of oil and gas investment:
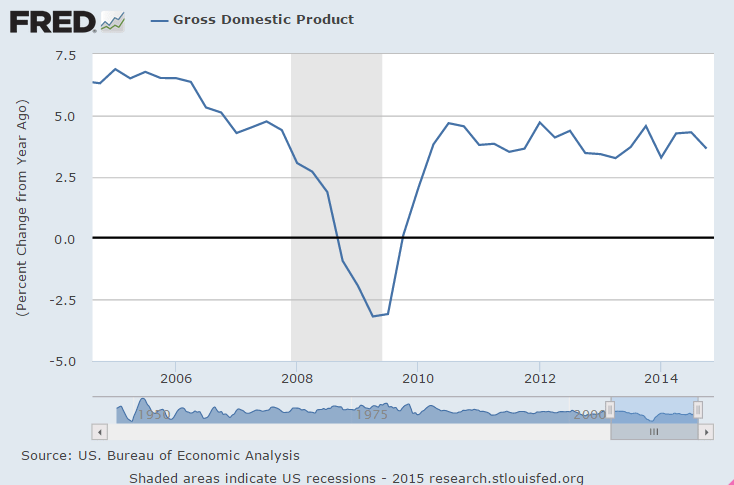
GDP Growth Slows to 2.2% in 4Q, revised lower but still better than expected
Latest figures indicate breakout pace of growth in the second and third quarters was unsustainable. The latest figures indicate the breakout 5% pace in the third quarter and 4.6% in the second quarter were unsustainable. For 2014 as a whole, GDP expanded 2.4%, slightly better than the average 2.2% growth of 2010-2013. By comparison, the economy grew an average 3.4% a year during the 1990s. Real personal consumption expenditures increased 4.2% in the 4Q, compared with an increase of 3.2% in the 3Q.
This is nominal GDP (not inflation adjusted):
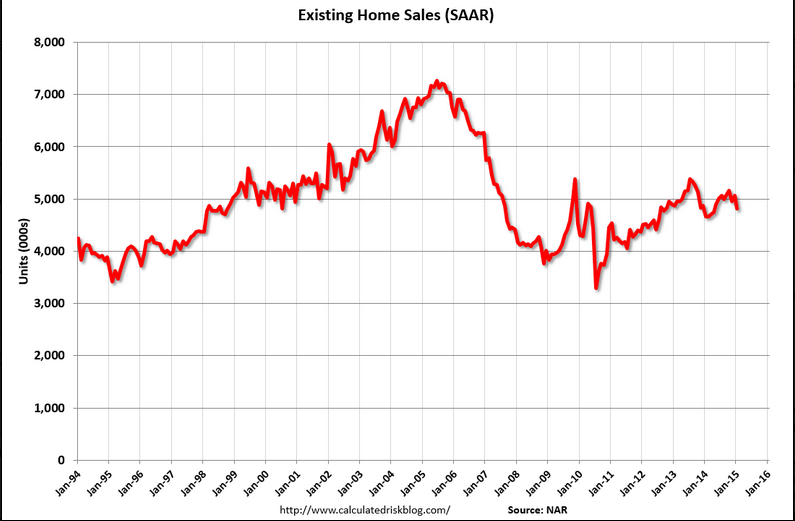
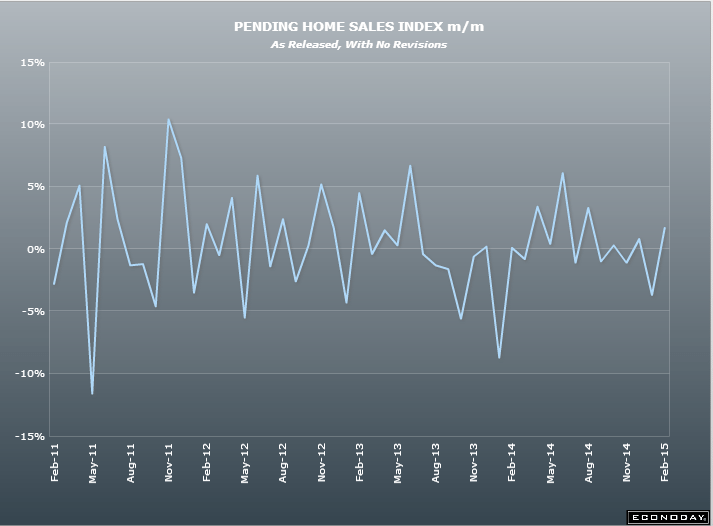
NAR: Pending Home Sales Rise in January to Highest Level in 18 Months, climbed 1.7% to 104.2 in January from an upwardly revised 102.5 in December and is now 8.4% above January 2014 (96.1). Improved buyer demand at the beginning of 2015 pushed pending home sales in January to their highest level since August 2013. All major regions except for the Midwest saw gains in activity in January. NAR chief economist, says “Contract activity is convincingly up compared to a year ago despite comparable inventory levels,” he said. “The difference this year is the positive factors supporting stronger sales, such as slightly improving credit conditions, more jobs and slower price growth.” “All indications point to modest sales gains as we head into the spring buying season,” “However, the pace will greatly depend on how much upward pressure the impact of low inventory will have on home prices. Appreciation anywhere near double-digits isn’t healthy or sustainable in the current economic environment.” Total existing-homes sales in 2015 are forecast to be around 5.26 million, an increase of 6.4% from 2014. The national median existing-home price for all of this year is expected to increase near 5%. In 2014, existing-home sales declined 2.9% and prices rose 5.7%.
Looks to me like a dip and a recovery before and then after mtg rules were altered in Jan.
With the ‘average’ still near 0:
ISM Chicago Business Barometer At 5½-Year Low, Down 13.6 Points to 45.8 in February.
Production, New Orders, Backlogs Suffer Double Digit Declines.
LA port strike being blamed for some of the decline:
U of M Consumer Sentiment fell to 95,4 in February (final) from 98.1 in January.
Consumer optimism was affected by lower gas prices and an unusually harsh winter. The small overall decline from January still left consumer confidence at the highest levels in eight years
This is one man one vote, not one $ one vote:
I still don’t see any evidence of a ‘boost’ from lower oil prices.
If anything, it’s all gotten a lot softer instead…
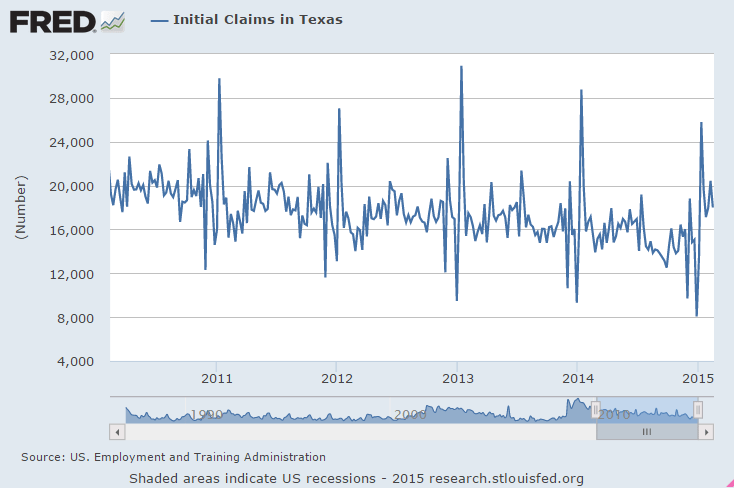
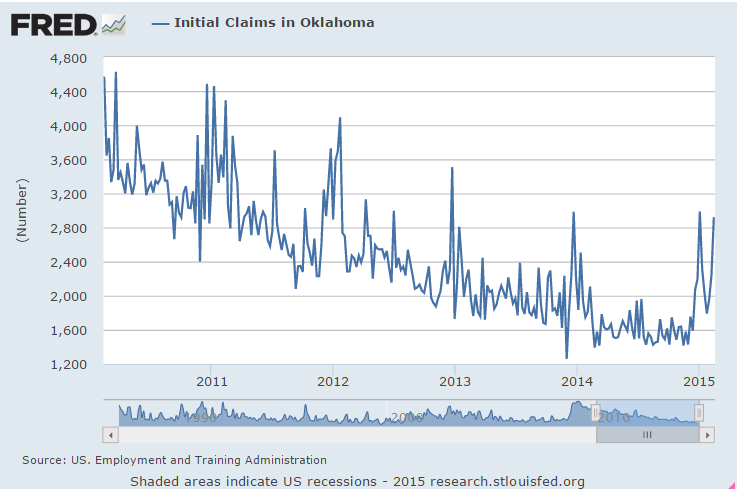
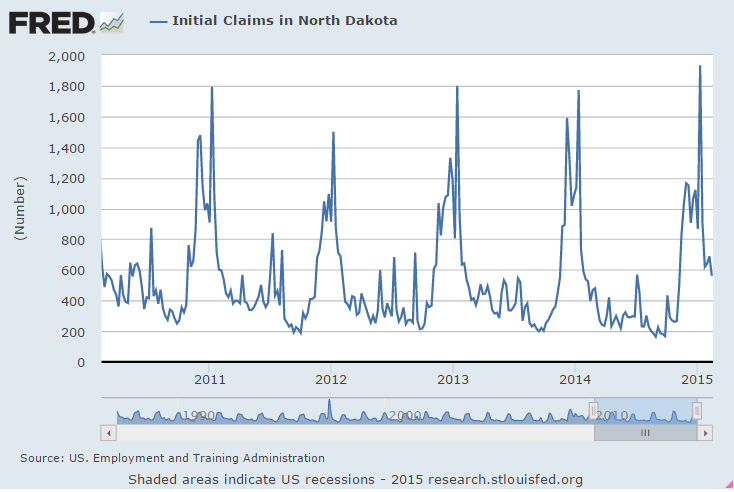
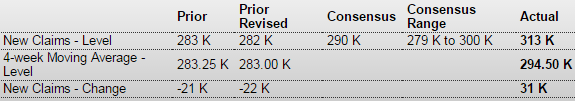
Jobless Claims
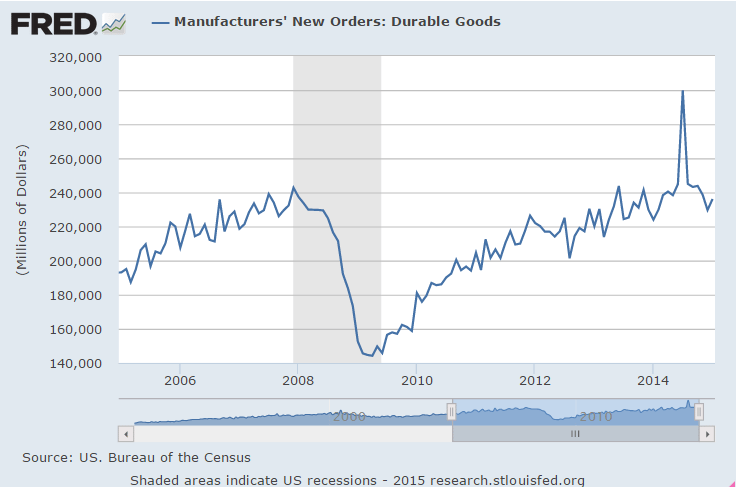
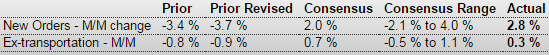
Durable Goods Orders
Capital Goods Shipments ex Air Y/Y:
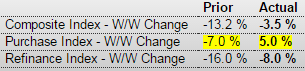
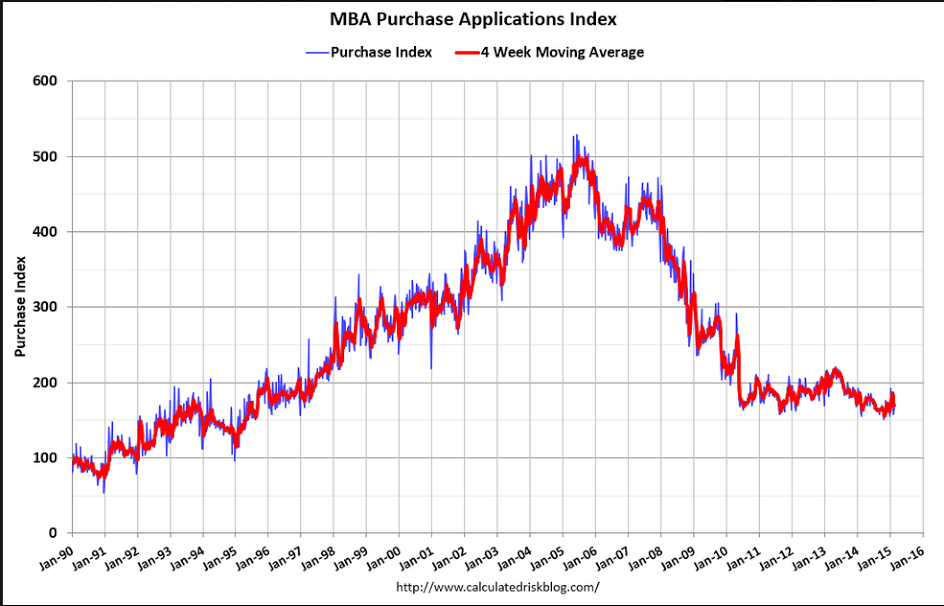
MBA Purchase Applications
Highlights
The purchase index ended 6 straight weeks of decline with a 5.0 percent rise in the February 20 week. Year-on-year, however, the index is in negative ground at minus 2.0 percent. The refinance index keeps falling, down 8.0 percent in the latest week for the 3rd straight large decline. Rates rose in the latest week with the average 30-year mortgage for conforming loans ($417,000 or less) up 6 basis points to 3.99 percent.
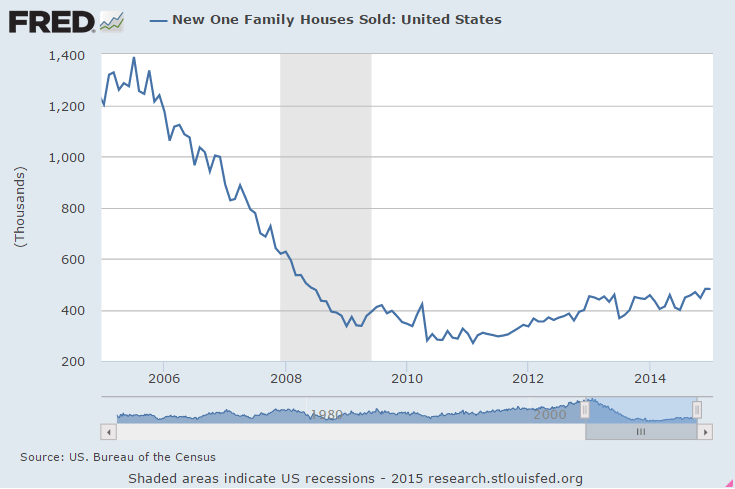
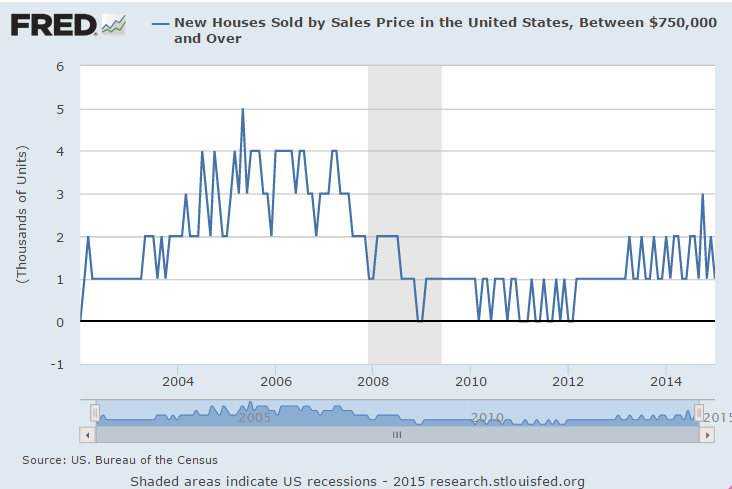
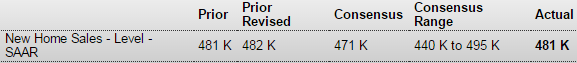
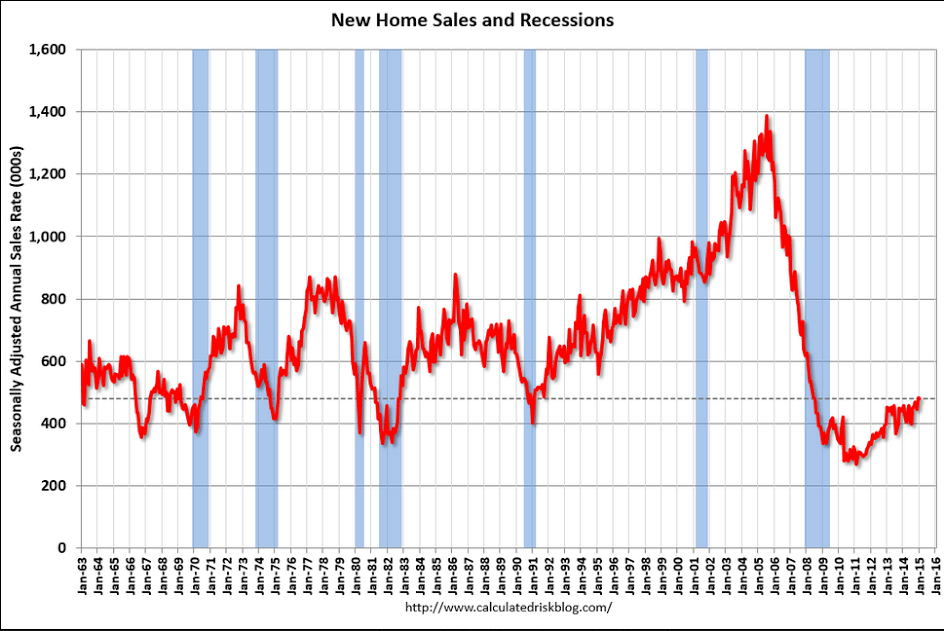
New Home Sales
Highlights
Sales of new homes in January, at a better-than-expected 481,000 annual pace, managed to hold onto December’s big surge when sales jumped 8.1 percent to 482,000 (revised). January’s strength is centered in what is by far the largest region, the South, where sales rose 2.2 percent. Sales slipped 0.8 percent in the West which is second, and a very distant second, in size to the South.Price concessions may have helped sales as the median fell 2.6 percent to $294,000. The dip is minor and the year-on-year median is still up significantly at plus 9.1 percent, but it does underscore price weakness in Monday’s existing home sales report.
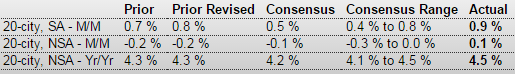
S&P Case-Shiller HPI
Highlights
Sales of existing homes may be slow but price traction is appearing, at least it did in December as Case-Shiller’s adjusted 20-city index shows a sharp month-on-month gain of 0.9 percent. This is the strongest monthly gain since March last year. Year-on-year growth, which had been slowing from the low double digits this time last year, is now leveling, at plus 4.5 percent vs November’s 4.3 percent which is the first gain for this reading since way back in November 2013.Consumer Confidence
Richmond Fed Manufacturing Index
Recent History Of This Indicator
The Richmond Fed manufacturing index slipped 1 point in January to plus 6. Growth in new orders, at 4, was steady but moderate while the draw in backlog orders picked up, to minus 9 from minus 5. Production, fed by the working down in backlogs, actually accelerated 5 points in the month to plus 10 but this pace can’t be sustained unless new orders pick up.PMI Services Flash
Highlights
A strong rebound in new work helped give a boost to Markit’s US service sector sample where the index rose to a 4-month high of 57.0. This compares with 54.2 in final January at 54.0 in the January flash.
Hiring is up this month in the sample as are backlogs. The outlook, however, is at a 4-month low, echoing similar weakness in last week’s Empire State and Philly Fed reports out of the manufacturing sector. Price readings remain low but did edge higher from January.
Greece gets to choose its own poison:
Greece Delays Awaited Reform Proposals Until Tuesday
Feb 23 (WSJ) — Greece’s government pushed back until early Tuesday a list of awaited reforms that its eurozone partners had demanded in exchange for continuing to fund the country for another few months. Greek officials said late Monday that the list would be sent the following morning, past the original midnight deadline. Eurozone finance ministers are due to review the proposed reforms during a conference call Tuesday afternoon. “We are still expecting the list today, but if it comes at 6 a.m. tomorrow morning then that’s OK for us,” said a European Union official in Brussels. The important thing, the official added, was for the measures to comply with the terms of Greece’s bailout program and that the proposals arrive ahead of Tuesday afternoon’s teleconference.
Greece submits reform proposals to creditors
By Holly Ellyatt
Feb 1 (CNBC) — Greece’s Finance Minister Yanis Varoufakis sent a list of reform proposals to the euro zone at around midnight on Monday, just making a deadline set by its international creditors.
A Greek government source confirmed that the reform measures were sent to the Eurogroup of euro zone finance ministers for approval. They will also need to be approved by the so-called “troika” overseeing the country’s bailout, made up of the International Monetary Fund, European Commission and European Central Bank.
A source close to the European Commission said they were “encouraged” by Greece’s “strong commitment” to combat tax evasion and corruption, Reuters reported. These were among the proposals according to a list released by the Greek government’s press office.
“In the Commission’s view, this list is sufficiently comprehensive to be a valid starting point for a successful conclusion of the review,” the source said, according to Reuters.
Other proposals included pledges to reform tax policy, consolidate pension funds and to eliminate incentives for early retirement. In addition, the proposals include plans to review and control public spending, and commitments not to roll back privatizations that have been completed.
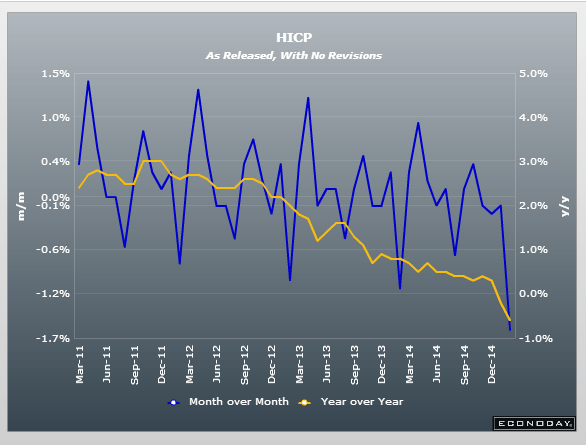
Euro inflation even with the weak euro!
Again, with mtg purchase apps down and cash sales down why expect this to go up?
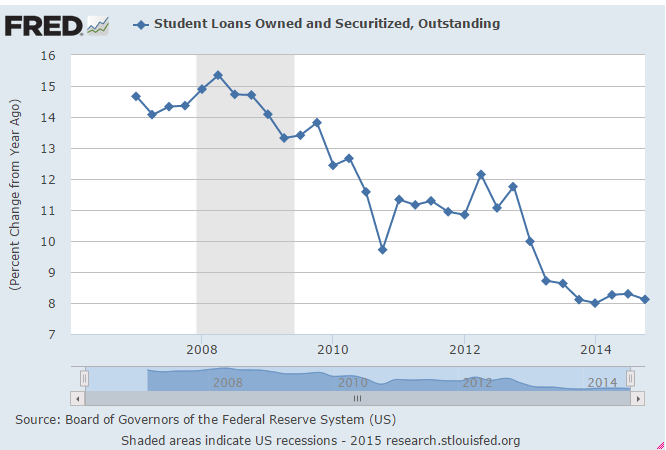
And with the oil credit expansion over it could get worse.
Existing Home Sales
Highlights
Despite a strong jobs market and low mortgage rates, demand for housing, whether for existing or new homes, remains flat. Sales of existing homes in January fell a very steep 4.9 percent to an annual rate of 4.82 million which is the lowest rate since April last year. All regions show single-digit declines with the West the deepest, at minus 7.1 percent. Declines hit both single-family homes, at minus 5.1 percent, and condos, at minus 3.5 percent.
Price concessions didn’t help the month’s sales with the median down 4.1 percent to $199,600. This is the first reading below $200,000 since March last year. The drop in sales made for a sizable rise in inventory relative to sales, to 4.7 months vs December’s 4.4 months.
The lack of sales punch has the National Association of Realtors wondering. The NAR says it’s “puzzled” that homeowners are now staying in their homes 10 years on average vs the long term average of 7 years, saying that homeowners may be happy with their mortgage rates and are perhaps doubtful that housing will rebound.
Dallas Fed Mfg Survey
Highlights
The latest regional Fed survey on manufacturing points to weakness in the manufacturing sector in February.
Texas factory activity posted a second month of no growth in February, according to business executives responding to the Texas Manufacturing Outlook Survey. The production index, a key measure of state manufacturing conditions, remained near zero (0.7) and indicated output was essentially unchanged from January levels.
Other measures of current manufacturing activity reflected contraction in February. The new orders index pushed further into negative territory, coming in at minus 12.2, its lowest reading since June 2009. The shipments index fell to minus 3.3, also reaching a low not seen since 2009. The capacity utilization index turned negative as well, dropping from 5.1 to minus 4.9.
Perceptions of broader business conditions remained rather pessimistic this month. The general business activity index moved further negative to minus 11.2, posting its lowest reading in nearly two years. The company outlook index remained slightly negative and edged down from -3.8 to -4.4.
Labor market indicators reflected only minor employment growth and slightly shorter workweeks. The February employment index moved down from 9 to 1.3. Fifteen percent of firms reported net hiring, compared with 14 percent reporting net layoffs. The hours worked index edged further into negative territory, coming in at minus1.6.
Prices fell slightly in February and upward pressure on wages continued to ease. The raw materials prices index held steady at minus1.7, indicating marginal downward pressure on input costs. The finished goods prices index was also slightly negative but edged up from minus 6.7 to minus 4.4. Manufacturers are no longer expecting sizeable price increases six months ahead, as the indexes of future prices were in single digits this month, down markedly from 2014 readings. The wages and benefits index edged down for a second month in a row and came in at 16.8.
Expectations regarding future business conditions rebounded somewhat in February. The index of future general business activity shot up 12 points to 5.5 after posting a negative reading in January. The index of future company outlook rose nearly 10 points to 11.8, although it remains well below the index level seen throughout 2014. Indexes for future manufacturing activity showed mixed movements in February but remained in solidly positive territory.
The latest Dallas Fed report plays into the hands of the doves on the FOMC. Manufacturing activity is weak and inflation pressures are non-existent currently. It will be interesting to hear Dallas Fed president Richard Fisher’s comments in speech since he has been hawkish. Fed chair Janet Yellen will be speaking to Congress this Tuesday and Wednesday and likely will comment on sector strengths and weakness and on price pressures.
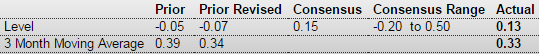
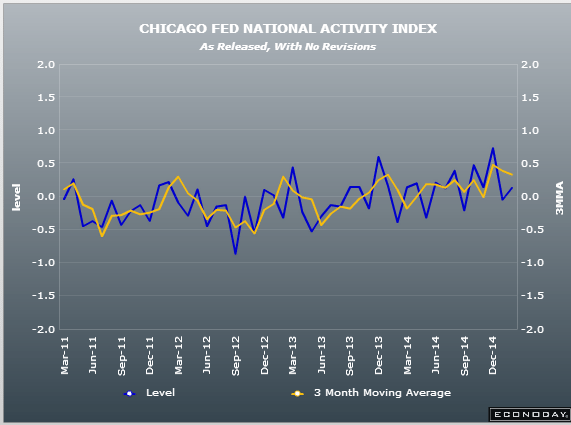
Chicago Fed National Activity Index
Highlights
January was a good month for the economy based on the national activity index which jumped back into the plus column, to 0.13 from December’s revised minus 0.7. The 3-month average is very strong, little changed at plus 0.33.
The big swing factor for January is production-related indicators which rose to plus 0.02 from December’s minus 0.22 in a gain driven by a swing higher for industrial production. The negative reading from consumption & housing improved to minus 0.10 from minus 0.13 while the contribution from sales/orders/inventories held unchanged at plus 0.03. Employment remains a big plus but, due to a tick higher for the unemployment rate to 5.7 percent, a little less so, at plus 0.18 from plus 0.28.
More US consumption of imports indicated here as well as with US trade data, as US growth continues to get downgraded post oil price collapse:
Japan’s annual exports jump most since late 2013 in boost to economy
May 25 (Reuters) — Japan’s annual exports in January jumped the most since late 2013. The 17.0 percent year-on-year gain in exports marked the fifth straight month of increase, supported by brisk shipments of cars to the United States and of electronics parts to Asia. The export data followed a 12.8 percent rise in December.
And US exports looking suspect as well:
Growth remains steady in Markit’s US manufacturing sample where the flash February reading is holding little changed, at 54.3 vs 53.9 at month-end January and 53.7 at mid-month January. The plus side is led by production volumes, which are at a 4-month high. Dragging on the index are slower growth in employment, the slowest in 7 months, and slower growth in new business, the slowest in 13 months and weighed down especially by weakness in exports and also by weakness among oil & gas customers.
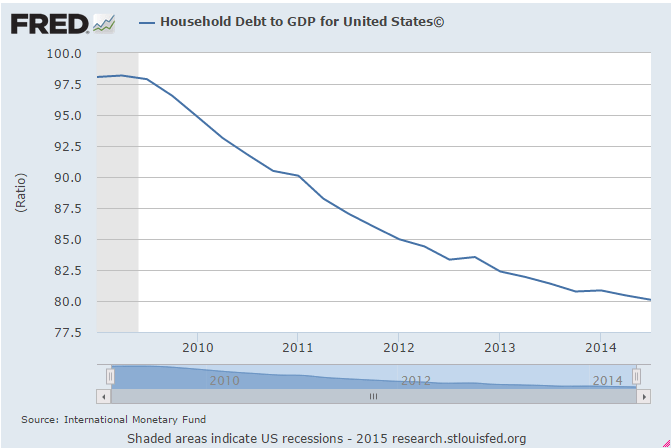
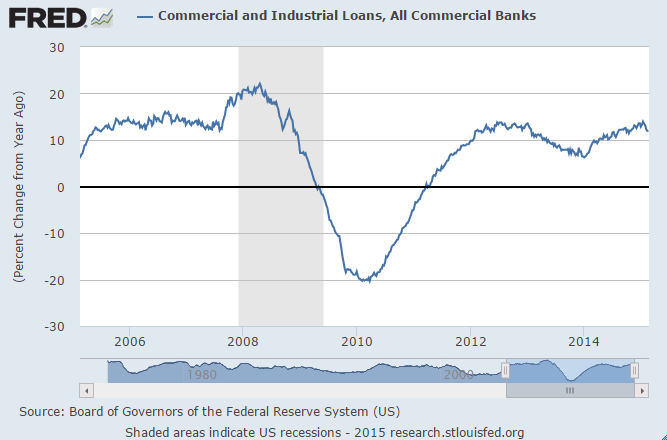
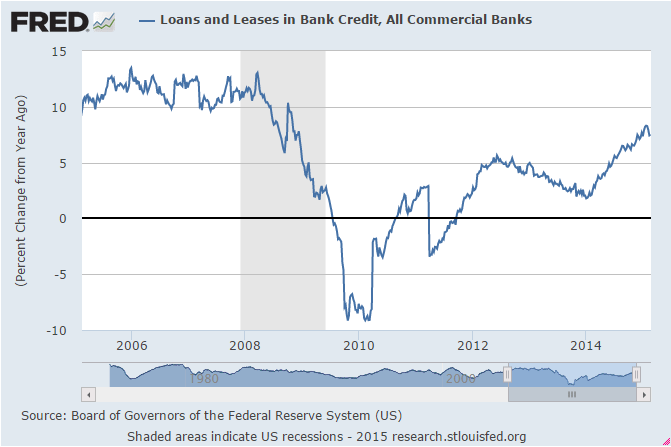
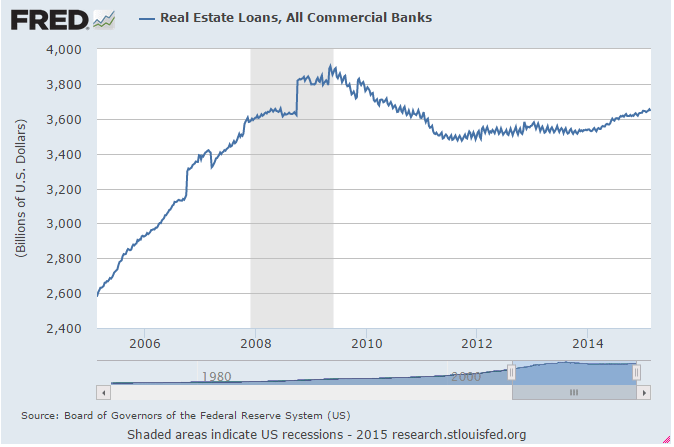
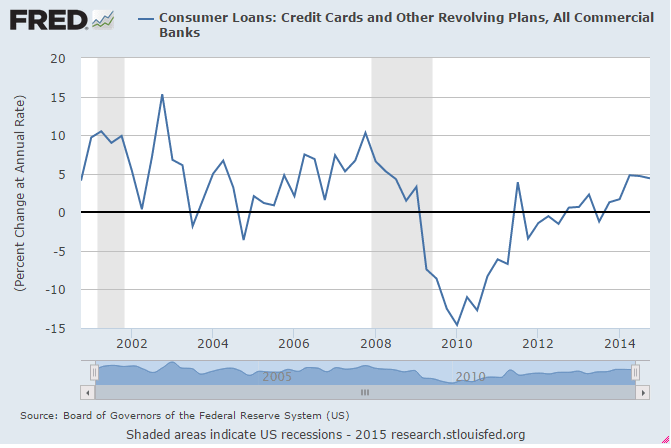
As the US demand leakages (agents spending less than their incomes) grow relentlessly, I look for the deficit spending required to sustain GDP growth. Turns out last year it came from the energy sector which ended abruptly in Q4 2014, with GDP growth sagging accordingly. And so far no sign of a credit expansion from the household sector. You can argue debt is more affordable, but not that it’s happening: