State deficits turning to surplus

Just like any other agent, when they spend more than their income they are adding that much to growth, and as their deficits fall the are net adding that much less.

States Weigh New Plans for Revenue Windfalls

By Mark Peters

January 26 (WSJ) — Governors across the U.S. are proposing tax cuts, increases in school spending and college-tuition freezes. The strengthening in tax revenue started in late 2012 as higher-income residents in many states took increased capital gains among other steps to avoid rising federal tax rates on certain income. Those tax payments spilled over into 2013, and further fuel for collections came from a record stock market and improving economy. State tax revenue nationally climbed 6.7% in the fiscal year ended June 30, 2013, Moody’s Analytics says. Still, state spending last year remained below peak levels in 2008 when adjusted for inflation, while state reserves hit their highest level since the recession, reaching a total of $67 billion nationally, or 9.6% of state spending, according to a report last month from the National Association of State Budget Officers.

Interest rates and consumption

Who would have thought?
;)

Thanks Art.

The equation at the core of modern macro

By Noah Smith

“…the Euler Equation says that if interest rates are high, you put off consumption more. That makes sense, right? Money markets basically pay you not to consume today. The more they pay you, the more you should keep your money in the money market and wait to consume until tomorrow. But what Canzoneri et al. show is that this is not how people behave. The times when interest rates are high are times when people tend to be consuming more, not less.”

new home sales

Who would have thought that with purchase apps down 10% year over year sales would fall?

So seems like borrowers aren’t stepping up to the higher mortgage rates demanded by lenders fearful of future fed rate hiking?

That means the economy stalls and the Fed doesn’t hike?


Highlights
New home sales had been a bright spot in the housing sector — but not any more. Sales of new homes nose dived in December, to a 414,000 annual rate that’s below the low end estimate of Econoday’s consensus. More bad news comes from downward revisions that total 30,000 in the prior two months.

The drop in sales gave a lift to supply, at least supply relative to sales which is at 5.0 months vs 4.7 months in November. But the total number of new homes on the market actually fell, down 5,000 to an adjusted 171,000.

High prices are no doubt a factor behind the sales weakness but not a pronounced factor. The median price rose 0.6 percent to $270,200 with the year-on-year rate very modest at plus 4.6 percent which is right in line with the plus 4.6 percent year-on-year rate for sales.

Bad weather may have played a factor in December’s disappointment but heavy weather is common to all Decembers. Unattractive mortgage rates and the still soft jobs market appear to be holding down housing noticeably. On Thursday, watch for pending home sales data which track initial contract signings for sales of existing homes. The Dow is little changed following today’s results.

And note the downward slope of the last three prints:

Emerging market currencies

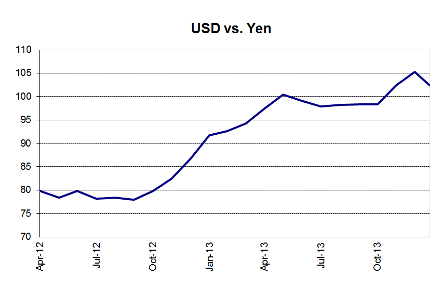
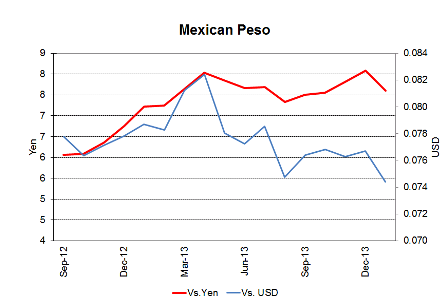
Seems no one is pointing out how this is all looking a lot like ‘catch up’ vs last year’s yen move?

As previously discussed, the proactive yen move from under 80 to over 100 vs the dollar- a 30% or so pay cut for domestic workers in terms of prices of imports- was an internationally deflationary impulse.

It’s called ‘currency wars’ with the exporters pushing hard on their govts to do whatever it takes to keep them ‘competitive’. And all, at least to me, shamelessly thinly disguised as anything but. And, in fact, it’s not ‘wrong’ to call it ‘dollar appreciation’ rather than EM currency depreciation given the deflationary bias of US (and EU) fiscal and monetary (rate cuts/QE reduce interest income for the economy) policy.

This is a highly deflationary force for the US (and EU) via import prices and lost export pricing power, also hurting earnings translations and, in general weakening US domestic demand, as increased domestic oil output doesn’t reduce net imports as much as would otherwise be the case.

And while I’m not saying energy independence is a ‘bad thing’ note that the UK has been largely ‘energy independent’ for quite a while, so there’s obviously more to it.

The optimal policy move for the US is fiscal relaxation- like my proposed FICA suspension- to get us back to full employment and optimize our real terms of trade. (and not to forget the federally funded transition job for anyone willing and able to work to facilitate the transition from unemployment to private sector employment as the economy booms).

But unfortunately Congress is going the other way and making it all that much worse.

Emerging market currencies take a battering

By Katrina Bishop

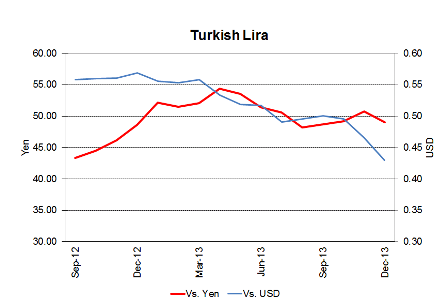
January 24 (CNBC) — Emerging market currencies continued to take a beating on Friday — with Turkey’s lira hitting a new record low against the dollar yet again — amid growing concerns about the U.S. Federal Reserve’s monetary guidance.

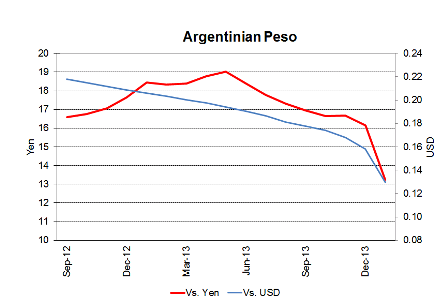
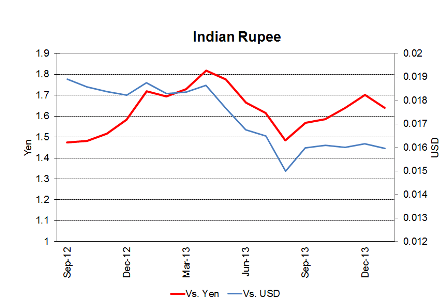
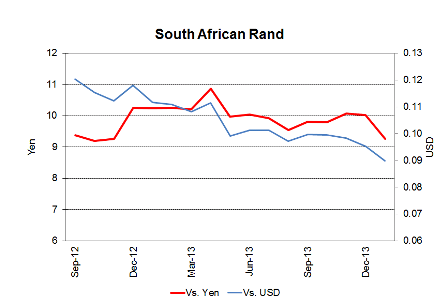
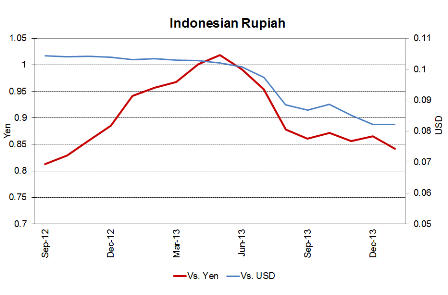
On Friday, the dollar strengthened to 2.3084 against Turkey’s currency. Investors also piled out of the South African rand and Argentina’s peso, and both the Indian rupee and the Indonesian rupiah fell to two-week lows against the dollar. Meanwhile, the Australian dollar fell to $0.8681 – its lowest level in three-and-a-half years.

“The market is in panic mode. We have huge psychological fear that is going to emerging markets, despite a global environment that hasn’t changed that much,” Benoit Anne, head of global emerging market strategy at Societe Generale, told CNBC.

“My bias at this stage — although it’s a bold one — is that this is all about the credibility of the Fed with respect to its forward guidance. This fear that the Fed is going to tighten quicker than expected is translating into emerging markets.”

The U.S. central bank has promised that it will not raise interest rates until unemployment hits 6.5 percent – but some analysts are concerned that rate hikes could come sooner than expected.

U.S. monetary policy has always had a significant on emerging markets, and the Fed’s bond-buying program boosted risk sentiment, causing investors to turn their back on so-called “safe havens” and pile into assets seen as riskier – such as emerging market currencies.

Speculation of Fed tapering in 2013 hit emerging markets hard, with currencies including India, Turkey, Russia and Brazil coming under intense pressure in 2013.
But Anne added these recent moves were likely to be more temporary.

“It’s a matter of weeks rather than the whole year 2014 as a total write off for emerging markets,” he said. “Although it will take the Fed re-establishing its credibility towards forward guidance before we see respite in emerging markets.”

Capex growth to slow

For the economy to grow faster, seems all the pieces, ‘on average’ have to grow faster?

Hopefully it picks up as most forecast, but seems to me the deficit maybe has gotten too small for the demand leakages, and all that follows from that…

US capex to grow at slowest rate in four years

(FT) Total capital expenditure by the non-financial companies in the S&P 500 index is forecast to rise by just 1.2 per cent in the 12 months to October, according to Factset, a market data company that compiles a consensus of analysts’ forecasts. In aggregate, analysts’ forecasts indicated the slowest growth in capital spending by the largest US companies since it declined in 2010, in the aftermath of the recession of 2007-09. The total net debt of non-financial companies in the S&P 500 has dropped from seven times earnings before interest, tax, depreciation and amortisation at the end of 2007 to just three times by last October, according to Factset. Spending by companies in the S&P 1200 global index increased by 15 per cent in 2011 and 11.3 per cent in 2012, but it was unchanged in the first six months of 2013 compared to the equivalent period of the previous year, according to S&P Capital IQ.

wrko Interview And Expiring Tax Extenders Recap

Warren Mosler on the Economy

Main provisions Expiring:
Housing credits- low income credits, deductible mortgage premiums
Energy Efficient Residential construction/appliances
Energy Efficient Commercial buildings/construction
Renewable Energy construction/production credits- notably wind

These may all have caused Q4 jumps in construction etc. Quarterly/monthly data for energy efficient construction and renewable production is not available for comparison, figures are usually collected annually.

Other things that stick out:
Alternative/Renewable fuels credit- Will probably see decrease in production
Research and experimentation credit

existing home sales, jobless claims

Highlights
Sales of existing homes bounced back in December from a very weak November but not by much, at plus 1.0 percent for a slightly lower-than-expected annual rate of 4.87 million units.

The outlook for future sales is not good, at least based on available supply of homes on the market which fell sharply to 4.6 months from 5.1 months in November. Rising prices are another negative for the sales outlook, up 1.3 percent for the median to $198,000. At plus 9.9 percent, the year-on-year rate for the median price contrasts sharply with the year-on-year sales rate of minus 0.6 percent.

I’m not yet saying claims have bottomed, but can’t say they haven’t either

At a lower-than-expected 326,000 in the January 18 week, initial jobless claims, which at year-end were not signaling improvement in the labor market, are now signaling at least some improvement. The Econoday consensus had been looking for 330,000. The 4-week average is down 3,750 to 331,500 which is more than 10,000 lower than the month-ago comparison to offer an indication of strength for the January employment report.

But in a partial offset, continuing claims are not coming down. Continuing claims, which are reported with a 1-week lag, rose 34,000 in the January 11 week to 3.056 million for a second straight reading over 3.0 million. Continuing claims had held below 3.0 million through the second half of last year. The 4-week average is up 31,000 in the week to 2.939 million which is the highest reading since August. The unemployment rate for insured workers, which had been as low as 2.1 percent in November, is steady for a second straight week at 2.3 percent.