2008-03-13 US Economic Releases

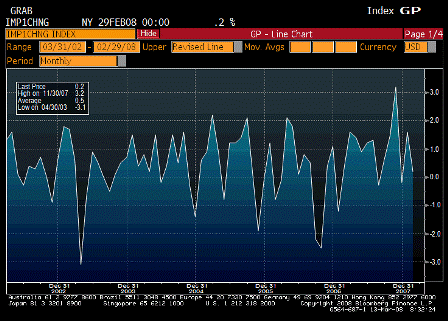
2008-03-13 Import Price Index MoM

Import Price Index MoM (Feb)

Survey 0.8%
Actual 0.2%
Prior 1.7%
Revised 1.6%

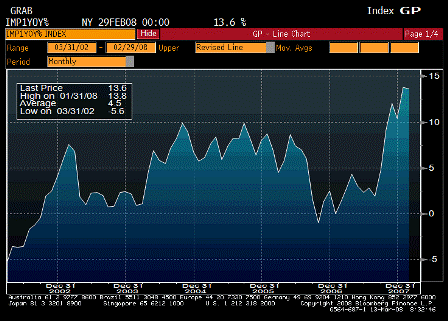
2008-03-13 Import Price Index YoY

Import Price Index YoY (Feb)

Survey n/a
Actual 13.6%
Prior 13.7%
Revised 13.8%

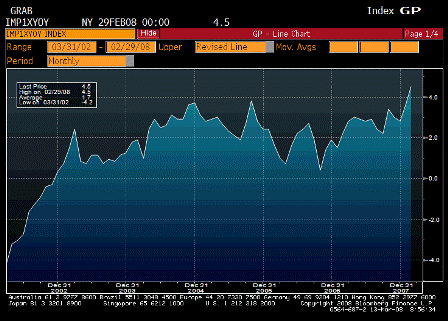
2008-03-13 Import Prices Ex Petroleum YoY

Import Prices Ex Petroleum YoY

Survey n/a
Actual 4.5%
Prior 3.6%
Revised n/a

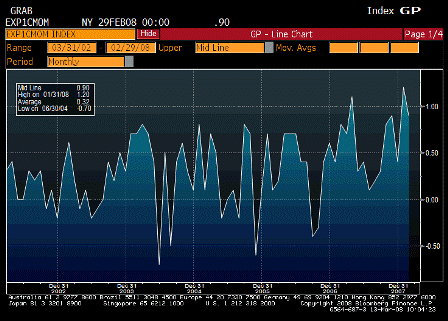
2008-03-13 Exports MoM

Exports MoM (Feb)

Survey n/a
Actual 0.9%
Prior 1.2%
Revised n/a

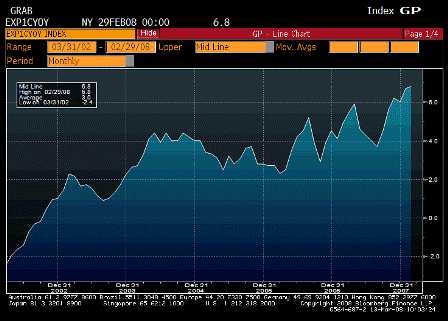
2008-03-13 Exports YoY

Exports YoY (Feb)

Survey n/a
Actual 6.8%
Prior 6.7%
Revised n/a

Inflation ripping via the ‘weak dollar’ channel.

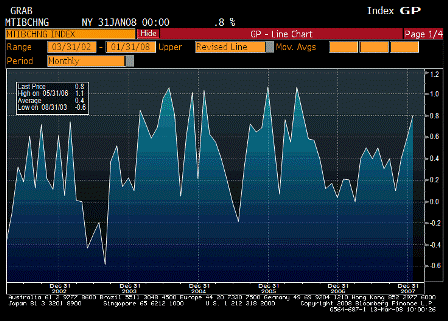
Note: non-petroleum imports up 0.6%.


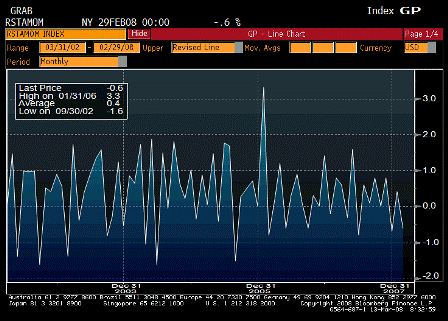
2008-03-13 Advance Retail Sales

Advance Retail Sales (Feb)

Survey 0.2%
Actual -0.6%
Prior 0.3%
Revised 0.4%

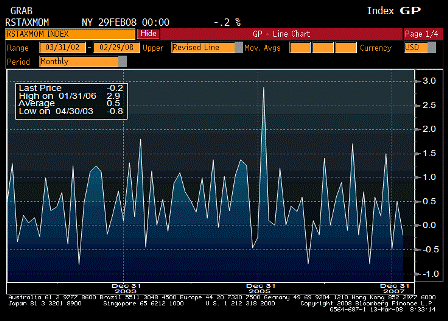
2008-03-13 Retail Sales Less Autos

Retail Sales Less Autos (Feb)

Survey 0.2%
Actual -0.2%
Prior 0.3%
Revised 0.5%

Retail sales soft, but not in collapse. That’s what an export economy looks like: domestic sales soft, while exports pick up the slack and support GDP, real terms of trade, and standards of living deteriorate.


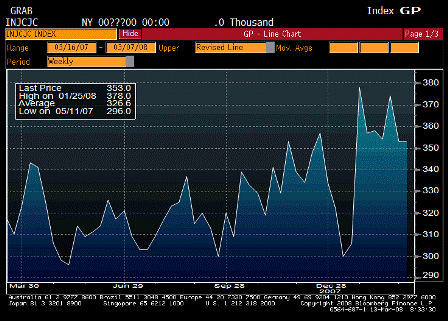
2008-03-13 Initial Jobless Claims

Initial Jobless Claims (Mar 8)

Survey 357K
Actual 353K
Prior 351K
Revised 353K

Leveling off – nowhere near recession levels yet.

Would need to be 400K+.


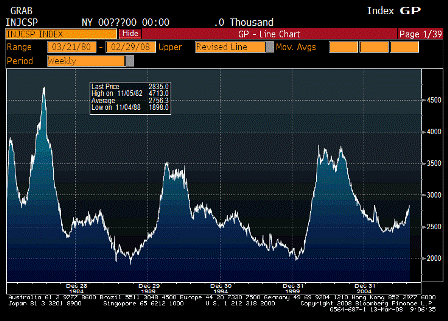
2008-03-13 Continuing Claims since 1980

Continuing Claims (Mar 1)

Survey 2835K
Actual 2835K
Prior 2831K
Revised 2828K

Moving a bit higher, but still far below recession levels.


2008-03-13 Business Inventories

Business Inventories (Jan)

Survey 0.5%
Actual 0.8%
Prior 0.6%
Revised 0.7%

Up some, but still much lower than prior to other recessions.

Comments on 8:30 numbers

Retail sales weak today, but exports up over 16% earlier this week, and jobless claims now settling in around 350,000 – far from recession levels. That’s what export economies look like.

Meanwhile, non oil import prices up 0.6%, and export prices up 0.9%.

US GDP growth may be hovering around zero, but no collapse yet.

Meanwhile, Bush/Bernanke/Paulson engineered USD collapse/inflation/export boom is underway and accelerating.

It was like yelling fire in a crowded theater.

The world was happily accumulating over $700 billion per year in financial assets, and had a total of over $2 trillion, when our leadership yelled ‘fire’ and caused a reverse stampede.

Imports are real benefits and exports are real costs, and now we’re paying the price.

2008-02-13 US Economic Releases

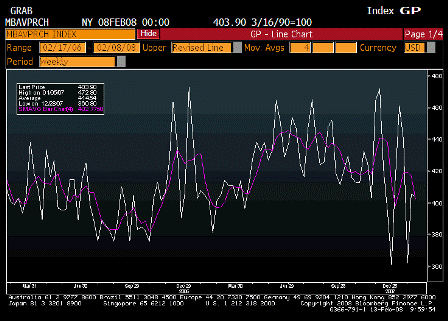
2008-02-13 MBAVPRCH Index

MBAVPRCH Index

Doesn’t look too bad.

Mortgage bankers have reduced staff and are probably working overtime on refi’s which remain very high.


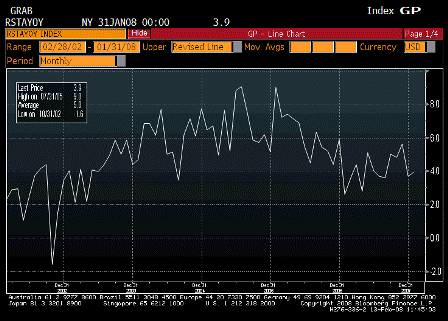
2008-02-13 Retail Sales

Retail Sales

Details of today’s report aside, the year over year chart looks like retail sales have been working their way modestly higher during the last year.


♥

2008-01-15 US Economic Releases

2008-01-15 Producer Price Index MoM

Producer Price Index MoM (Dec)

Survey 0.2%
Actual -0.1%
Prior 3.2%
Revised n/a

2008-01-15 PPI Ex Food & Energy MoM

PPI Ex Food & Energy MoM (Dec)

Survey 0.2%
Actual 0.2%
Prior 0.4%
Revised n/a

2008-01-15 Producer Price Index YoY

Producer Price Index YoY (Dec)

Survey 7.1%
Actual 6.3%
Prior 7.2%
Revised n/a

2008-01-15 PPI Ex Food & Energy YoY

PPI Ex Food & Energy YoY (Dec)

Survey 2.0%
Actual 2.0%
Prior 2.0%
Revised n/a

Inflation pressures remain alarming.

2007 highest inflation since the early 1980s, when inflation was on the way down.

Last hit this number on the way up was in the 1970s.


2008-01-15 Advance Retail Sales

Advance Retail Sales (Dec)

Survey 0.0%
Actual -0.4%
Prior 1.2%
Revised 1.0%

Previous month still very high, two month average looks OK.


2008-01-15 Retail Sales YoY % Change

Retail Sales YoY % Change

Year over year numbers still modestly moving back up.


2008-01-15 Retail Sales Less Autos

Retail Sales Less Autos (Dec)

Survey -0.1%
Actual -0.4%
Prior 1.8%
Revised 1.7%

Same as above.


2008-01-15 Empire Manufacturing

Empire Manufacturing (Jan)

Survey 10.0
Actual 9.0
Prior 10.3
Revised 9.8

2008-01-15 Empire Manufacturing TABLE

Empire Manufacturing TABLE

A close look at the table shows prices still very strong.


2008-01-15 Business Inventories

Business Inventories (Nov)

Survey 0.4%
Actual
Prior 0.1%
Revised

Chart looks OK – no excessive build.


Data not in, until 5PM EST..

ABC Consumer Confidence (Jan 13)

Survey -21
Actual
Prior -20
Revised

♥

8:30 Numbers

Consensus was high enough, let’s see how tomorrow turns out.

Also retail sales up a lot more than just energy prices, and claims down.

Still no sign yet of aggregate demand breaking down

Lehman earnings higher than estimates

November Inflation Surged; Retail Sales Also Strong

Inflation at the wholesale level was stronger than expected in November, thanks to higher gasoline prices, but retail sales also exceeded expectations as holiday shoppers coped with higher energy costs and the fallout from the housing slump.

U.S. producer prices surged at a 34-year high rate of 3.2 percent in November on a record rise in gasoline prices, the Labor Department said.

Excluding food and energy prices, the producer price index rose an unexpectedly large 0.4 percent, the heftiest gain since February, the report showed. When cars and light trucks also were stripped out, core producer prices rose 0.1 percent.

Autos had been lagging if I recall correctly, so was this overdue?

The rise in prices paid at the farm and factory gate was the largest since August 1973 and was well ahead of analysts’ expectations of a 1.5 percent gain. Analysts polled by Reuters had forecast core prices to rise 0.2 percent.

The 7.2 percent increase in producer prices from November 2006 was the largest 12-month gain since November 1981.

Gasoline prices rose 34.8 percent in the month, eclipsing the previous record gain of 28.8 percent in April 1999. Prices for all energy goods also rose by a record 14.1 percent, surpassing the previous high of 13.4 percent recorded in January 1990.

Sales at U.S. retailers posted a much stronger-than-expected 1.2 percent rise in November, government data showed as holiday shoppers coped with high energy costs and the fallout from a housing slump.

Excluding autos, retail sales gained 1.8 percent, the Commerce Department said.

Surprising on the upside.

Economists polled by Reuters forecast retail sales to rise 0.6 percent while sales ex autos were also projected to increase by 0.6 percent.

However, part of the increase was fueled by mounting energy prices, with gasoline sales spurting 6.8 percent higher in November, which was the largest monthly gain since September 2005 in the wake of Hurricane Katrina.

Still, sales excluding gasoline and autos gained 1.1 percent in November after growing just 0.1 percent in the previous month.

First-time claims for U.S. unemployment benefits eased by a slightly more-than-expected 7,000 last week, a Labor Department report showed.

New applications for state unemployment insurance benefits fell to a seasonally adjusted 333,000 in the week ended Dec. 8 from an upwardly revised 340,000 the week before. Analysts polled by Reuters were expecting claims to ease to 335,000 from the previously reported 338,000.

This means the fed still sees no slack in the labor markets.

The four-week moving average of new claims, which smooths out week-to-week fluctuations, fell slightly to 338,750 from a revised 340,750 the prior week.

The number of people continuing to receive jobless benefits after an initial week of aid rose to 2.64 million in the week ended Dec. 1, the most recent week for which statistics are available. Analysts had forecast claims would hold steady at 2.60 million.

The four-week moving average of continued claims rose to 2.61 million, the highest level since the week ended Jan. 7, 2006.

Not good, but not anywhere near bad enough to offset the other numbers reported.

Yesterdays is up 0.9% export number adding to US income and aggregate demand supporting retail sales as well.

Inflation per se is good for nominal equity prices, while the fed fighting inflation with higher rates hurts valuations.

A perceived stronger than expected economy and diminished odds of future rate cuts also likely to shift portfolio allocations back toward the $.