2009-05-04 USER


[Skip to the end]


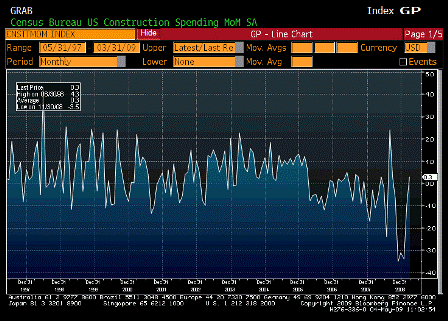
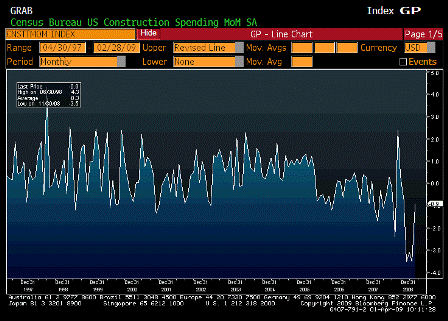
Construction Spending MoM (Mar)

Survey -1.6%
Actual 0.3%
Prior -0.9%
Revised -1.0%

[top][end]

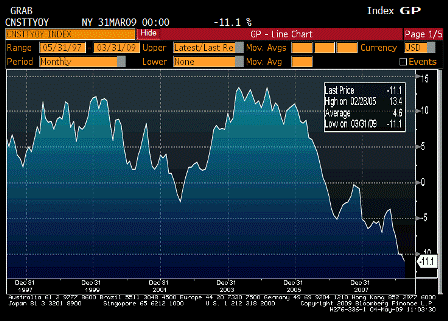
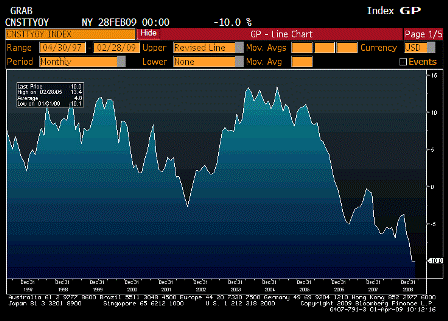
Construction Spending YoY (Mar)

Survey n/a
Actual -11.1%
Prior -10.1%
Revised n/a

[top][end]

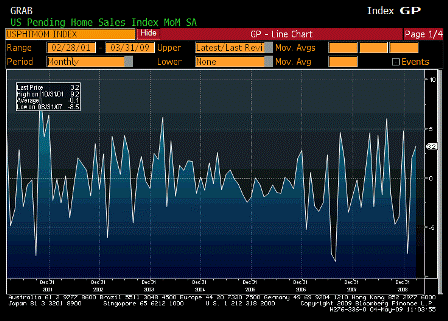
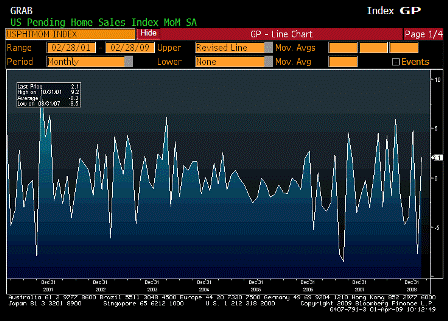
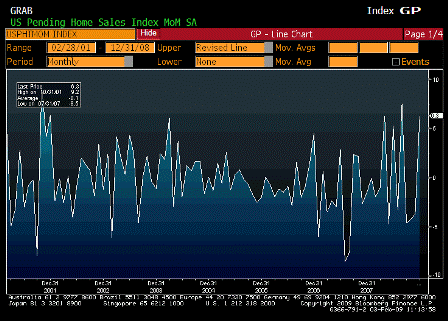
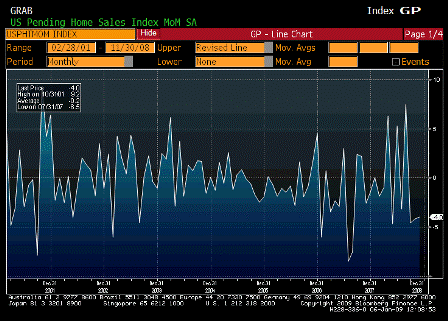
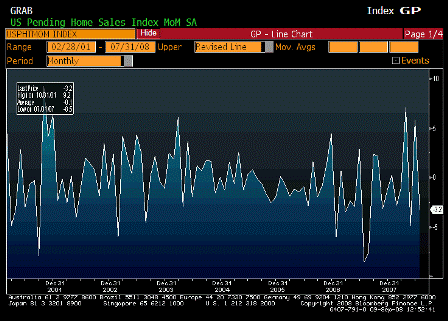
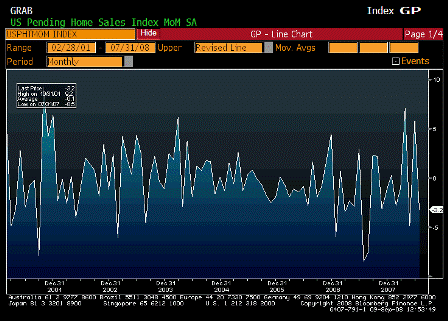
Pending Home Sales MoM (Mar)

Survey 0.0%
Actual 3.2%
Prior 2.1%
Revised 2.0%

[top][end]

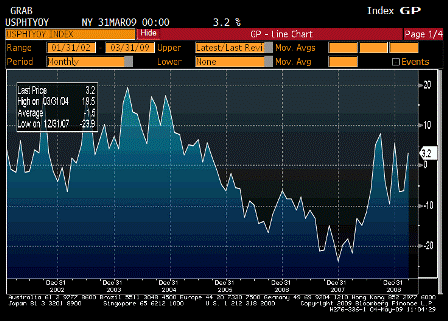
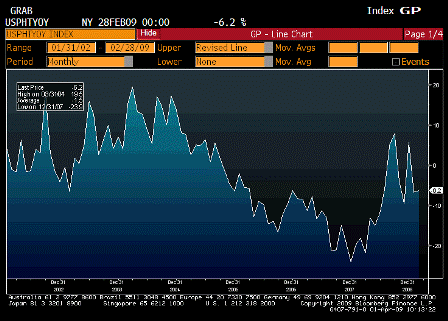
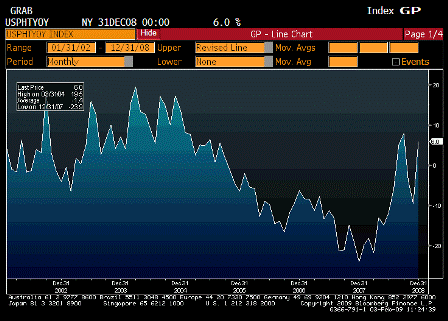
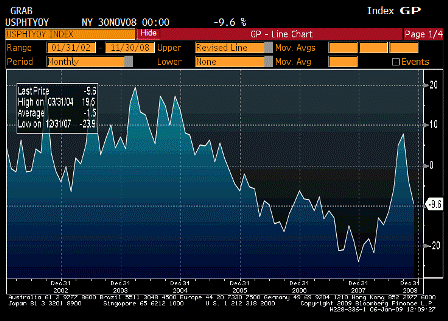
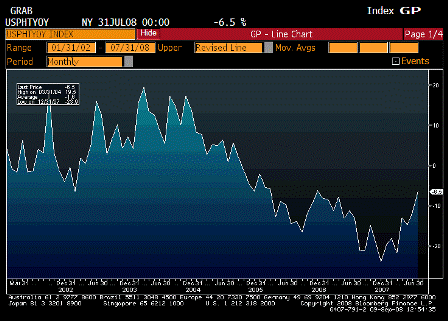
Pending Home Sales YoY (Mar)

Survey n/a
Actual 3.2%
Prior -6.3%
Revised n/a


[top]

2009-04-01 USER


[Skip to the end]


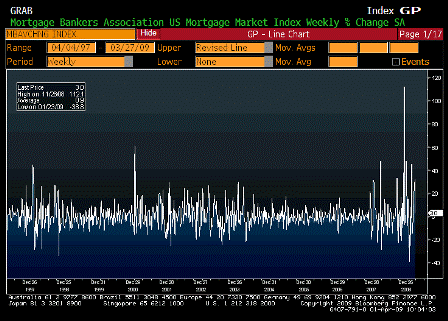
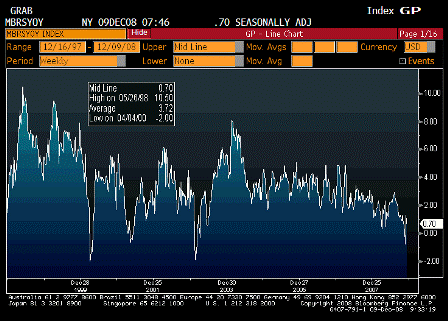
MBA Mortgage Applications (Mar 27)

Survey n/a
Actual 3.0%
Prior 32.2%
Revised n/a

 
More evidence of the rising deficit turning the economy sideways ahead of the fiscal package kicking in this month to increase the injection of net financial assets to the non government sectors:

US mortgage applications climb, rates at fresh low

by Lynn Adler

Apr 1 (Reuters) — The Mortgage Bankers Association’s applications index, which includes both refi and purchase requests, rose by a seasonally adjusted 3 percent in the week ending March 27 to 1,194.4.

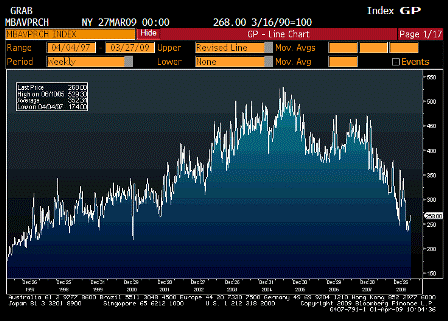
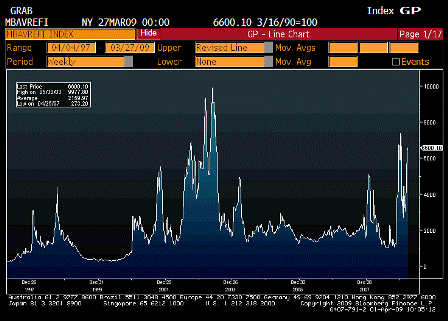
The purchase applications index was little changed, rising 0.1 percent to 268.0, while the refinancing gauge gained 3.7 percent to 6,600.1.

This is up sharply from 2,722.7 as recently as early February.

[top][end]

MBA Purchasing Applications (Mar 27)

Survey n/a
Actual 268.00
Prior 267.80
Revised n/a

[top][end]

MBA Refinancing Applications (Mar 27)

Survey n/a
Actual 6600.10
Prior 6363.20
Revised n/a

[top][end]


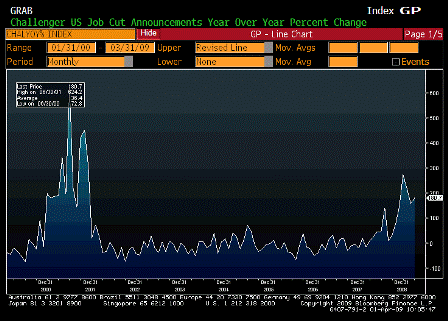
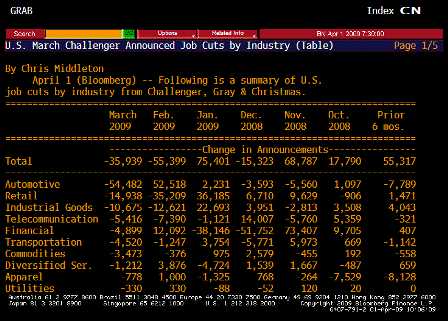
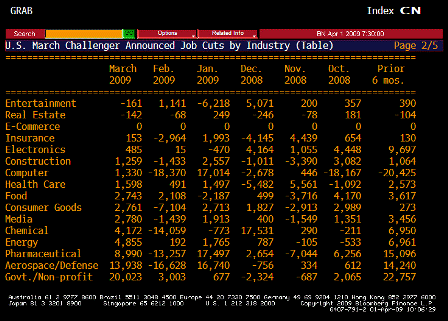
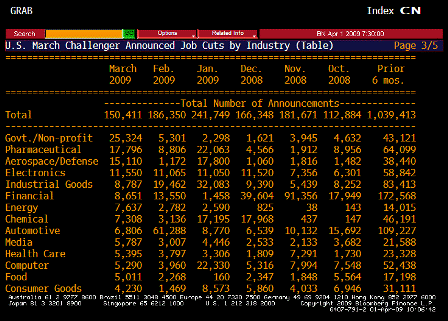
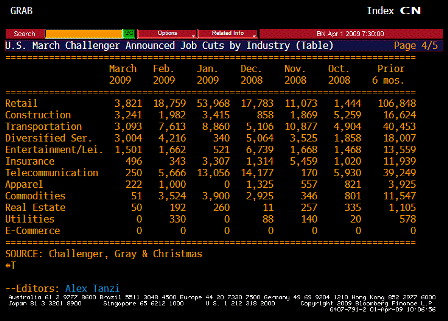
Challenger Job Cuts YoY (Mar)

Survey n/a
Actual 180.7%
Prior 158.4%
Revised n/a

[top][end]

Challenger Job Cuts TABLE 1 (Mar)

[top][end]

Challenger Job Cuts TABLE 2 (Mar)

[top][end]

Challenger Job Cuts TABLE 3 (Mar)

[top][end]

Challenger Job Cuts TABLE 4 (Mar)

[top][end]


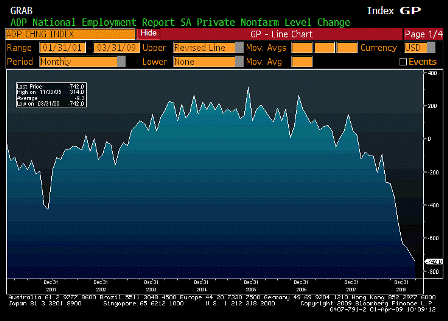
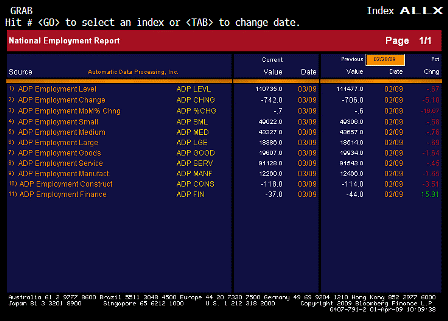
ADP Employment Change (Mar)

Survey -663K
Actual -742K
Prior -697K
Revised -706K

[top][end]

ADP ALLX (Mar)

[top][end]


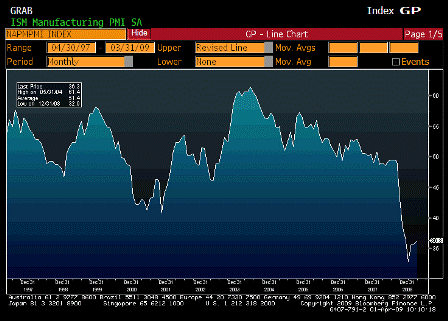
ISM Manufacturing (Mar)

Survey 36.0
Actual 36.3
Prior 35.8
Revised n/a

[top][end]

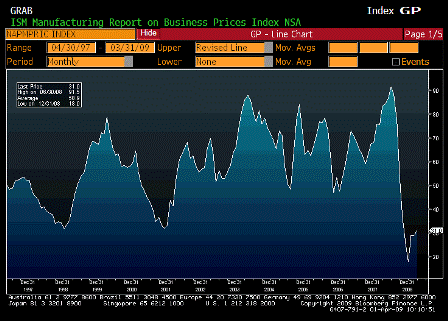
ISM Prices Paid (Mar)

Survey 33.0
Actual 31.0
Prior 29.0
Revised n/a

[top][end]


Construction Spending MoM (Feb)

Survey -1.9%
Actual -0.9%
Prior -3.3%
Revised -3.5%

[top][end]

Construction Spending YoY (Feb)

Survey n/a
Actual -10.0%
Prior -10.1%
Revised n/a

[top][end]


Pending Home Sales MoM (Feb)

Survey 0.0%
Actual 2.1%
Prior -7.7%
Revised n/a

[top][end]

Pending Home Sales YoY (Feb)

Survey n/a
Actual -6.2%
Prior -6.6%
Revised n/a


[top]

2009-03-03 USER


[Skip to the end]


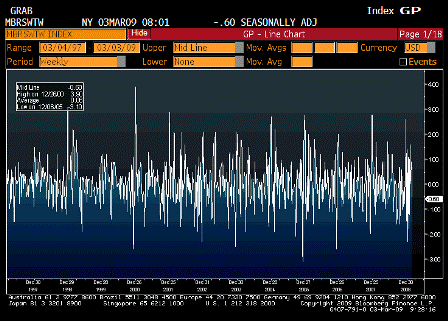
ICSC UBS Store Sales WoW (Mar 3)

Survey n/a
Actual -0.6%
Prior 0.6%
Revised n/a

[top][end]

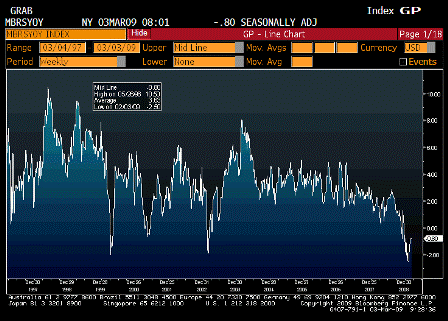
ICSC UBS Store Sales YoY (Mar 3)

Survey n/a
Actual -0.8%
Prior -0.8%
Revised n/a

[top][end]

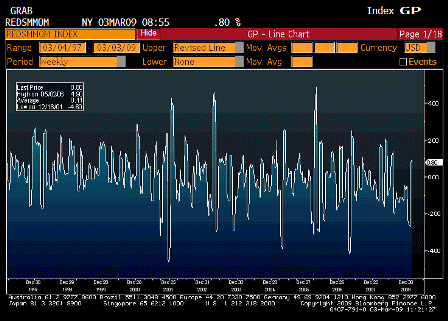
Redbook Store Sales MoM (Mar 3)

Survey n/a
Actual 0.8%
Prior 0.9%
Revised n/a

[top][end]

Redbook Store Sales MoM (Mar 3)

Survey n/a
Actual -1.9%
Prior -1.5%
Revised n/a

 
Redbook up two weeks in a row?

[top][end]

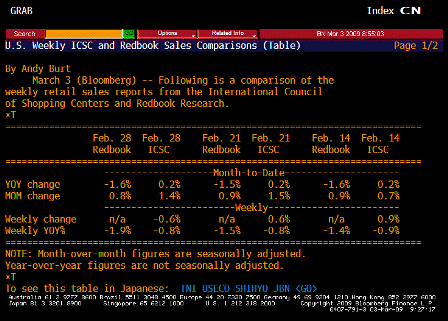
ICSC UBS Redbook Comparison TABLE (Mar 3)

[top][end]


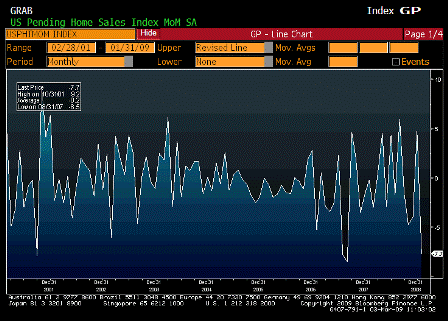
Pending Home Sales MoM (Jan)

Survey -3.5%
Actual -7.7%
Prior 6.3%
Revised 4.8%

[top][end]

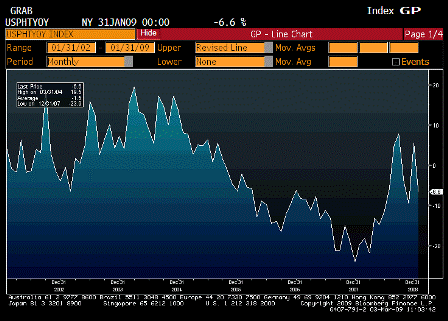
Pending Home Sales YoY (Jan)

Survey n/a
Actual -6.6%
Prior 5.7%
Revised n/a


[top]

2009-02-03 USER


[Skip to the end]


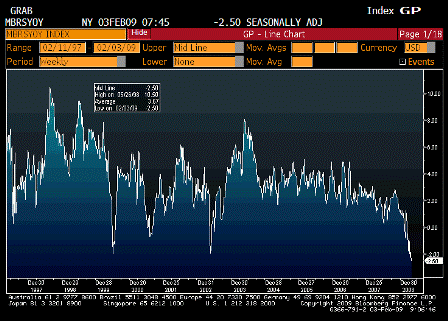
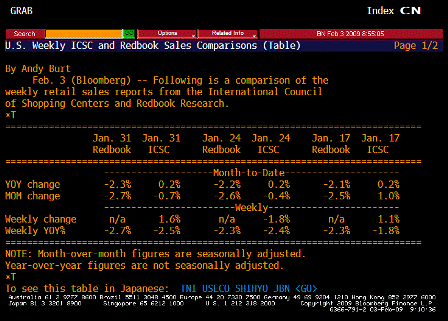
ICSC UBS Store Sales YoY (Feb 3)

Survey n/a
Actual -2.50%
Prior -2.40%
Revised n/a

[top][end]

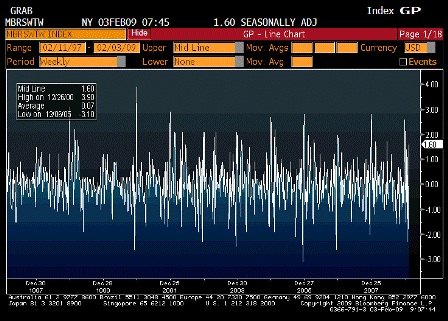
ICSC UBS Store Sales WoW (Feb 3)

Survey n/a
Actual 1.60%
Prior -1.80%
Revised n/a

[top][end]

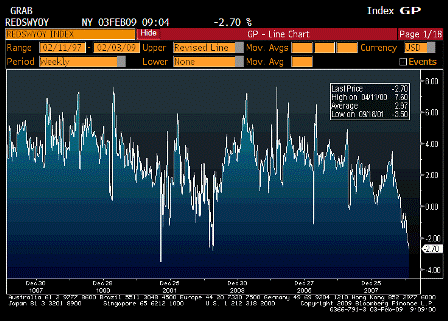
Redbook Store Sales Weekly YoY (Feb 3)

Survey n/a
Actual -2.70%
Prior -2.30%
Revised n/a

[top][end]

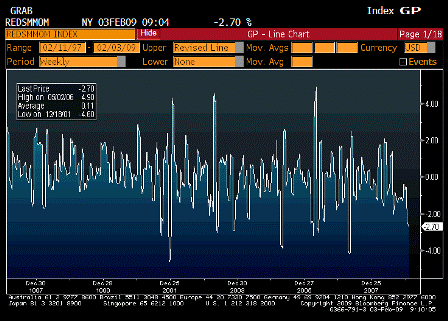
Redbook Store Sales MoM (Feb 3)

Survey n/a
Actual -2.70%
Prior -2.60%
Revised n/a

[top][end]

ICSC UBS Redbook Comparison TABLE (Feb 3)

[top][end]

Pending Home Sales MoM (Dec)

Survey 0.0%
Actual 6.3%
Prior -4.0%
Revised -3.7%

[top][end]

Pending Home Sales YoY (Dec)

Survey n/a
Actual 6.0%
Prior 9.5%
Revised n/a

 
Chewing through the foreclosures.


[top]

2009-01-06 USER


[Skip to the end]

 
Speaks for itself.


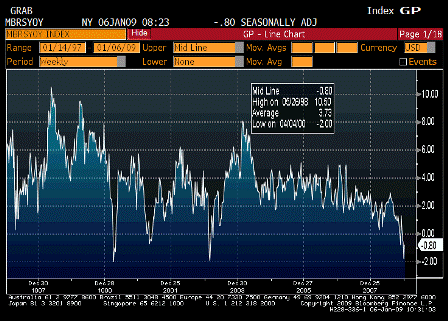
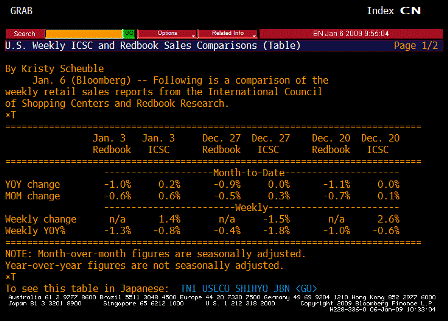
ICSC UBS Store Sales YoY (Jan 6)

Survey n/a
Actual -0.80%
Prior -1.80%
Revised n/a

[top][end]

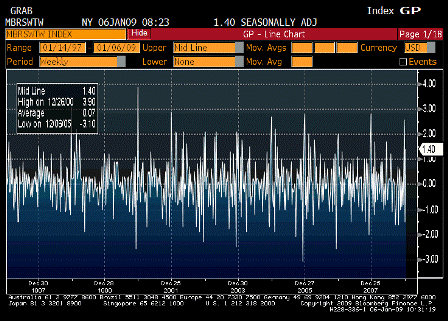
ICSC UBS Store Sales WoW (Jan 6)

Survey n/a
Actual 1.40%
Prior -1.50%
Revised n/a

[top][end]

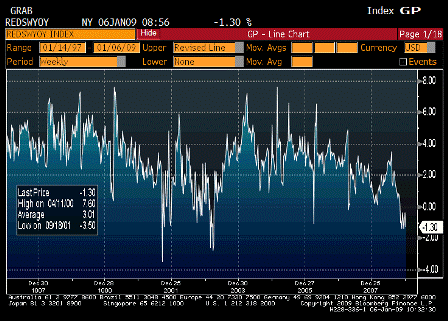
Redbook Store Sales Weekly YoY (Jan 6)

Survey n/a
Actual -1.30%
Prior -0.40%
Revised n/a

[top][end]

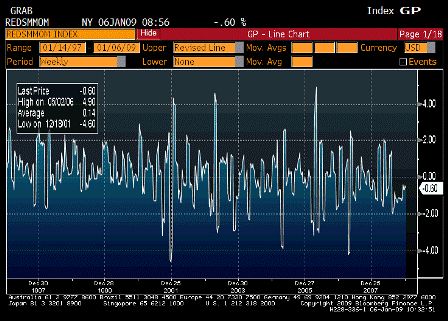
Redbook Store Sales MoM (Jan 6)

Survey n/a
Actual -0.60%
Prior -0.50%
Revised n/a

[top][end]

ICSC UBS Redbook Comparison TABLE (Jan 6)

[top][end]

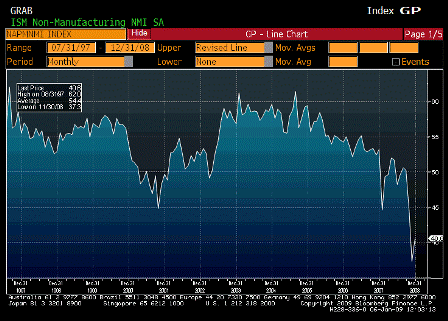
ISM Non Manufacturing Composite (Dec)

Survey 36.5
Actual 40.6
Prior 37.3
Revised n/a

[top][end]

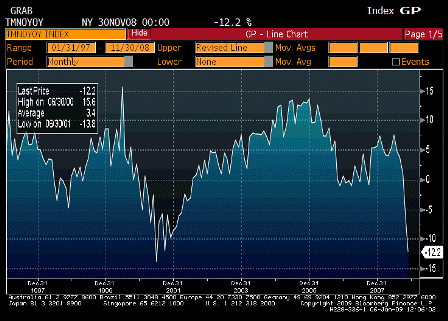
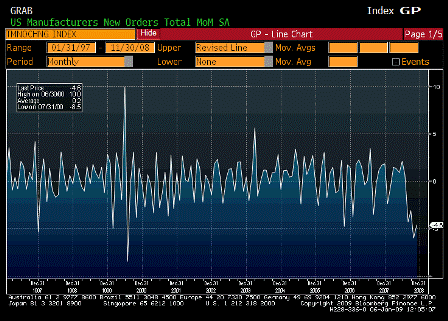
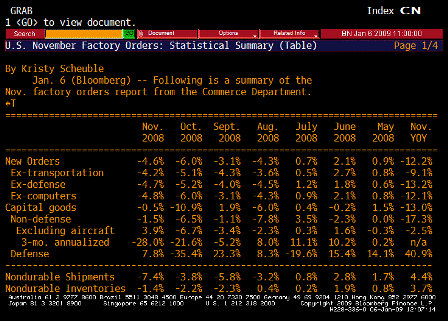
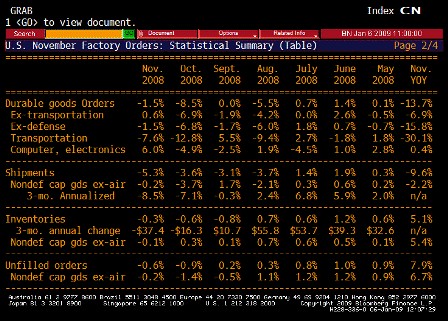
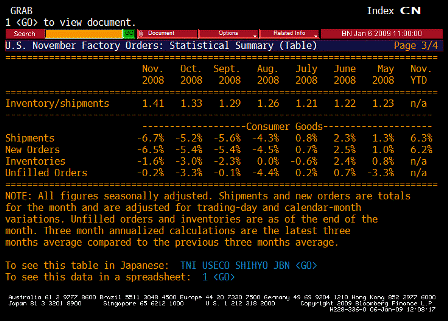
Factory Orders YoY (Nov)

Survey n/a
Actual -12.2%
Prior -6.3%
Revised n/a

[top][end]

Factory Orders MoM (Nov)

Survey -2.3%
Actual -4.6%
Prior -5.1%
Revised -6.0%

[top][end]

Factory Orders TABLE 1 (Nov)

[top][end]

Factory Orders TABLE 2 (Nov)

[top][end]

Factory Orders TABLE 3 (Nov)

[top][end]

Pending Home Sales MoM (Nov)

Survey -1.0%
Actual -4.0%
Prior -0.7%
Revised -4.2%

[top][end]

Pending Home Sales YoY (Nov)

Survey n/a
Actual -9.6%
Prior -3.9%
Revised n/a


[top]

2008-12-09 USER


[Skip to the end]


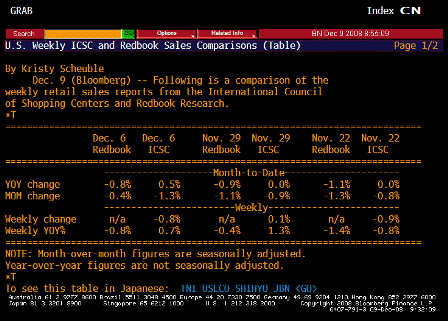
ICSC UBS Store Sales YoY (Dec 9)

Survey n/a
Actual -0.70%
Prior 1.30%
Revised n/a

[top][end]

ICSC UBS Store Sales WoW (Dec 9)

Survey n/a
Actual -0.80%
Prior 0.10%
Revised n/a

[top][end]

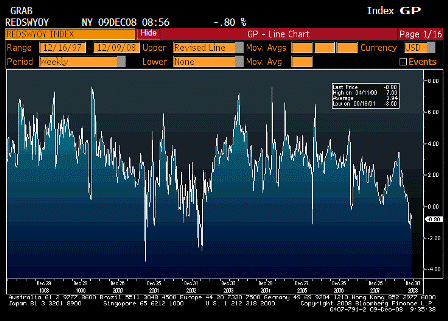
Redbook Store Sales Weekly YoY (Dec 9)

Survey n/a
Actual -0.80%
Prior -0.40%
Revised n/a

[top][end]

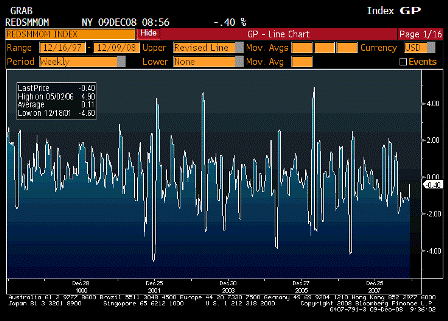
Redbook Store Sales MoM (Dec 9)

Survey n/a
Actual -0.40%
Prior -1.10%
Revised n/a

[top][end]

ICSC UBS Redbook Comparison TABLE (Dec 9)

[top][end]

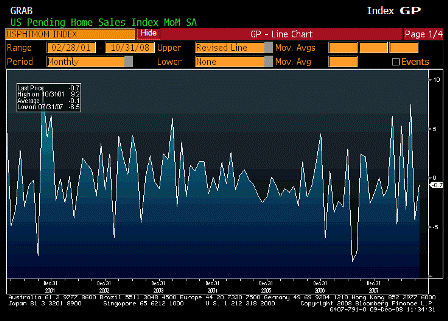
Pending Home Sales MoM (Oct)

Survey n/a
Actual -0.7%
Prior -4.3%
Revised n/a

[top][end]

Pending Home Sales YoY (Oct)

Survey n/a
Actual -0.6%
Prior 7.9%
Revised n/a


[top]

2008-11-07 USER


[Skip to the end]


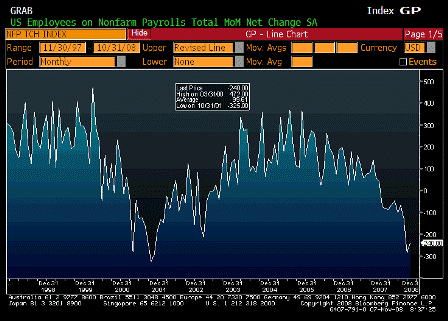
Change in Nonfarm Payrolls (Oct)

Survey -200K
Actual -240K
Prior -159K
Revised -284K

[top][end]

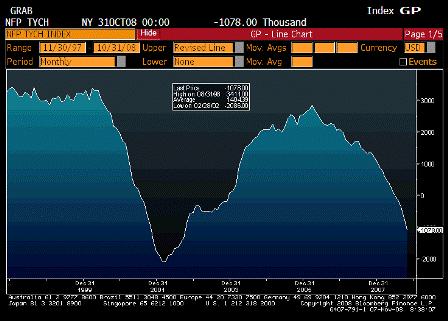
Change in Nonfarm Payrolls YoY (Oct)

Survey n/a
Actual -1078.00
Prior -698.00
Revised n/a

[top][end]

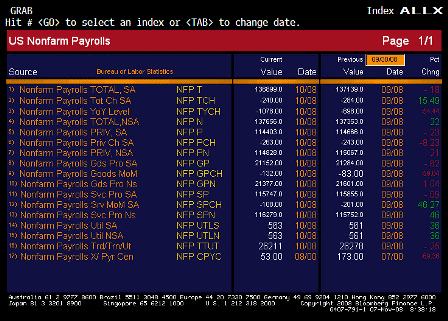
Nonfarm Payrolls ALLX (Oct)

[top][end]


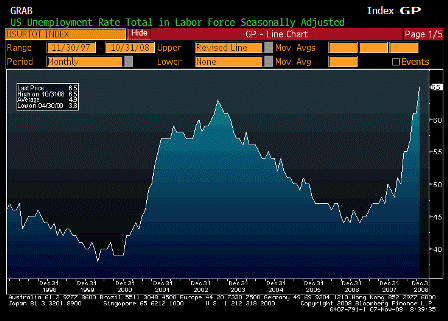
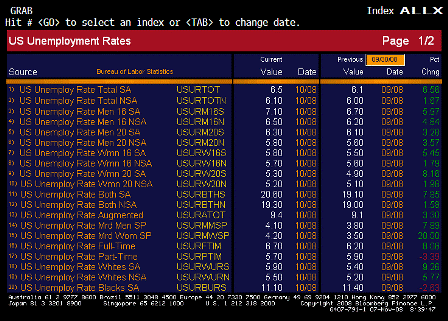
Unemployment Rate (Oct)

Survey 6.3%
Actual 6.5%
Prior 6.1%
Revised n/a

[top][end]

Unemployment Rate ALLX 1 (Oct)

[top][end]

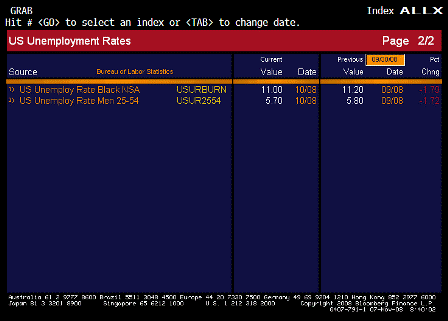
Unemployment Rate ALLX 2 (Oct)

[top][end]


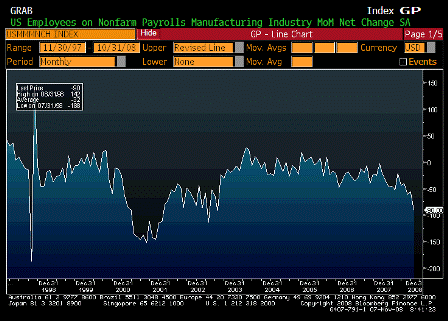
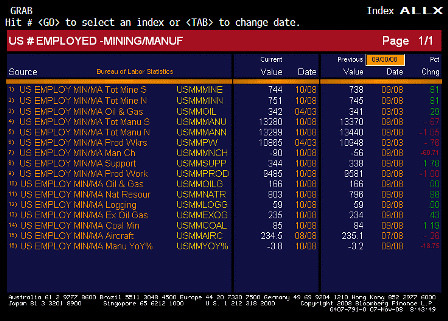
Change in Manufacturing Payrolls (Oct)

Survey -65K
Actual -90K
Prior -51K
Revised -56K

[top][end]

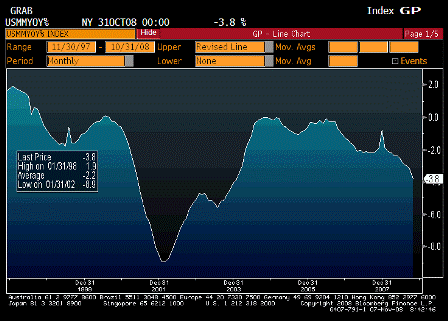
Change in Manufacturing Payrolls YoY (Oct)

Survey n/a
Actual -3.8%
Prior -3.2%
Revised n/a

[top][end]

Manufacturing Payrolls ALLX (Oct)

 
Karim writes:

Payrolls:

Worse than expected (but that was expected)

  • -240k; unemployment rate rises from 6.1% to 6.5%
  • Net revisions -179k (Sep revised from -159k to -284k)
  • Hours continue to shrink -0.3% m/m and -2.6% annualized over past 3mths
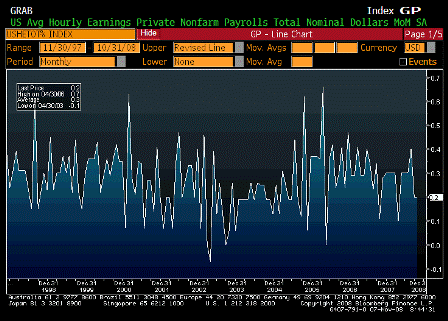
  • Avg hourly earnings 0.2%
  • Avg duration of unemployment jumps from 18.4weeks to 19.7
  • Diffusion index falls from 38.1 to 37.6

By industry:

  • Mfg -90k
  • Construction -49k
  • Retail -38k
  • Finance -24k
  • Temp -34k
  • Education 21k
  • Govt 23k

[top][end]


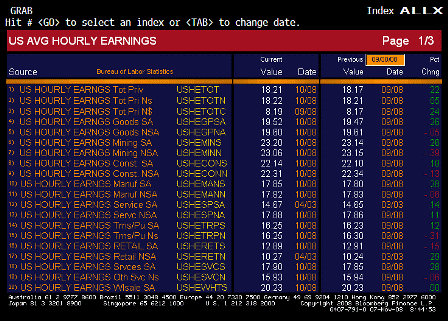
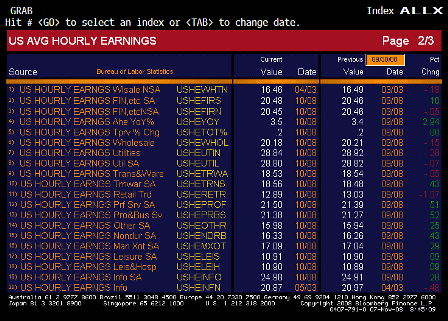
Average Hourly Earnings MoM (Oct)

Survey 0.2%
Actual 0.2%
Prior 0.2%
Revised n/a

[top][end]

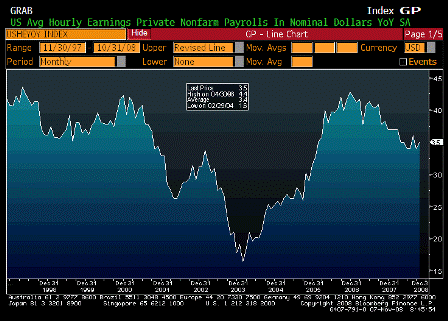
Average Hourly Earnings YoY (Oct)

Survey 3.5%
Actual 3.5%
Prior 3.4%
Revised n/a

[top][end]

Average Hourly Earnings ALLX 1 (Oct)

[top][end]

Average Hourly Earnings ALLX 2 (Oct)

[top][end]


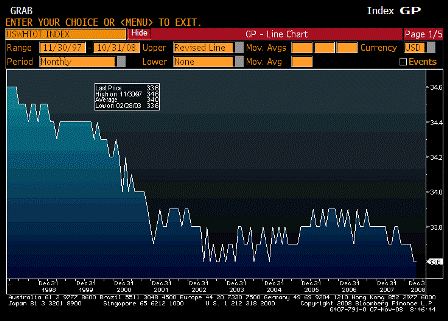
Average Weekly Hours (Oct)

Survey 33.6
Actual 33.6
Prior 33.6
Revised n/a

[top][end]


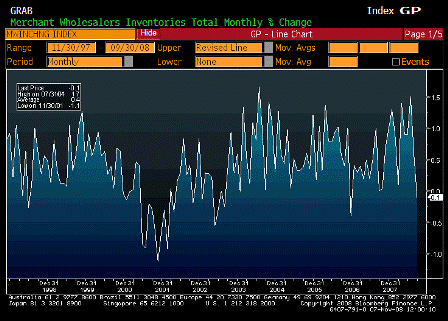
Wholesale Inventories MoM (Sep)

Survey 0.3%
Actual -0.1%
Prior 0.8%
Revised 0.6%

 
Falling?

[top][end]

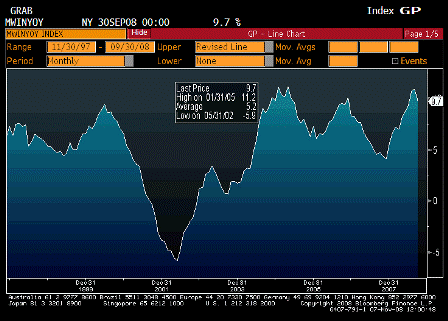
Wholesale Inventories YoY (Sep)

Survey n/a
Actual 9.7%
Prior 10.9%
Revised n/a

 
Past the peak?

[top][end]

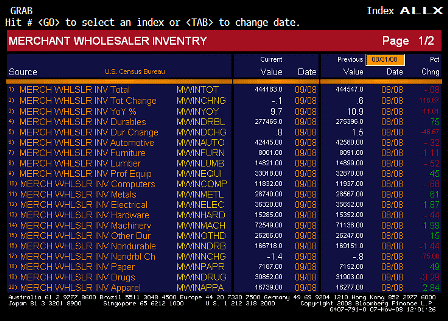
Wholesale Inventories ALLX 1 (Sep)

[top][end]

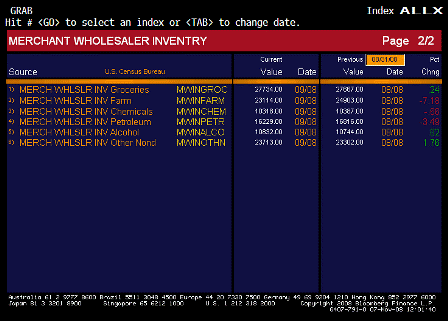
Wholesale Inventories ALLX 2 (Sep)

[top][end]


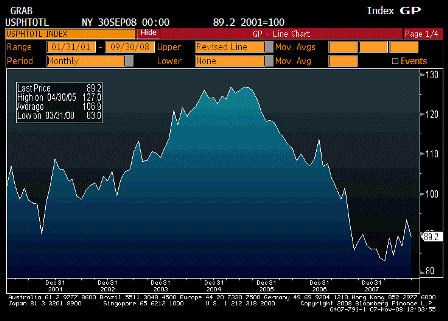
Pending Home Sales (Sep)

Survey n/a
Actual 89.2
Prior 93.5
Revised n/a

 
Still a mini trend higher.

[top][end]

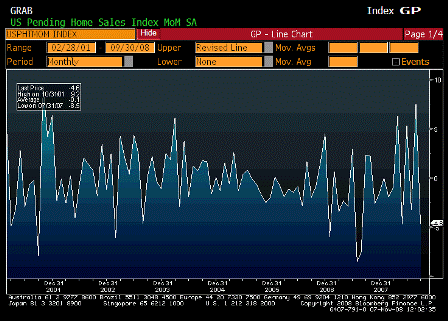
Pending Home Sales MoM (Sep)

Survey -3.4%
Actual -4.6%
Prior 7.4%
Revised 7.5%

[top][end]

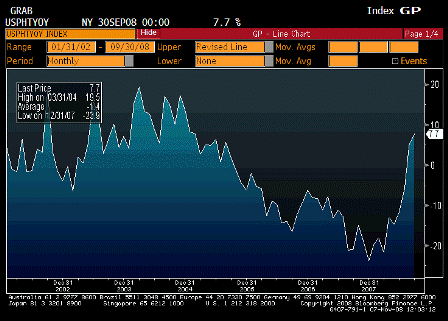
Pending Home Sales YoY (Sep)

Survey n/a
Actual 7.7%
Prior 5.1%
Revised n/a

 
Not bad! probably lots of foreclosure sales.


[top]

2008-10-08 USER


[Skip to the end]


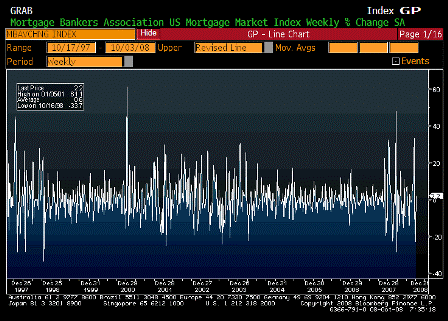
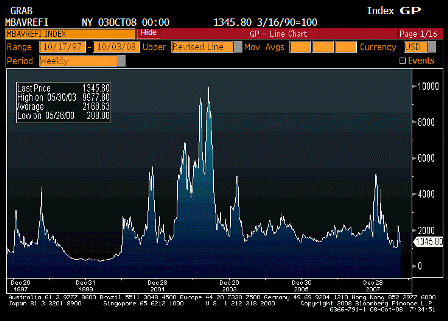
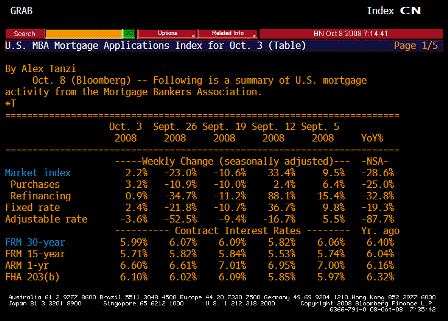
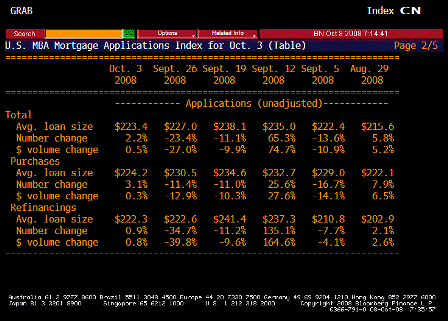
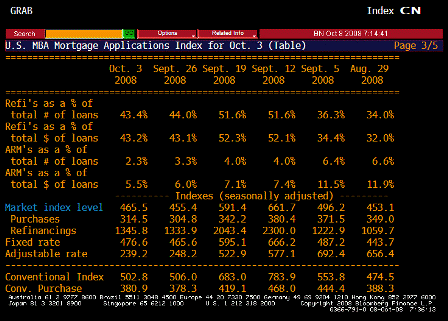
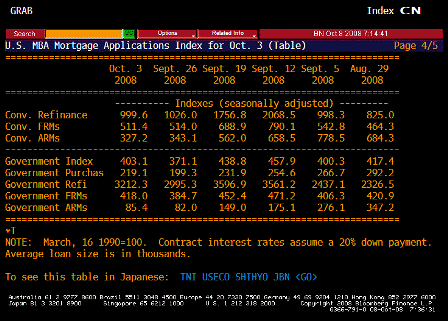
MBA Mortgage Applications (Oct 3)

Survey n/a
Actual 2.2%
Prior -23.0%
Revised n/a

[top][end]

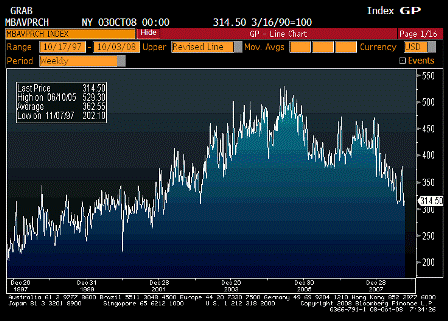
MBA Purchasing Applications (Oct. 3)

Survey n/a
Actual 314.50
Prior 304.80
Revised n/a

 
Didn’t go down.

[top][end]

MBA Refinancing Applications (Oct. 3)

Survey n/a
Actual 1345.80
Prior 1333.90
Revised n/a

[top][end]

MBA TABLE 1 (Oct 3)

[top][end]

MBA TABLE 2 (Oct 3)

[top][end]

MBA TABLE 3 (Oct 3)

[top][end]

MBA TABLE 4 (Oct 3)

[top][end]

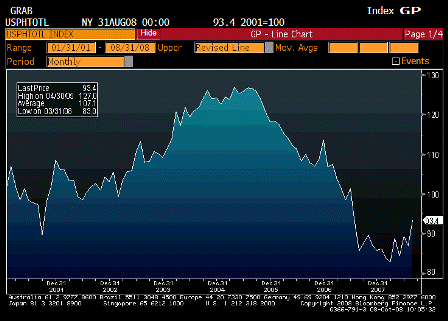
Pending Home Sales (Aug)

Survey n/a
Actual 93.4
Prior 87.0
Revised n/a

 
And moving up?

[top][end]

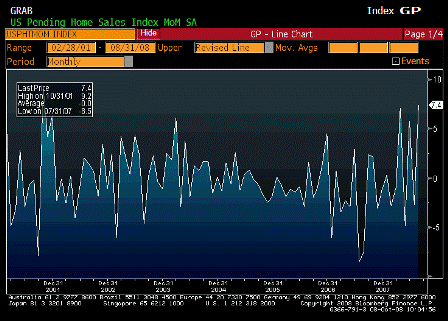
Pending Home Sales MoM (Aug)

Survey -1.3%
Actual 7.4%
Prior -3.2%
Revised -2.7%

 
Full blown housing boom underway! (OK, not yet)

[top][end]

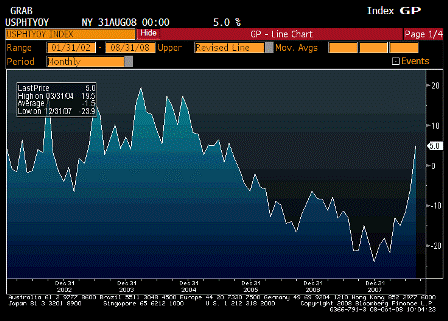
Pending Home Sales YoY (Aug)

Survey n/a
Actual 5.0%
Prior -5.9%
Revised n/a

 
Went positive!

September will be the test with the intensified credit crunch, but if this stuff holds, the economy may be in better shape than assumed.


[top]

2008-09-09 USER


[Skip to the end]


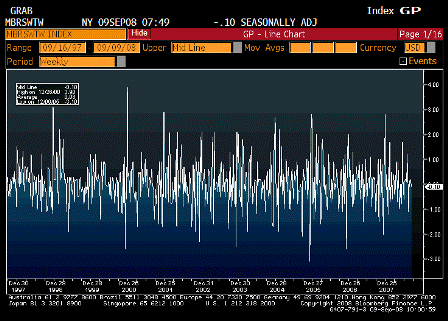
ICSC-UBS Store Sales WoW (Sep 9)

Survey n/a
Actual -0.1%
Prior 0.1%
Revised n/a

[top][end]

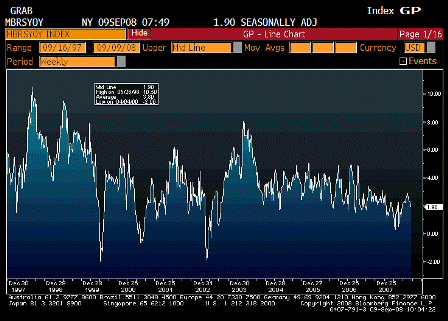
ICSC-UBS Stores Sales YoY (Sep 9)

Survey n/a
Actual 1.9%
Prior 2.0%
Revised n/a

[top][end]

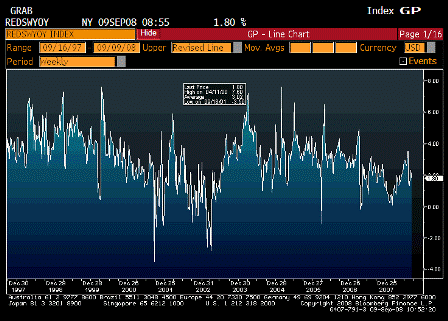
Redbook Store Sales Weekly YoY (Sep 9)

Survey n/a
Actual 1.8%
Prior 2.3%
Revised n/a

 
Muddling through, well off the bottom, and not at recession levels.

[top][end]

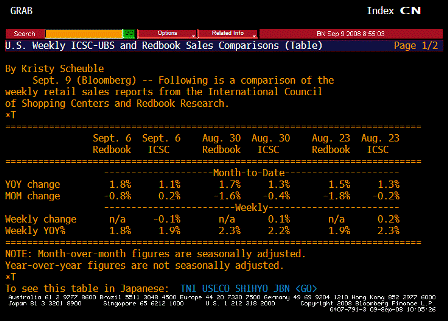
ICSC-UBS Redbook Comparison TABLE (Sep. 9)

 
Pretty much the same, muddling through and far from recession levels.

[top][end]


Pending Home Sales (Jul)

Survey n/a
Actual 86.5
Prior 89.4
Revised n/a

[top][end]

Pending Home Sales MoM (Jul)

Survey -1.5%
Actual -3.2%
Prior 5.3%
Revised 5.8%

 
A bit lower but last month’s gain revised even higher.

[top][end]

Pending Home Sales YoY (Jul)

Survey n/a
Actual -6.5%
Prior -11.6%
Revised n/a

 
Still negative but looks to be surfacing rapidly.

[top][end]


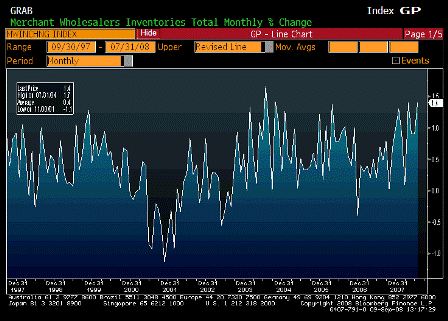
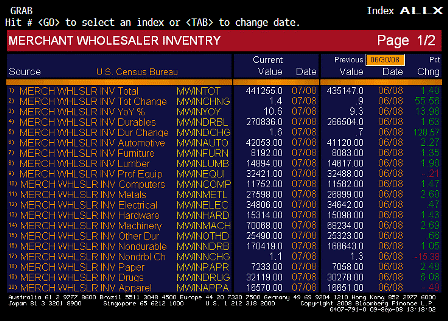
Wholesale Inventories MoM (Jul)

Survey 0.7%
Actual 1.4%
Prior 1.1%
Revised 0.9%

[top][end]

Wholesale Inventories YoY (Jul)

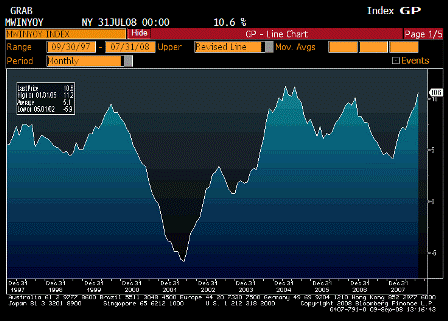
Survey n/a
Actual 10.6%
Prior 9.3%
Revised n/a

 
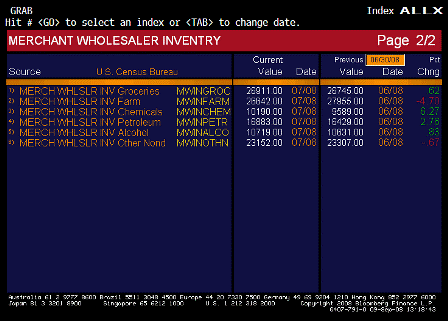
Inventories up but within normal fluctuations.

The question is causation- weak sales and unwanted inventories or building inventories for increasing demand

[top][end]

Wholesale Inventories ALLX 1 (Jul)

[top][end]

Wholesale Inventories ALLX 2 (Jul)

[top][end]


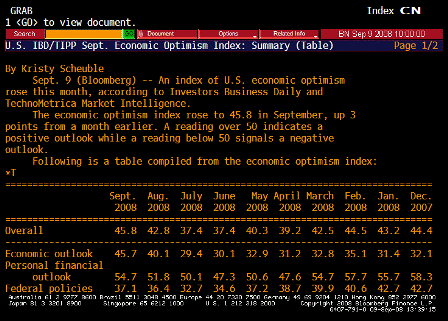
IBD TIPP Economic Optimism (Sep)

Survey 44.0
Actual 45.8
Prior 42.8
Revised n/a


[top]

2008-08-07 US Economic Releases


[Skip to the end]


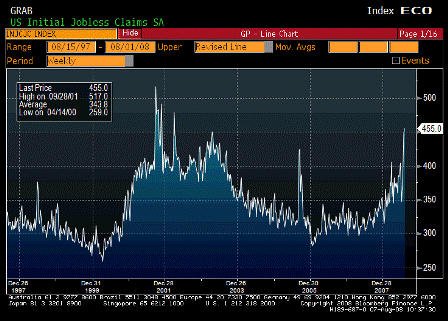
Initial Jobless Claims (Aug 2)

Survey 425K
Actual 455K
Prior 448K
Revised n/a

Karim writes:

  • Initial claims rise 7k to new cycle high of 455k with 4wk moving avg up from 393k to 420k

[top][end]
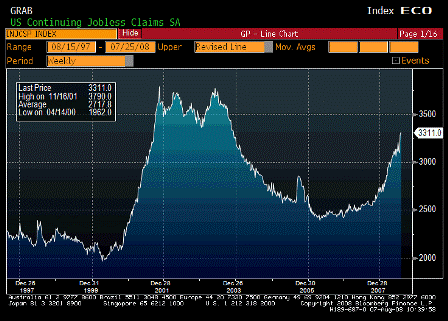
Continuing Jobless Claims (Jul 26)

Survey 3255K
Actual 3311K
Prior 3282K
Revised 3280K

Karim writes:

  • Continuing claims rise from 3280k to 3311k and 4wk moving avg up from 3174k to 3201k

[top][end]
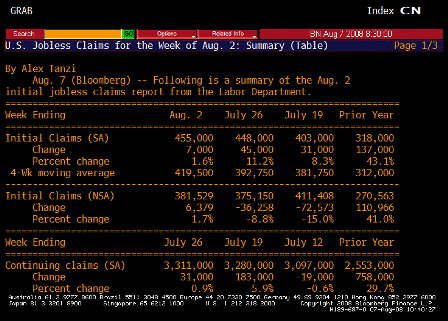
Jobless Claims TABLE 1 (Jul 26)

[top][end]
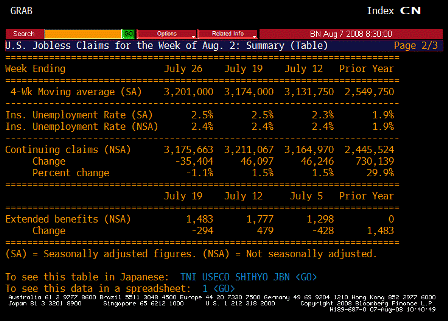
Jobless Claims TABLE 2 (Jul 26)

Cesar writes:

A year ago we were at 4.7% unemployment rate (7,137 unemployed/ 153,182 labor force)

We are currently at 5.7% unemployment rate (8,784 unemployed/ 154,603 labor force)

Seems nearly the entire jump in unemployment is due to labor force increases.

Total employed is about flat.

In that case, GDP growth is about equal to productivity growth.

Karim writes:

  • Initial claims somewhat distorted by new program to extend benefits where those filing extensions are considered first time filers (double counted); this should have an effect for the first 2-3 weeks of the program before initial claims fall back to trend level (same happened back in 2001). Last week was first week of program, so numbers for next 2 weeks should reflect underlying trend (last number before extension program was 403k). Of concern would be if numbers don’t fall back much.
  • This program does not effect continuing claims, which reflects ability to find a job once laid off. This is at a new cycle high.

[top][end]
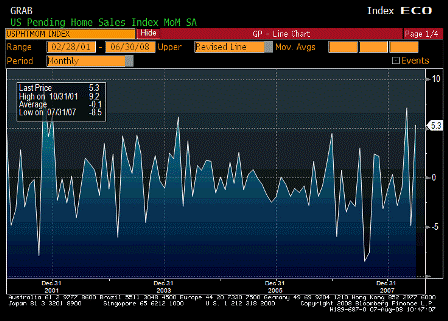

Pending Home Sales MoM (Jun)

Survey -1.0%
Actual 5.3%
Prior -4.7%
Revised -4.9%

Karim writes:

  • Rise 5.3% m/m, continuing recent see-saw pattern (-4.9%, +7.1% prior 2mths).

Q2 GDP for Japan and Germany are out next week. A German newspaper yesterday leaked German GDP growth likely to be -1 to -1.5%. Much of this is a giveback for a strong Q1 of +1.5% but definitely weaker than expected. Of concern to the ECB is that Spain (industrial production now down 10% y/y) and Italy already written off, so much depends on Germany. Moreover, German PMIs have gotten off to a very weak start for Q3. I imagine that was at the root of Trichet’s more dovish tone today.

Estimates for Japanese Q2 GDP are in the -1% to -3.5% range. The July Tankan and the foreign orders component of last night’s machinery orders data also don’t bode too well for Q3.

[top][end]
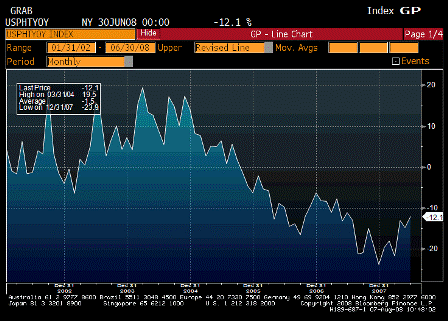
Pending Home Sales YoY (Jun)

Survey n/a
Actual -12.1%
Prior -14.8%
Revised n/a

Looks like it has bottomed and moving up as prices have adjusted and GDP has improved.

Housing my no longer be subtracting from GDP.

[top][end]
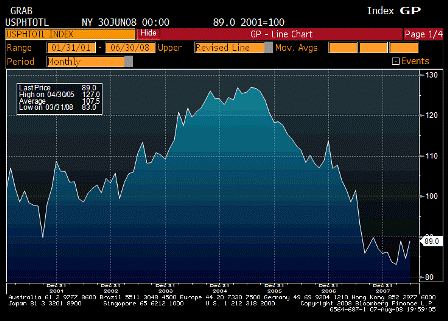
Pending Home Sales Total SA (Jun)

Survey n/a
Actual 89.0
Prior 84.5
Revised n/a

Looks to have found support and probably bottomed albeit at very low levels.

[top][end]
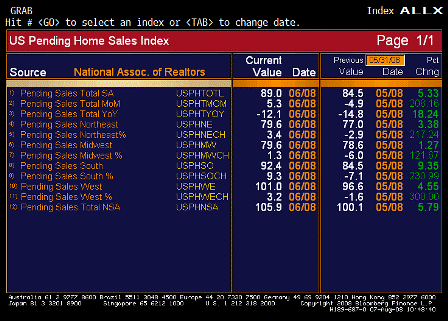
Pending Home Sales ALLX (Jun)

[top][end]
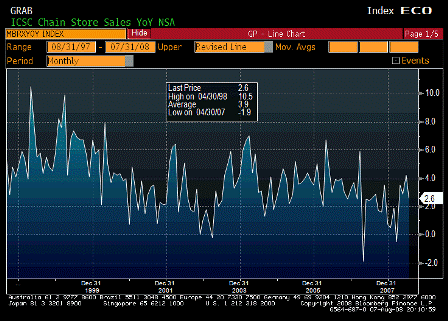

ICSC Chain Store Sales YoY (Jul)

Survey 3.4%
Actual 2.6%
Prior 4.3%
Revised 4.2%

Less then expected but not bad.

[top][end]
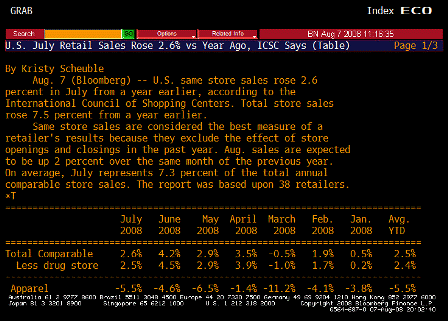
ICSC TABLE 1 (Jul)

[top][end]
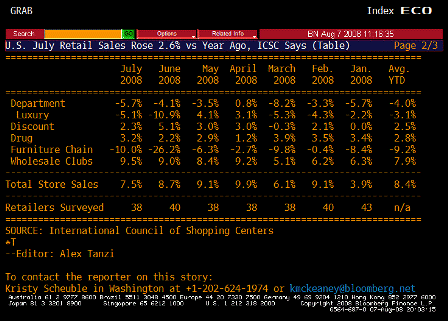
ICSC TABLE 2 (Jul)

[top][end]
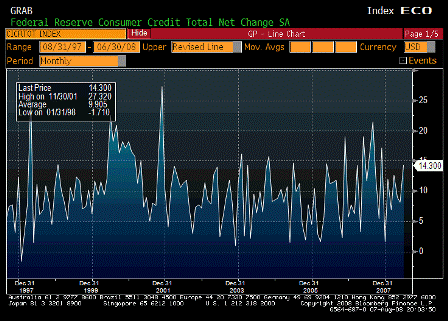

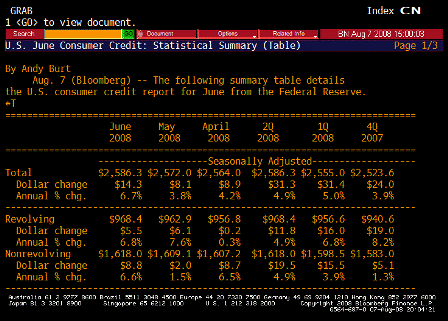
Consumer Credit (Jun)

Survey $6.3B
Actual $14.3B
Prior $7.8B
Revised $8.1B

Volatile series. Moving up some to support higher levels of spending.

[top][end]
Consumer Credit TABLE 1 (Jun)

[top][end]
Consumer Credit TABLE 2 (Jun)

Note from the graph the improving position of the domestic sector as the government deficit and net exports rise and support domestic ‘savings’ and spending. The US budget deficit is expected to exceed 3% this year and exports should remain firm even with slowing foreign economies. In fact, that’s one of the primary reasons those economies are slowing.

U.S. June Consumer Credit Up $14.3 Billion, More Than Forecast

by Shobhana Chandra

(Bloomberg) U.S. consumers borrowed more than twice as much as economists forecast in June as the slump in real-estate prices prevented American homeowners from tapping into home-equity lines of credit.

Consumer credit rose by $14.3 billion, the most since November, to $2.59 trillion, the Federal Reserve said today in Washington. In May, credit rose by $8.1 billion, previously reported as an increase of $7.8 billion. The Fed’s report doesn’t cover borrowing secured by real estate.

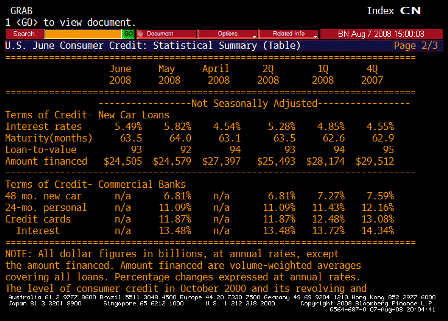
Consumers are using credit cards and loans to cover expenses as falling home values cause banks to restrict access to home- equity lines. The Bush administration sent out tax rebate checks in the past three months to help support spending, which accounts for more than two-thirds of the economy.

“Consumers are stressed, and some who are short of cash are relying more on credit cards,” Joseph Brusuelas, chief economist at Merk Investments LLC in Palo Alto, California, said before the report.


[top]