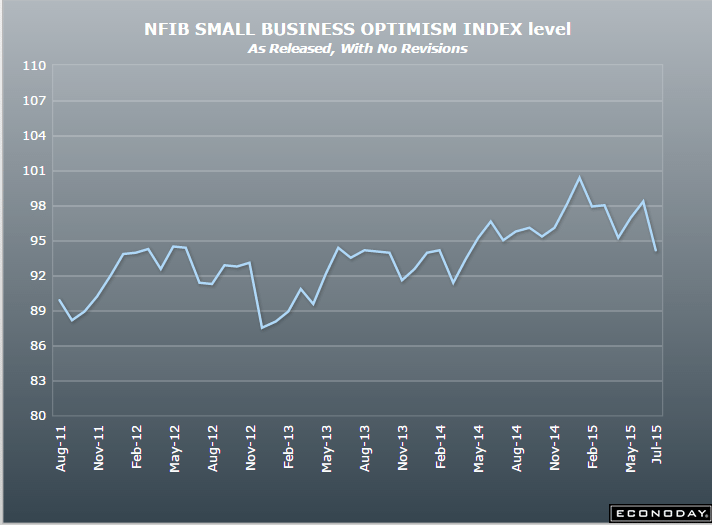
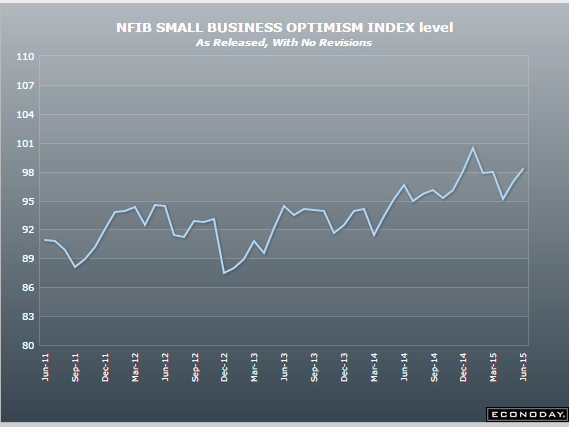
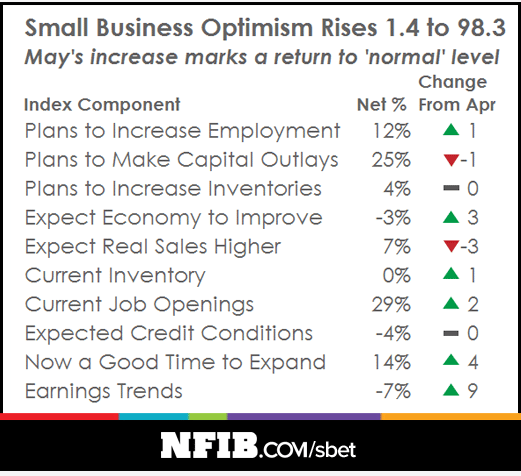
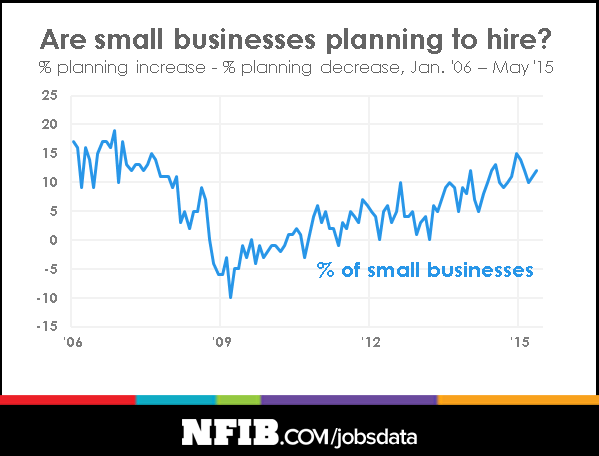
The cheer leaders didn’t bother to report on this they way they did when employment was increasing:
July 1 (Reuters) — The National Federation of Independent Business said its monthly survey of members found hiring was little changed last month. Fifty-two percent of small business owners reported hiring or trying to hire, with 44 percent of those reporting few or no qualified applicants for the positions they were trying to fill. Twenty-four percent reported job openings they could not fill, down from 29 percent in May, the NFIB said. The share of business owners looking to increase employment dropped six points, to 16 percent, while those planning reductions was up two points, at 6 percent.
Too stupid an article for me to pass up:
July 2 (Nikkei) — The BOJ’s holdings of long-term Japanese government bonds rose by 80 trillion yen a year, and its total assets expanded to 324 trillion yen at the end of fiscal 2014. The bank’s return on assets, that is, net profit divided by total assets, stood at 0.31%. If the interest rate goes up by 1 percentage point the bank’s unrealized losses are estimated to jump from 3.3 trillion yen at the end of March 2013 to 13.8 trillion yen at the end of March 2015. With the BOJ’s assets now equal to 64.7% of Japan’s GDP the credibility of the central bank is tied to the Japanese government’s fiscal discipline.
Not good, remember how they cheered the 280,000 new jobs in May, and downplayed the rise in unemployment and the increase in the participation rate? Now May is down to 254,000 and the participation rate fell way back, so they are playing up the drop in unemployment. And note the lack of comments over the deceleration of the year over year growth of employment since oil prices fell. And watch how they cling to their ‘wage inflation’ story even as growth rates again fall back:
NFP
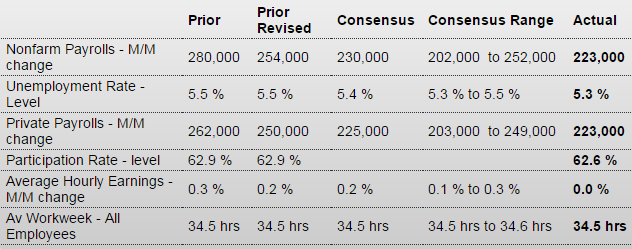
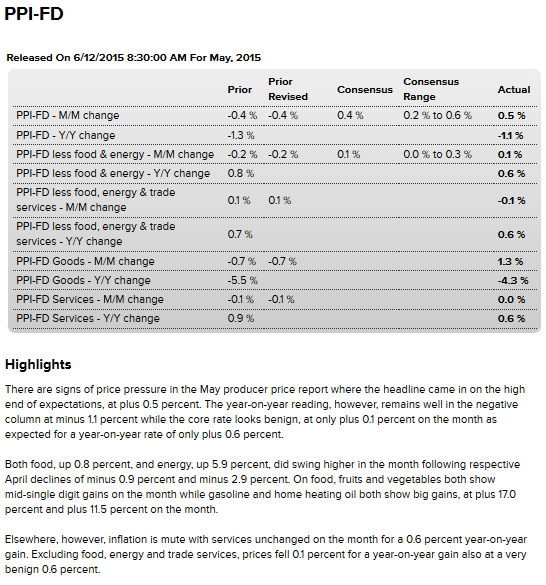
Highlights
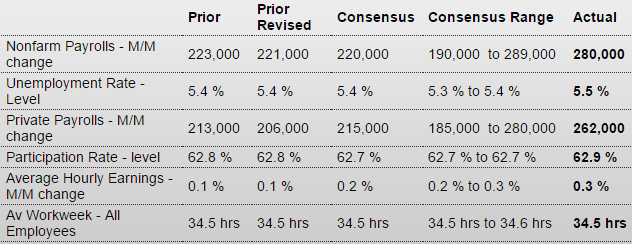
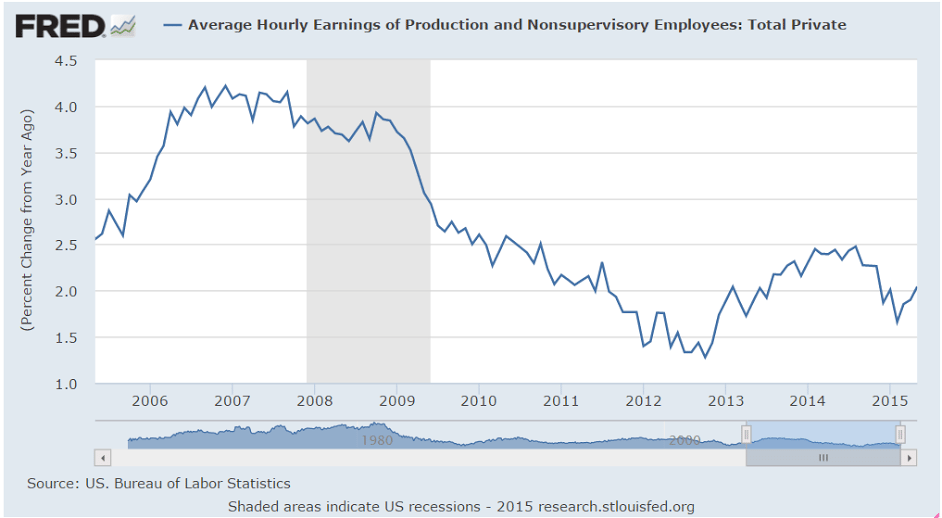
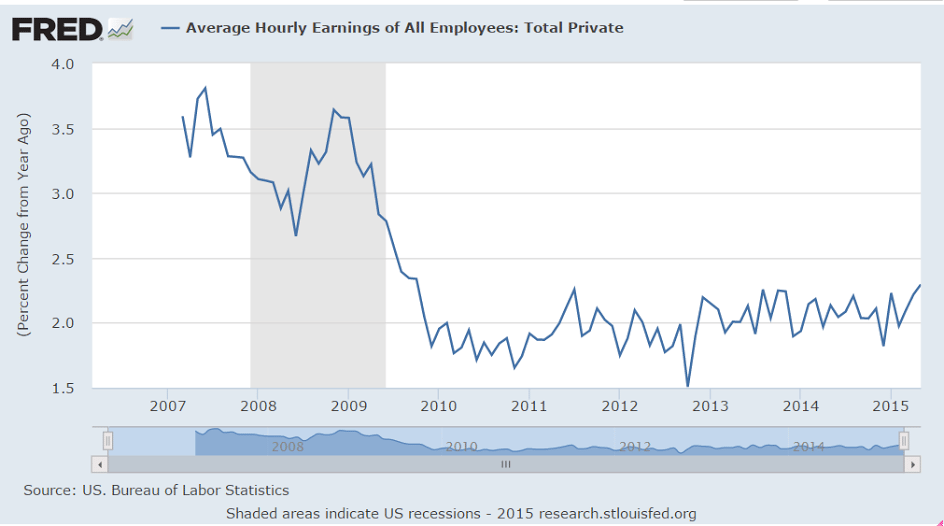
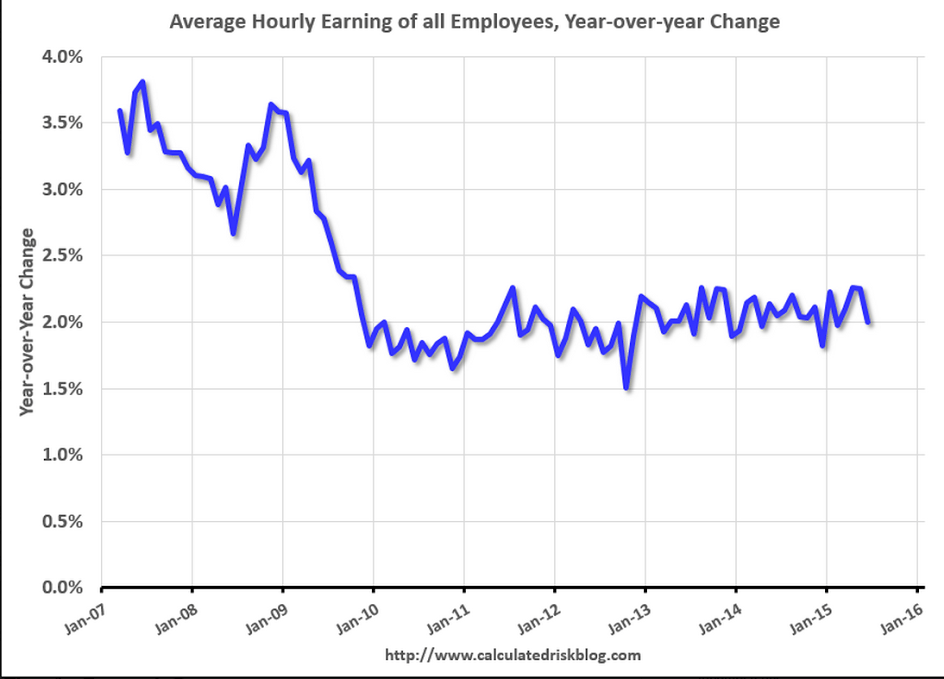
Push back that rate hike, at least that will be the initial reaction to June’s softer-than-expected employment report where nonfarm payroll growth came in at 223,000 vs Econoday expectations for 230,000 and include downward revisions totaling 60,000 to the two prior months (May revised to 254,000 from 280,000 and April to 187,000 from 221,000). Softness in payroll growth combines with softness in wage pressures with average hourly earnings unchanged in the month and the year-on-year rate moving down to 2.0 percent from 2.3 percent.
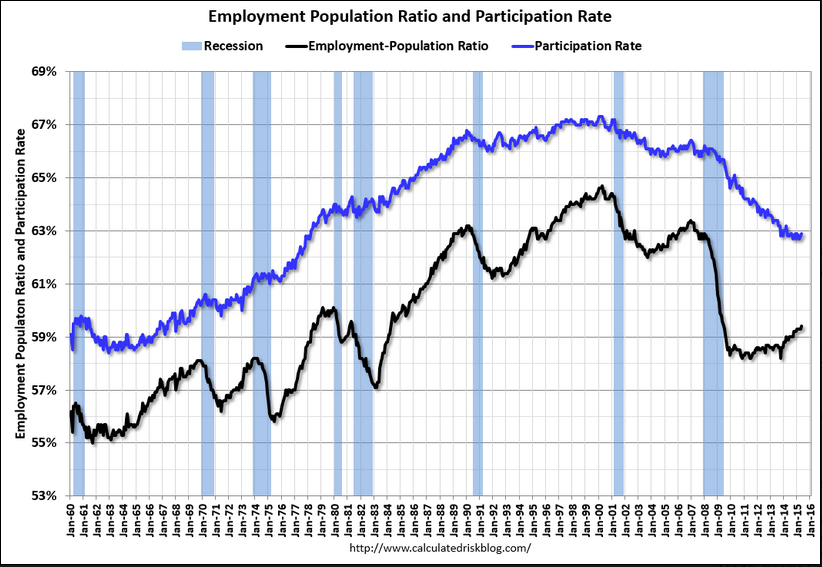
Timing distortions tied to the end of the school year, specifically new entrants to the labor market, appear to have pulled down the unemployment rate to 5.3 percent from 5.5 percent as the labor force in the household part of the report shrunk sharply, in turn pulling down the labor force participation rate by 3 tenths to an unusually low 62.6 percent. The U-6 unemployment rate, a favorite of Fed Chair Janet Yellen’s, fell 3 tenths to 10.5 percent.
Turning back to the establishment part of the report, private payrolls rose 223,000 vs a revised 250,000 in May. The average workweek was unchanged at 34.5 hours. Industries of note include a solid 33,000 rise in retail jobs and a 64,000 rise in professional & business service jobs. The latter reading includes a solid 20,000 rise in temporary help that hints at gains for permanent hiring ahead. Manufacturing and construction jobs were flat.
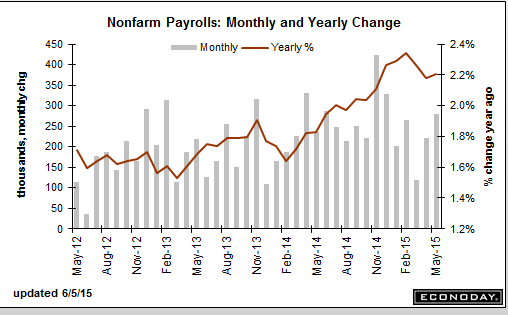
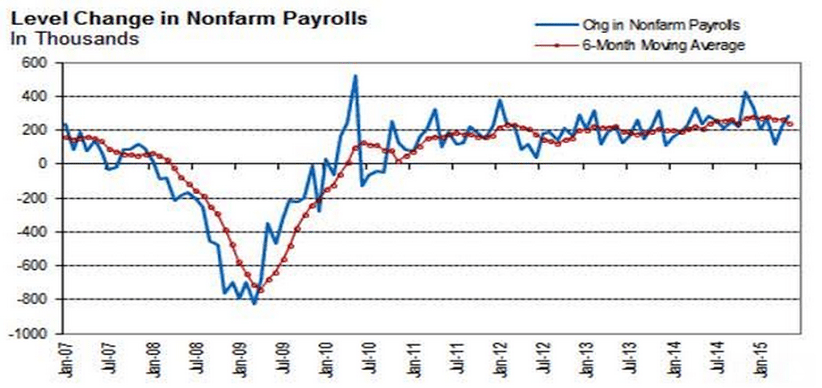
Focusing on trends, nonfarm payroll growth averaged 221,000 in the second quarter vs 195,000 in the first quarter which, despite the disappointment in today’s report, is solid improvement. The employment side of the labor market isn’t gangbusters but it is moving in the right direction while the unemployment side is increasingly favorable. This is a mixed report with special factors and isn’t likely to shake up the markets.
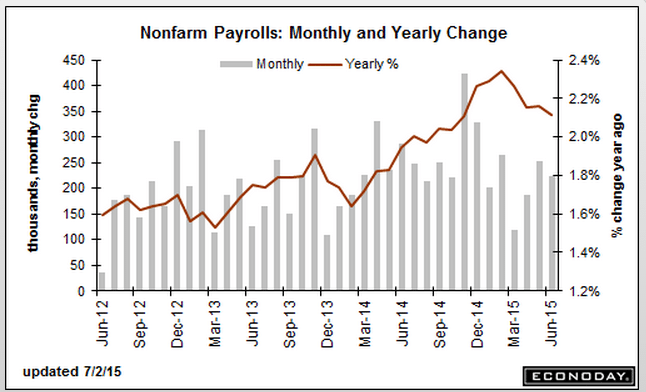
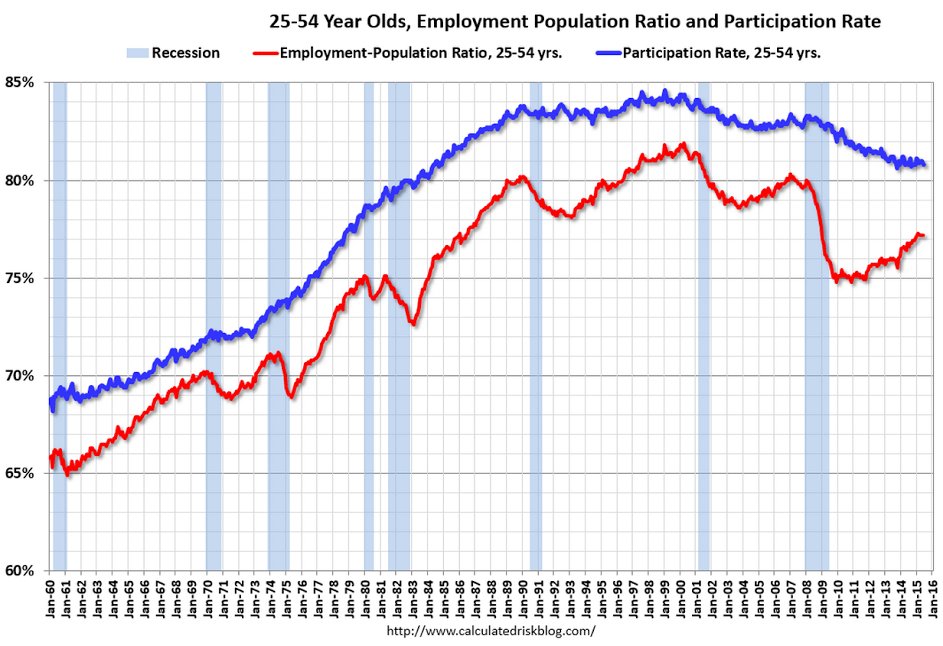
No demographics here- just a big fat lack of aggregate demand:
They call every zig up the start of ‘wage inflation’ even as they are all followed by zigs down:
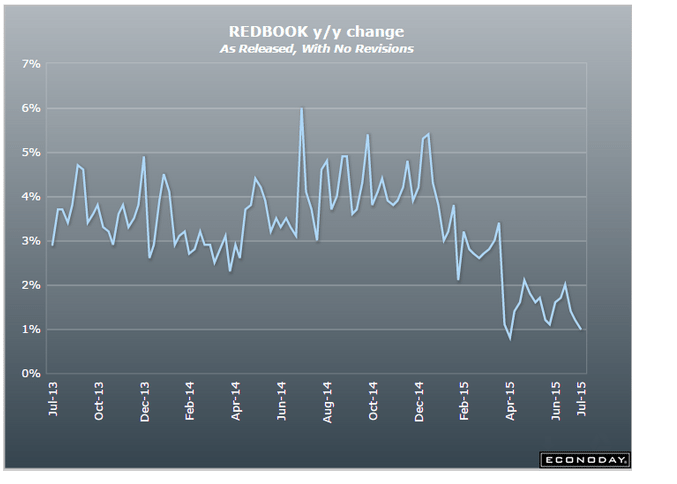
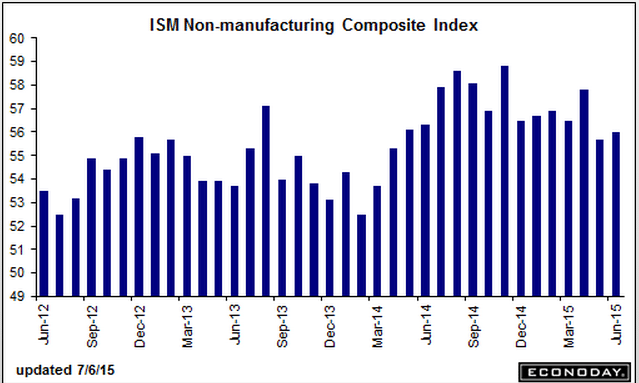
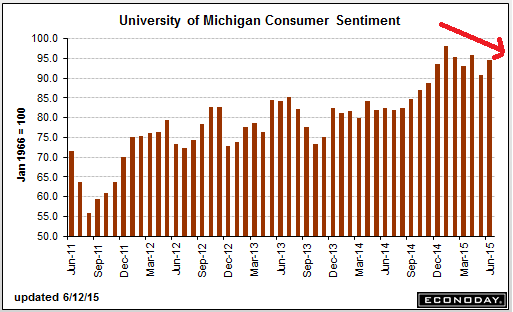
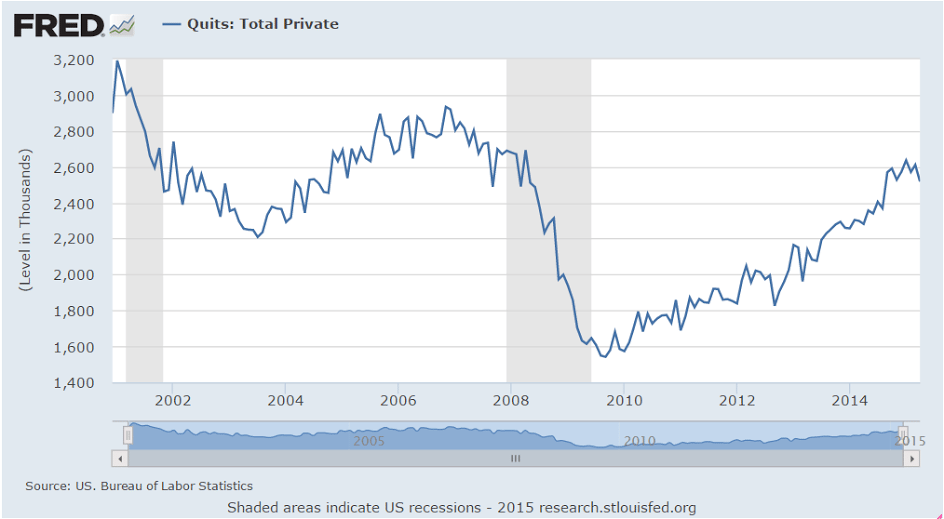
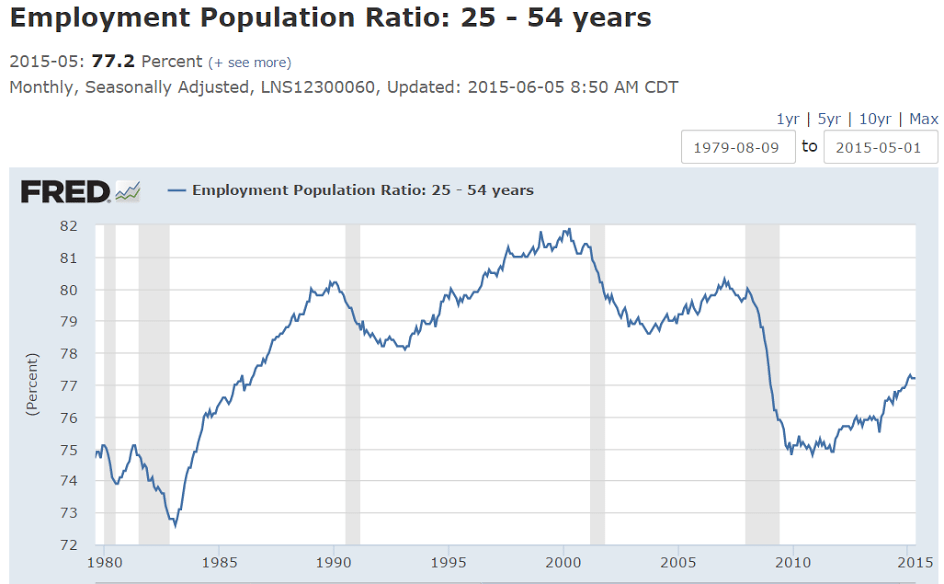
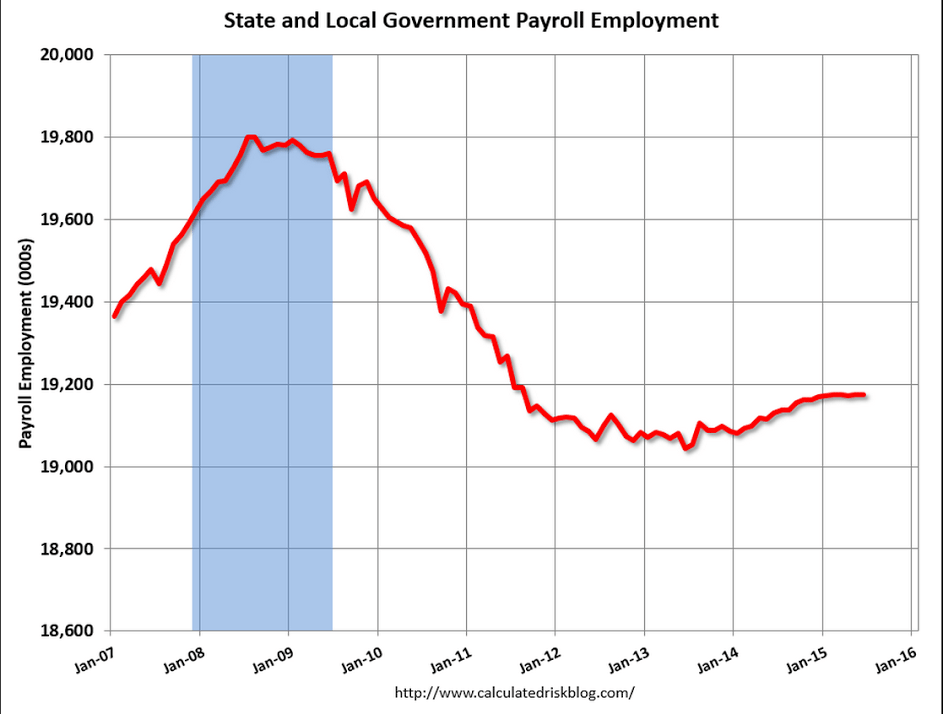
This too has leveled off after being touted for ‘lift off’ when it turned up a bit. And state and local deficits keep falling as tax revenues increase, which is an increase of fiscal drag:
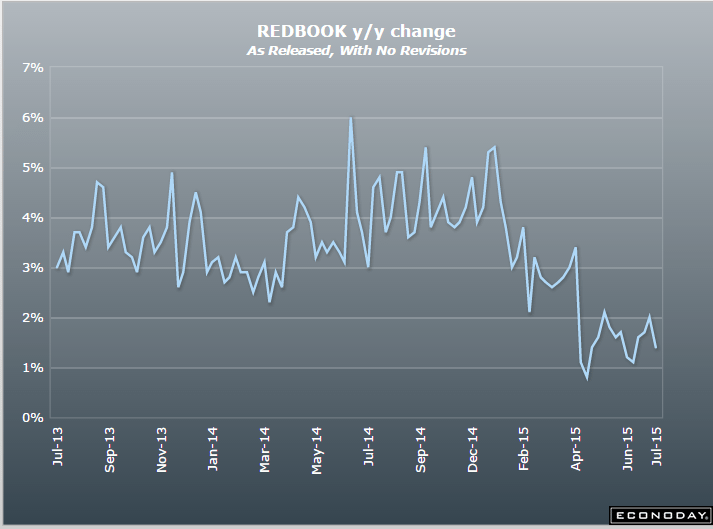
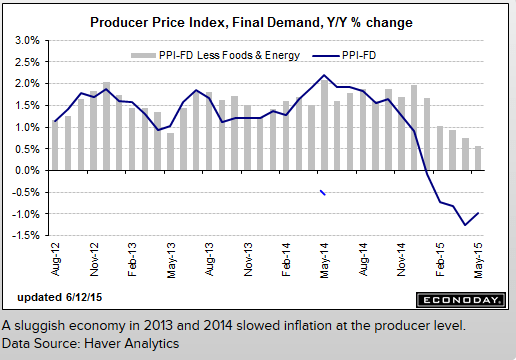
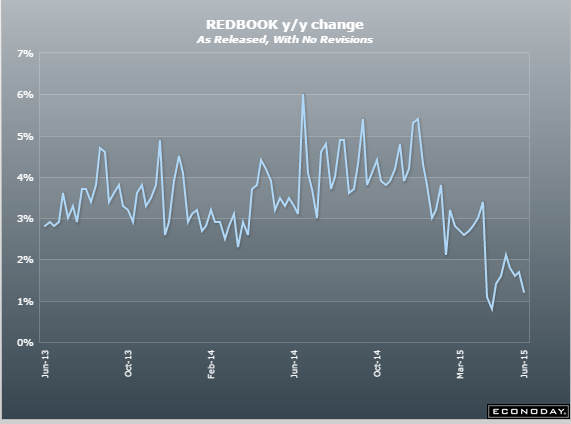
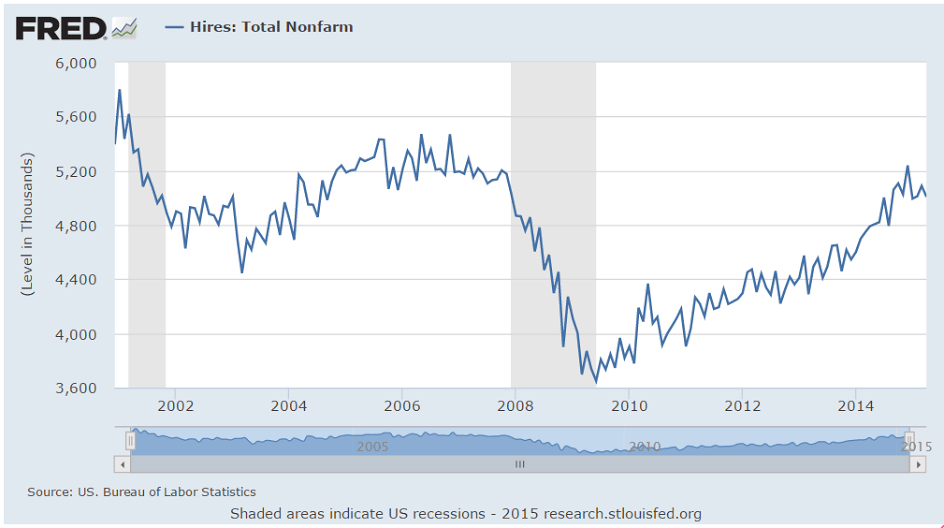
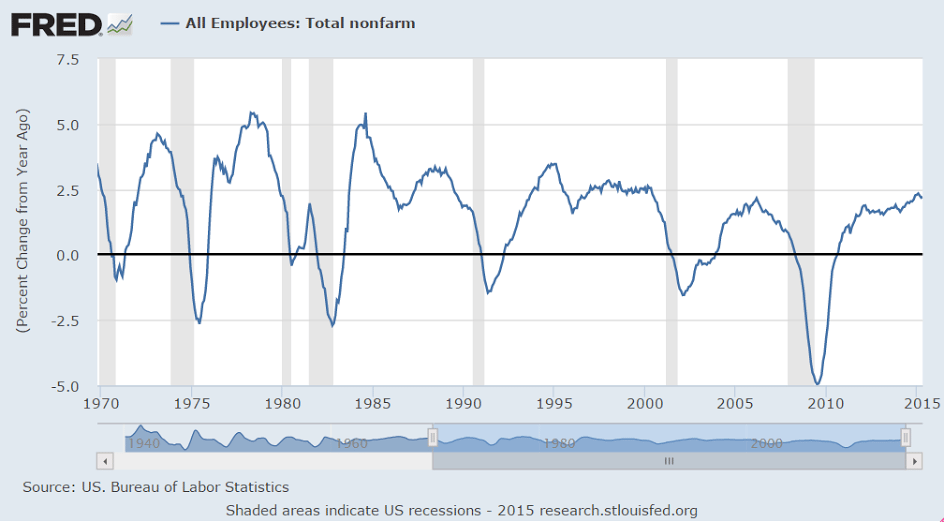
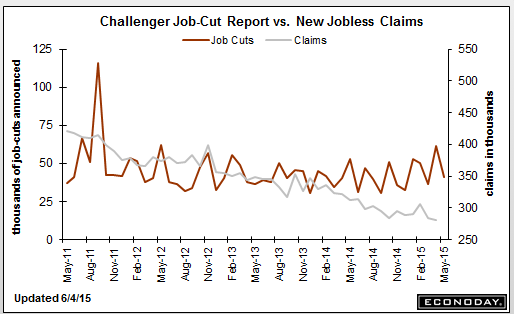
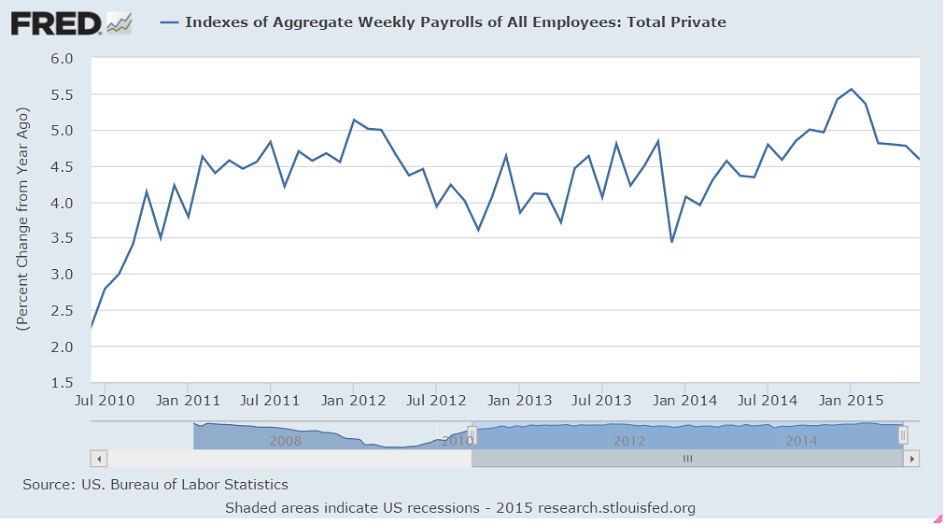
The rate of growth here had be on the rise but more recently has reversed:
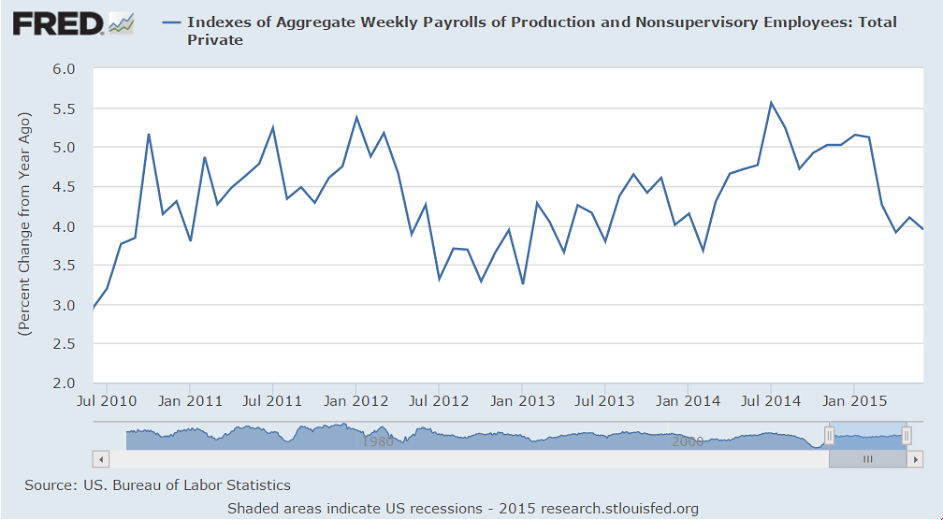
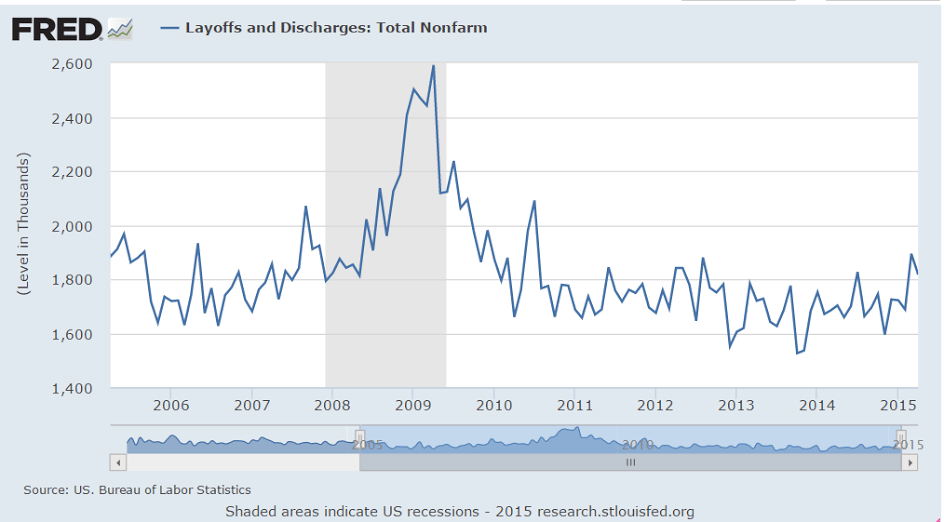
Up a tad but still low historically:
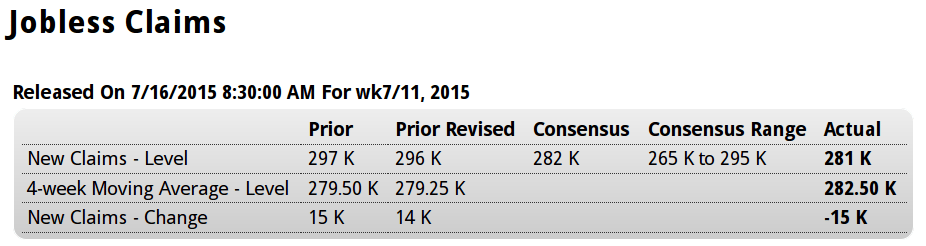
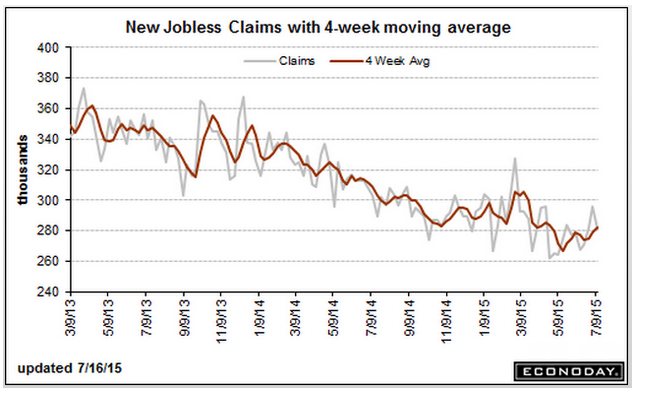
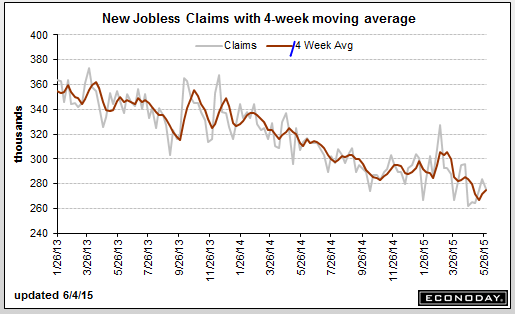
United States : Jobless Claims

Highlights
Unemployment is very low right now, underscored by today’s 2 tenths drop in the unemployment rate to 5.3 percent and by the latest in jobless claims data where initial claims came in at 281,000 in the June 27 week. This is up 10,000 from the prior week but remains very low. The 4-week average inched 1,000 higher to a 274,750 level that is little changed from the month-ago comparison.
Continuing claims, where data lag by a week, rose 15,000 to 2.264 million in the June 20 week. The 4-week average is up 15,000 to 2.253 million. These readings, like those for initial claims, are also very low. The unemployment rate for insured workers is unchanged at 1.7 percent in another reading that is very low.
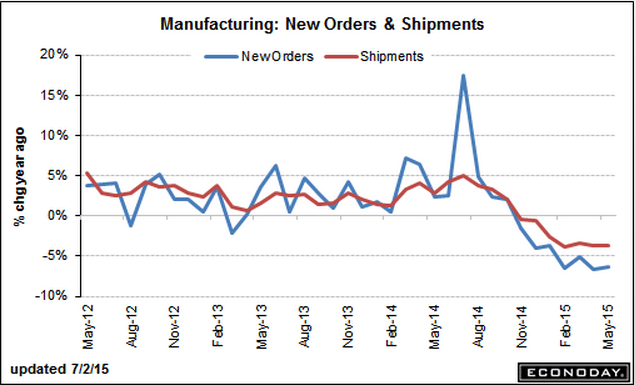
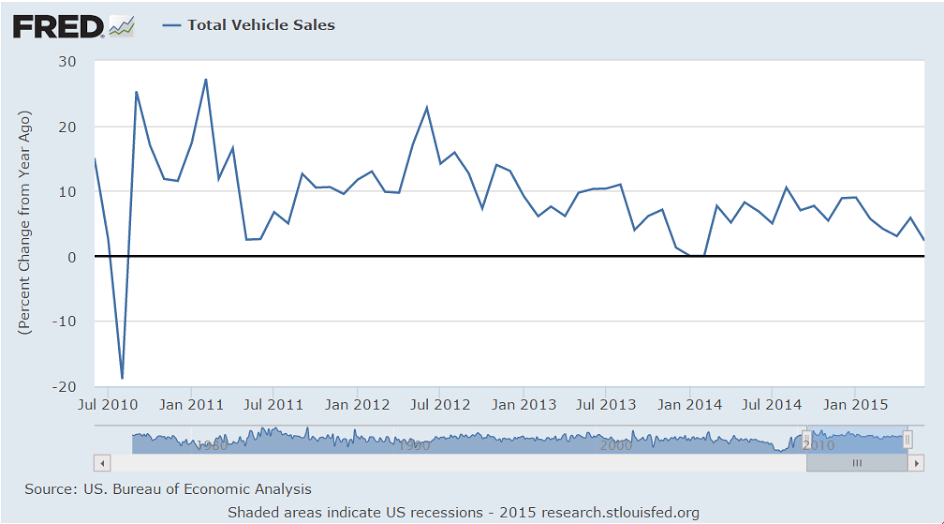
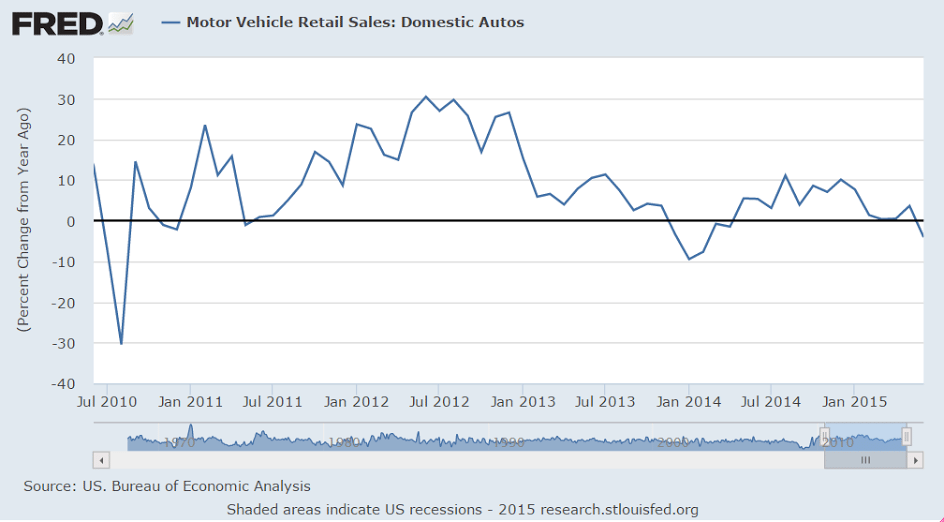
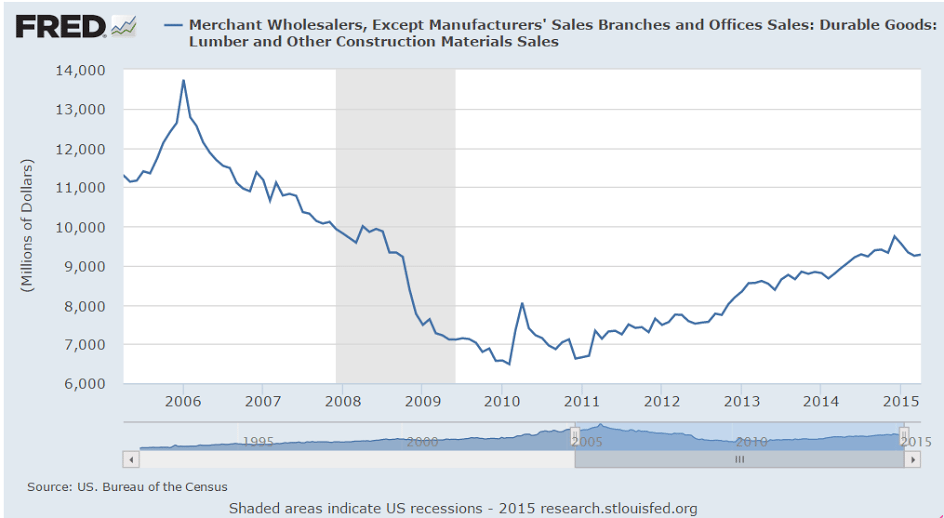
Another big negative ‘surprise’, and note the weak export comment, and how autos were weak despite higher May sales. Might be because of the high import content of those sales?
United States : Factory Orders
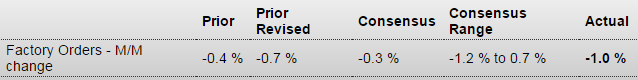
Highlights
The factory sector, hit by weak exports, continues to stumble with factory orders down 1.0 percent in May. This compares with Econoday expectations for minus 0.3 percent and is near the low-end estimate for minus 1.2 percent.
The durables component of the report, initially released last week, is now revised lower, to minus 2.2 percent from minus 1.8 percent. Durables in April have also been revised lower to minus 1.7 percent from minus 1.5 percent. The nondurables component, released with today’s report, helped limit the damage but not by much, up 0.2 percent on gains for petroleum and coal following a 0.3 percent gain for April.
But aircraft orders, always volatile, are to blame for much of the durables weakness, falling 49.4 percent in the month. Excluding transportation equipment, which is where aircraft orders are tracked, factory orders were unchanged in May which isn’t great but is much better than the minus 0.6 percent print for April.
Weakness in energy equipment is also a negative factor of the factory sector, down 22.2 percent in May following a 2.1 percent decline in April. Motor vehicle orders are also surprisingly weak, down 1.3 percent in May despite very strong sales. Orders for defense aircraft were also weak, down 6.4 percent.
Capital goods data had been showing some life but not much anymore with nondefense orders excluding aircraft down 0.4 percent following a 0.7 percent decline in April. These are especially disappointing readings. And core shipments of capital goods are dead flat, at minus 0.1 percent following only a 0.2 percent gain in April. These readings will likely pull down second-quarter GDP estimates.
Other disappointments include a steep 0.5 percent decline in total unfilled orders following April’s 0.2 percent decline. Declines in unfilled orders are not a good omen for employment. Total shipments fell 0.1 percent in the month. Inventories at least are stable, unchanged in the month as is the inventory-to-shipments ratio at 1.35.
First there was the unemployment report this morning and now this report, both of which may raise concern among the doves at the Fed that the second-quarter bounce back is not much of a bounce back at all.